
1. Introduction
In the context of global environmental pollution and excessive energy consumption, the development and utilization of renewable energy sources have become a crucial component of sustainable energy policies worldwide. Among renewable energy technologies, solar photovoltaic (PV) systems have attracted significant attention due to their abundant resources, cleanliness, and non-polluting characteristics. According to the China Energy Big Data Report, solar power generation reached 261.1 TWh in 2020, a year-on-year increase of 16.6%. As the installed capacity of PV systems continues to grow, ensuring the reliability and safety of PV power generation equipment becomes increasingly important.
The photovoltaic inverter is one of the most critical balance-of-system components in a PV generation system. Its main function is to convert the variable DC voltage generated by PV arrays into AC power suitable for grid connection. The core power semiconductor devices inside the inverter are Insulated Gate Bipolar Transistors (IGBTs). IGBTs are widely used because of their fast switching speed, low saturation voltage drop, and simple gate drive requirements. However, IGBTs are also the most failure-prone components in PV inverters. Failures can be broadly categorized into two types: aging failures and open-circuit failures. Aging failures result from gradual degradation due to thermal cycling, wire bonding fatigue, and solder layer cracking. Open-circuit failures are often caused by electrical overstress, electrostatic discharge, latch-up, or thermal overstress. When an IGBT fails, the inverter may continue operating for a while, but with degraded performance and increased stress on other components, which can ultimately lead to a complete system shutdown and severe economic losses. Therefore, accurate fault detection and precise localization of faulty IGBTs are of great practical value.
Traditional fault diagnosis methods rely mainly on physical models or signal processing techniques. With the advancement of artificial intelligence, data-driven approaches based on deep learning have become increasingly popular. These methods can automatically extract high-level features from raw measurement data and achieve superior classification accuracy. In this thesis, I focus on the application of deep learning methods for two major IGBT failure modes in solar inverters: aging fault prediction and open-circuit fault diagnosis and localization. Three novel methods are proposed:
- A label-free aging fault prediction method based on Temporal Convolutional Networks (TCN).
- A single-label open-circuit fault diagnosis method based on an attention-based Long Short-Term Memory (LSTM) network.
- A multi-label open-circuit fault localization method based on a modified attention-LSTM architecture.
These methods aim to exploit the temporal context information of fault signals and improve the accuracy and robustness of fault detection and localization in solar inverters.
2. Photovoltaic System Simulation and Fault Modeling
2.1 System Description
A two-stage three-phase grid-connected PV system was designed in MATLAB/Simulink to simulate various IGBT open-circuit faults. The main components of the system are:
- A PV array model,
- A boost DC-DC converter with Maximum Power Point Tracking (MPPT),
- A three-phase DC-AC inverter consisting of six IGBTs (T1, T2, T3, T4, T5, T6),
- Filter inductors,
- A grid-connected control system using dual closed-loop voltage/current control in the dq rotating reference frame.
The MPPT algorithm adopted is the perturbation and observation (P&O) method, which perturbs the operating point periodically and observes the change in power to track the maximum power point. The control strategy ensures that the inverter output current is synchronized with the grid voltage using a phase-locked loop (PLL). The sampling frequency was set to 10 kHz, the simulation duration was 4.1 s, and sampling started at 0.1 s. To simulate varying environmental conditions, the solar irradiance was changed from 700 W/m² to 1000 W/m² at 0.25 s. The main parameters of the simulated system are listed in Table 1.
| Parameter | Value |
|---|---|
| Resistance | 0.1 Ω |
| Inductance | 0.002 H |
| Irradiance | 700 W/m², 1000 W/m² |
| Sampling time | 4.1 s |
| Sampling frequency | 10⁴ Hz |
| Three-phase current frequency | 50 Hz |
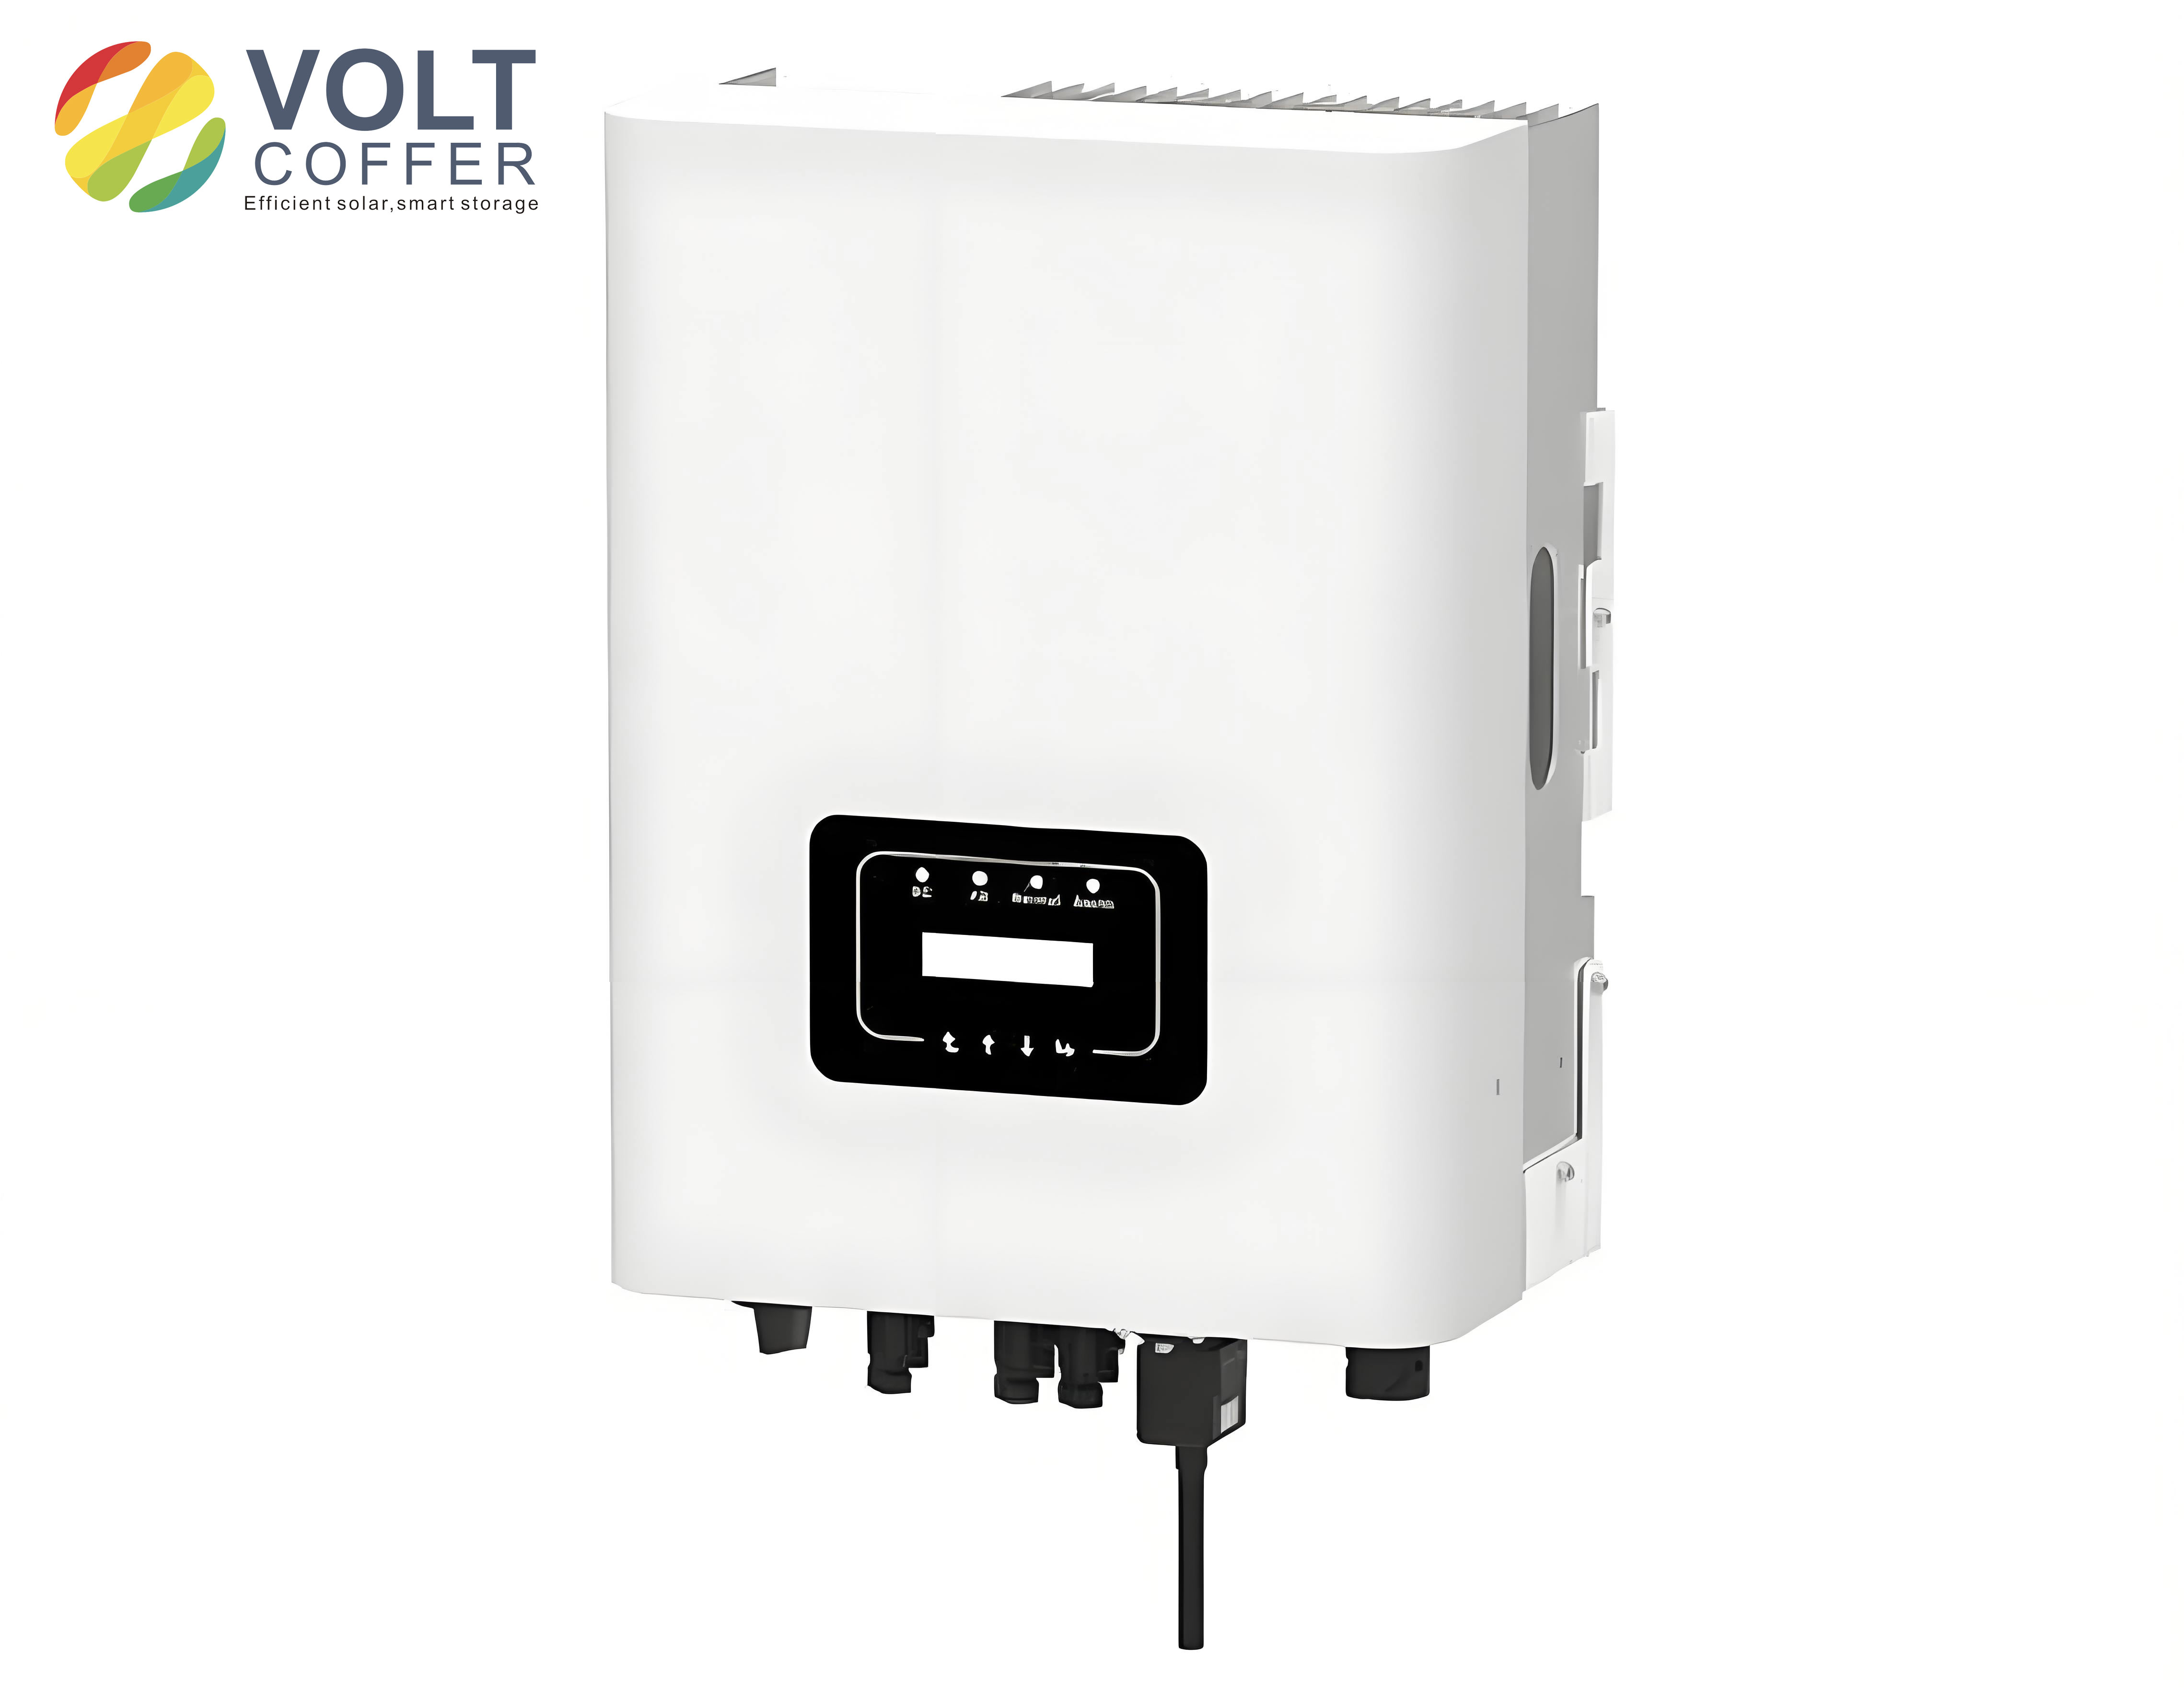
The total harmonic distortion (THD) of the grid-connected current was evaluated using the FFT Analysis tool in Simulink. The measured THD was about 1.94%, which is lower than the 2% threshold, confirming the validity and practical feasibility of the simulation model.
2.2 IGBT Failure Mechanisms
IGBT failures in solar inverters can be classified into three main categories: failures during manufacturing, failures due to environmental impacts during operation (such as open-circuit and short-circuit faults), and aging failures. Among these, open-circuit and aging failures are the most relevant to the long-term reliability of PV inverters.
Aging failure of IGBT modules is mainly caused by two mechanisms: solder layer fatigue and bond wire liftoff. Because the materials inside an IGBT module have different coefficients of thermal expansion, repeated thermal cycling induces mechanical stress at the interfaces among the copper base plate, solder layers, direct bonded copper (DBC) substrate, and silicon chip. Over time, micro-cracks propagate through the solder layer, increasing the thermal resistance and degrading the heat dissipation capability. Bond wires are also subjected to alternating thermal stress, leading to liftoff and increased contact resistance. Both mechanisms are strongly related to the junction temperature swing.
Accidental failures such as electrical overstress, electrostatic discharge, latch-up, and over-temperature faults can also lead to sudden open-circuit or short-circuit failures. In many practical cases, an open-circuit IGBT failure does not immediately shut down the inverter, but it forces other IGBTs to carry higher currents, which may trigger secondary failures. Therefore, online open-circuit fault detection and location are essential for maintaining the reliability of solar inverters.
2.3 Simulation of Aging Faults
The aging process of an IGBT can be accelerated by power cycling tests. In this work, the accelerated aging dataset published by the NASA Prognostics Center of Excellence is utilized. The experimental conditions used in the accelerated aging test are summarized in Table 2.
| Experimental condition | Value |
|---|---|
| IGBT | Single module |
| PWM duty cycle | 40% |
| Gate voltage | 10 V |
| Switching frequency | 10 kHz |
| Case temperature | 260 °C – 270 °C |
During the aging process, several electrical parameters were recorded, including the collector-emitter voltage, collector-emitter current, gate voltage, and package temperature. Among these, the collector-emitter transient turn-off peak voltage shows a clear decreasing trend with device degradation. Therefore, this parameter is selected as the aging failure characteristic parameter. The degradation process of this peak voltage is illustrated in Figure 1 of the original study. Based on the dataset, a total of 418 samples were collected over approximately 170 minutes. Each sample contains 100,000 voltage measurement points. The extracted peak voltage values exhibit strong fluctuations and some outliers, so data preprocessing is required.
2.4 Simulation of Open-Circuit Faults
The six IGBTs in the three-phase inverter are numbered as T1, T2, T3, T4, T5, and T6. In the simulation model, each IGBT is equipped with a manually controlled switch to emulate open-circuit faults. A single open-circuit fault can occur in any of the six IGBTs, and two simultaneous open-circuit faults can be classified into the following categories:
- Both IGBTs in the same phase leg (e.g., T1 and T4).
- Both IGBTs in the same half-bridge (e.g., T1 and T3).
- Both IGBTs in the lower half-bridge (e.g., T4 and T6).
- Two IGBTs located in different phases and different half-bridges (e.g., T1 and T6).
Together with the normal condition and single-open-circuit faults, there are 22 possible operating states of the inverter. The DC-side current waveforms for different fault states are collected as fault signatures. Compared with the normal condition, open-circuit faults cause larger ripples in the DC-side current, and each fault type has a distinct waveform pattern.
3. Aging Fault Prediction Using Temporal Convolutional Networks
3.1 Data Acquisition and Preprocessing
The collector-emitter turn-off peak voltage extracted from the NASA accelerated aging dataset is used as the input to the prediction model. Because the raw data contain outliers and high-frequency noise, a quadratic exponential smoothing method is employed to reduce fluctuation while preserving the underlying degradation trend. The figure below presents the original and processed data (not shown in this article). After removing the first few anomalous samples and applying smoothing, the dataset is normalized using the Min-Max normalization technique.
The Min-Max normalization is defined as:
$$
X_{\mathrm{std}} = \frac{X – X_{\min}}{X_{\max} – X_{\min}}
$$
$$
X_{\mathrm{scaled}} = X_{\mathrm{std}} \times (\mathrm{max} – \mathrm{min}) + \mathrm{min}
$$
where \(X_{\max}\) and \(X_{\min}\) are the maximum and minimum values of the sample set, and \(\mathrm{max}\) and \(\mathrm{min}\) are the desired scaling range. This normalization improves the convergence speed and avoids gradient explosion during training.
3.2 Temporal Convolutional Network Model
The Temporal Convolutional Network (TCN) is a variant of convolutional neural networks designed for sequence modeling. It combines two key elements: dilated causal convolution and residual blocks. The causal convolution ensures that the output at time \(t\) depends only on the inputs at times \(t\) and earlier, preventing information leakage from the future. Dilated convolution allows the receptive field to grow exponentially with the number of layers, which enables efficient modeling of long-range dependencies. The dilated causal convolution operation can be expressed as:
$$
F(s) = \sum_{i=0}^{k-1} f(i) \cdot x_{s – d \cdot i}
$$
where \(F(s)\) is the output at position \(s\), \(f(i)\) is the filter, \(d\) is the dilation factor, and \(k\) is the kernel size. In the proposed TCN model, the dilation factor \(d\) takes the values 1, 2, and 4 in successive layers.
Residual blocks are integrated into the TCN to mitigate the degradation problem when the network depth increases. Each residual block contains two layers of dilated causal convolution, two ReLU activation functions, two dropout layers, and a 1×1 convolution on the skip connection if the input and output dimensions differ. The output of a residual block is:
$$
y = \mathrm{Activation}(x + \mathcal{F}(x))
$$
where \(\mathcal{F}\) represents the residual mapping. The overall architecture of the TCN-based aging fault prediction model is as follows: the input time series \(x_0, x_1, \dots, x_t\) is fed into a stack of residual blocks, then the output is passed through a fully connected layer to produce the predicted future value.
3.3 Experiments and Results
The preprocessed data are split into a training set (70%) and a test set (30%). The proposed TCN model is compared with two baseline models: Long Short-Term Memory networks (LSTM) and Gated Recurrent Unit networks (GRU). The hyperparameters of each model were tuned to achieve the best performance. Table 3 summarizes the hyperparameter settings.
| Model | Hyperparameters |
|---|---|
| LSTM | Learning rate 0.001, 2 layers, 200 and 50 hidden units, 20 epochs, Adam optimizer, MSE loss |
| GRU | Learning rate 0.001, 2 layers, 100 and 50 hidden units, 20 epochs, Adam optimizer, MSE loss |
| TCN | Learning rate 0.001, 1 residual block, 600 filters, kernel size 2, dilation [1,2,4], ReLU, dropout 0.05, Adam optimizer, MSE loss |
Two common performance metrics are used to evaluate the prediction accuracy: Root Mean Square Error (RMSE) and Mean Absolute Error (MAE). These metrics are defined as:
$$
\mathrm{RMSE} = \sqrt{\frac{1}{M}\sum_{i=1}^{M}\left(y_i – \hat{y}_i\right)^2}
$$
$$
\mathrm{MAE} = \frac{1}{M}\sum_{i=1}^{M}\left|y_i – \hat{y}_i\right|
$$
where \(y_i\) is the true value and \(\hat{y}_i\) is the predicted value. Table 4 lists the RMSE and MAE results for the three models.
| Model | RMSE | MAE |
|---|---|---|
| LSTM | 0.0347 | 0.0292 |
| GRU | 0.0297 | 0.0264 |
| TCN | 0.0258 | 0.0216 |
The TCN model achieves the lowest RMSE (0.0258) and MAE (0.0216) values. Compared with the LSTM model, the TCN improves the prediction accuracy by approximately 26% in both metrics. The results demonstrate that the TCN can effectively predict IGBT aging fault characteristics with better accuracy and robustness than recurrent networks. The main advantages of TCN include the ability to process sequences in parallel, flexible receptive fields, and alleviation of gradient vanishing problems.
3.4 Effect of Smoothing Preprocessing
To verify the necessity of the exponential smoothing step, experiments were conducted with and without smoothing preprocessing. The results showed that the model trained on smoothed data achieves significantly lower prediction errors and a more stable loss curve than the model trained on raw noisy data. The quadratic exponential smoothing method reduces harmonic components and stabilizes the trend, which improves the learning quality of the network. Therefore, data smoothing is an essential preprocessing step for high-quality aging prediction.
4. Single-Label Open-Circuit Fault Diagnosis
4.1 Data Collection and Labeling
The DC-side current of the inverter is selected as the monitoring signal. Since the DC side requires only a single current sensor, this approach reduces the hardware cost compared with measuring three-phase AC currents. For each IGBT open-circuit fault state, the DC-side current was recorded for 4 seconds at a sampling rate of 10 kHz, resulting in 40,000 sample points per fault condition. Each 40,000-point time series is then divided into 20 segments of length 2,000. After processing all 22 states, the total dataset consists of 440 segments. The dataset is split into a training set and a test set with a ratio of 4:1, yielding 352 training segments and 88 test segments.
For single-label classification, each open-circuit state is assigned a unique label from 0 to 21. The label mapping is shown in Table 5.
| Fault type | Faulty IGBTs | Label |
|---|---|---|
| Normal | None | 0 |
| Single IGBT | T1 | 1 |
| Single IGBT | T2 | 2 |
| Single IGBT | T3 | 3 |
| Single IGBT | T4 | 4 |
| Single IGBT | T5 | 5 |
| Single IGBT | T6 | 6 |
| Same phase | T1, T4 | 7 |
| Same phase | T3, T6 | 8 |
| Same phase | T2, T5 | 9 |
| Same half-bridge | T1, T3 | 10 |
| Same half-bridge | T1, T5 | 11 |
| Same half-bridge | T3, T5 | 12 |
| Same half-bridge | T4, T6 | 13 |
| Same half-bridge | T2, T4 | 14 |
| Same half-bridge | T2, T6 | 15 |
| Cross | T1, T6 | 16 |
| Cross | T1, T2 | 17 |
| Cross | T3, T4 | 18 |
| Cross | T4, T5 | 19 |
| Cross | T2, T3 | 20 |
| Cross | T5, T6 | 21 |
Before training, the data are standardized using the mean and standard deviation of the training set:
$$
z = \frac{x – \mu}{s}
$$
where \(\mu\) and \(s\) are the mean and standard deviation of the training samples.
4.2 Attention-Based LSTM Network
The Long Short-Term Memory (LSTM) network is a well-known type of recurrent neural network that can capture long-term dependencies in sequential data. The core components of LSTM are the input gate, forget gate, and output gate. The forward propagation equations of an LSTM cell are:
$$
i_t = \sigma(W_i \cdot [h_{t-1}, x_t] + b_i)
$$
$$
\tilde{C}_t = \tanh(W_c \cdot [h_{t-1}, x_t] + b_c)
$$
$$
f_t = \sigma(W_f \cdot [h_{t-1}, x_t] + b_f)
$$
$$
C_t = f_t \cdot C_{t-1} + i_t \cdot \tilde{C}_t
$$
$$
o_t = \sigma(W_o \cdot [h_{t-1}, x_t] + b_o)
$$
$$
h_t = o_t \cdot \tanh(C_t)
$$
where \(\sigma\) is the sigmoid activation function, \(W\) and \(b\) are the weight matrices and biases, \(i_t\), \(f_t\), and \(o_t\) are the input, forget, and output gates, \(C_t\) is the cell state, and \(h_t\) is the hidden state. The LSTM is able to decide which information to store, forget, and output through the gating mechanism.
However, a standard LSTM treats all time steps equally in the final hidden state. To emphasize the most informative time steps, an attention mechanism is incorporated. The attention mechanism computes a weighted sum of the LSTM hidden states. Given the hidden states \(h_i\) for \(i=1,\dots,T\) and the last hidden state \(h_T\), an attention score is calculated as:
$$
\mathrm{score}_i = h_T^T \cdot h_i
$$
$$
\alpha_i = \frac{\exp(\mathrm{score}_i)}{\sum_{j=1}^{T} \exp(\mathrm{score}_j)}
$$
$$
v = \sum_{i=1}^{T} \alpha_i h_i
$$
The weighted context vector \(v\) is then passed to a fully connected layer followed by a Softmax classifier to produce the fault type probability distribution.
The overall architecture of the proposed Attention-LSTM diagnosis model is shown in Figure 5 of the original dissertation. The model inputs are one-dimensional time series segments, processed by the LSTM layers to obtain hidden state sequences, then the attention layer assigns adaptive weights to each time step, and finally the weighted context vector is fed into the output layer for classification.
4.3 Model Training and Parameter Selection
To increase the number of training samples and preserve the continuity of adjacent data, a sliding window with overlapping sampling is applied. The number of samples generated by the overlapping segmentation is computed as:
$$
N_{\text{sample}} = \frac{L_{\text{input}} – L_{\text{window}}}{L_{\text{stride}}} + 1
$$
where \(L_{\text{input}}\) is the length of the original segment, \(L_{\text{window}}\) is the sliding window length, \(L_{\text{stride}}\) is the stride between two consecutive windows, and \(N_{\text{sample}}\) is the number of generated samples (integer part). In the original setting, \(L_{\text{input}}=2000\), \(L_{\text{window}}=900\), and \(L_{\text{stride}}=200\), generating 6 samples per segment.
The stride \(L_{\text{stride}}\) is an essential hyperparameter. The diagnostic accuracy for different stride values is shown in Figure 7 of the original dissertation. The best accuracy of 0.9981 is achieved when the stride is 200, which corresponds to a time length of 0.02 s, exactly equal to one period of the AC current. Therefore, the default stride is set to 200.
During training, the CrossEntropyLoss function is used as the objective function:
$$
L = -\sum_{i=1}^{K} y_i \log(p_i)
$$
where \(K\) is the number of classes, \(y_i\) is the one-hot true label, and \(p_i\) is the predicted probability for class \(i\).
4.4 Robustness and Comparison
To test the robustness of the model in noisy environments, Gaussian noise with various signal-to-noise ratios (SNR) is artificially added to the test dataset. The SNR is defined as:
$$
\mathrm{SNR} = 10 \log_{10}\left(\frac{P_{\text{signal}}}{P_{\text{noise}}}\right)
$$
where \(P_{\text{signal}}\) and \(P_{\text{noise}}\) are the power of the signal and noise, respectively. The diagnostic accuracies under SNR levels of -1 dB, 0 dB, 1 dB, 3 dB, and 5 dB are presented in Table 6. The proposed Attention-LSTM method consistently outperforms the traditional k-Nearest Neighbors (kNN), Support Vector Machine (SVM), Convolutional Neural Network (CNN), and standard LSTM methods.
| SNR (dB) | kNN | SVM | CNN | LSTM | Attention-LSTM |
|---|---|---|---|---|---|
| -1 | 0.6023 | 0.9293 | 0.9283 | 0.9483 | 0.9545 |
| 0 | 0.6212 | 0.9545 | 0.9417 | 0.9583 | 0.9716 |
| 1 | 0.6452 | 0.9571 | 0.9567 | 0.9633 | 0.9867 |
| 3 | 0.8068 | 0.9697 | 0.9733 | 0.9767 | 0.9848 |
| 5 | 0.9407 | 0.9848 | 0.9783 | 0.9867 | 0.9943 |
The confusion matrix for the Attention-LSTM and standard LSTM methods shows that the Attention-LSTM method correctly classifies nearly all fault types, with only a few misclassifications between fault classes 11 and 16. In contrast, the standard LSTM misclassifies a higher number of samples. These results confirm that the attention mechanism effectively identifies the most discriminative temporal features and enhances classification performance.
4.5 Attention Visualization
To further understand the model, the attention weight distributions for different IGBT open-circuit states are visualized as heatmaps. In the normal state, the attention weights are relatively uniformly distributed across time steps. When an open-circuit fault occurs, the model assigns significantly higher weights to specific time intervals that contain the most distinguishing fault characteristics. This adaptive weighting is the reason for the improved diagnostic accuracy and robustness.
5. Multi-Label Open-Circuit Fault Localization
5.1 From Single-Label to Multi-Label Classification
Single-label classification assigns exactly one class label to each sample. However, when multiple IGBTs are faulty, the model must identify all faulty IGBTs simultaneously. Multi-label classification is a more natural and direct formulation for fault localization because each output dimension corresponds to the status of one IGBT. In this chapter, the open-circuit fault localization problem is treated as a multi-label classification task. A six-dimensional one-hot label vector is defined, where each element indicates whether the corresponding IGBT is faulty (1) or normal (0). Table 7 shows the multi-label encoding for the 22 operating states.
| Fault label | Fault location | One-hot label |
|---|---|---|
| 0 | Normal | [0,0,0,0,0,0] |
| 1 | T1 | [1,0,0,0,0,0] |
| 2 | T2 | [0,1,0,0,0,0] |
| 3 | T3 | [0,0,1,0,0,0] |
| 4 | T4 | [0,0,0,1,0,0] |
| 5 | T5 | [0,0,0,0,1,0] |
| 6 | T6 | [0,0,0,0,0,1] |
| 7 | T1, T4 | [1,0,0,1,0,0] |
| 8 | T3, T6 | [0,0,1,0,0,1] |
| 9 | T2, T5 | [0,1,0,0,1,0] |
| 10 | T1, T3 | [1,0,1,0,0,0] |
| 11 | T1, T5 | [1,0,0,0,1,0] |
| 12 | T3, T5 | [0,0,1,0,1,0] |
| 13 | T4, T6 | [0,0,0,1,0,1] |
| 14 | T2, T4 | [0,1,0,1,0,0] |
| 15 | T2, T6 | [0,1,0,0,0,1] |
| 16 | T1, T6 | [1,0,0,0,0,1] |
| 17 | T1, T2 | [1,1,0,0,0,0] |
| 18 | T3, T4 | [0,0,1,1,0,0] |
| 19 | T4, T5 | [0,0,0,1,1,0] |
| 20 | T2, T3 | [0,1,1,0,0,0] |
| 21 | T5, T6 | [0,0,0,0,1,1] |
The multi-label approach directly reveals which specific IGBTs are faulty. For instance, if the model output is [1,1,0,0,0,0], then T1 and T2 are identified as open-circuited. This kind of interpretable output is valuable for rapid maintenance decisions.
5.2 Attention-LSTM for Multi-Label Localization
The architecture of the multi-label Attention-LSTM model is similar to the single-label version, but with two significant modifications. First, the output layer has only six neurons (corresponding to the six IGBT positions) instead of 22 neurons. Second, the Softmax activation at the output is replaced by a sigmoid activation combined with a threshold, because each output neuron is independent. For each neuron, if the predicted value is greater than 0.5, the label is set to 1; otherwise, it is set to 0.
The loss function for multi-label classification is the binary cross-entropy with logits, implemented in Pytorch as BCEWithLogitsLoss. It combines a sigmoid layer and the binary cross-entropy loss:
$$
l_n = -[y_n \cdot \log(\sigma(x_n)) + (1-y_n) \cdot \log(1-\sigma(x_n))]
$$
$$
L = \frac{1}{6}\sum_{n=1}^{6} l_n
$$
where \(\sigma(x_n) = \frac{1}{1+e^{-x_n}}\) is the sigmoid function, \(x_n\) is the network output for the \(n\)-th IGBT, and \(y_n\) is the corresponding true label.
5.3 Experimental Setup and Results
The dataset is split into training, validation, and test sets with a ratio of 3:1:1. Five levels of Gaussian noise with SNR values of -5 dB, -3 dB, -1 dB, 0 dB, 1 dB, 3 dB, and 5 dB are applied to evaluate robustness. The training curves for each noise level show that the loss decreases rapidly and the accuracy converges to high values after a certain number of epochs. Even at -1 dB, the model reaches stable performance after about 35 epochs. At higher SNR levels, convergence is faster, and the loss becomes close to zero.
Table 8 compares the accuracy of the standard LSTM, single-label Attention-LSTM, and the proposed multi-label Attention-LSTM (ML-Attention-LSTM) method under different SNR levels.
| SNR (dB) | LSTM | Attention-LSTM | ML-Attention-LSTM |
|---|---|---|---|
| -5 | / | / | 0.9661 |
| -3 | / | / | 0.9838 |
| -1 | 0.9483 | 0.9545 | 0.9919 |
| 0 | 0.9583 | 0.9716 | 0.9954 |
| 1 | 0.9633 | 0.9867 | 0.9968 |
| 3 | 0.9767 | 0.9848 | 0.9959 |
| 5 | 0.9867 | 0.9943 | 0.9980 |
The ML-Attention-LSTM model achieves the highest accuracy at all SNR levels. At 5 dB, the localization accuracy reaches 0.9980. Even under severe noise conditions (-5 dB), the accuracy remains above 0.966, demonstrating excellent robustness and generalization ability.
The multi-label method has several advantages. It fully exploits the correlations among different fault labels, reducing the complexity of the output space while providing direct fault localization. It also shortens the diagnostic time because the model identifies the faulty IGBTs in a single forward pass, which is particularly important for online monitoring applications.
6. Conclusions and Future Work
6.1 Conclusions
This thesis investigated fault detection and localization methods for IGBTs in photovoltaic inverters, a critical component for ensuring the stable operation of solar power generation systems. Three deep learning-based approaches were developed to address two main failure modes: aging faults and open-circuit faults.
First, a TCN-based aging fault prediction method was proposed. By selecting the collector-emitter turn-off peak voltage as the aging feature and applying exponential smoothing and Min-Max normalization, the TCN model accurately predicted the degradation trend. Compared with LSTM and GRU networks, the TCN achieved lower RMSE and MAE, with a relative improvement of approximately 26% over LSTM. The TCN model benefits from parallel processing, flexible receptive fields, and better gradient propagation.
Second, an Attention-LSTM network was introduced for single-label open-circuit fault diagnosis using the DC-side current of the inverter. The attention mechanism enhanced the LSTM by concentrating on the most discriminative time steps in the fault signals. Experimental results showed that the proposed method achieved up to 0.998 diagnostic accuracy under clean conditions and maintained high accuracy under various noise levels. It outperformed kNN, SVM, CNN, and standard LSTM methods, proving its superior robustness and feature extraction capability.
Third, a multi-label Attention-LSTM model was developed for direct fault localization. By encoding fault states as six-dimensional one-hot vectors and using a sigmoid-based output layer with binary cross-entropy loss, the model simultaneously identified all faulty IGBTs. The multi-label approach provided higher localization accuracy than the single-label method, especially under noisy conditions, because it leveraged label correlations and reduced output ambiguity. This method can significantly reduce fault diagnosis time and facilitate timely maintenance of photovoltaic inverters.
6.2 Future Prospects
Although the proposed methods achieved promising results, several limitations remain. First, the aging fault data were obtained from a single IGBT type provided by the NASA dataset. More comprehensive aging data from various IGBT models and operating conditions are needed to validate the generalization capability of the model. Second, the simulation model of the PV system did not account for temperature variations and other environmental factors that could affect the current signals. Future work should incorporate more realistic operating conditions, such as partial shading, grid disturbances, and thermal effects, into the simulation. Third, the multi-label algorithm can be further improved to exploit higher-order label dependencies beyond the current independent binary classification approach. Advanced techniques such as classifier chains, label powerset, or graph neural networks could be explored to further enhance the localization accuracy.
In conclusion, the deep learning methods proposed in this thesis provide accurate, robust, and interpretable solutions for fault detection and localization in photovoltaic inverters. The integration of temporal convolutional networks, attention mechanisms, and multi-label learning proves to be a promising direction for intelligent condition monitoring and predictive maintenance of solar inverters.