
Solar energy has emerged as one of the most promising renewable energy sources due to its abundance and environmental friendliness. The rapid expansion of photovoltaic power plants has led to an increasing need for efficient and reliable operation and maintenance strategies. Among the various components, solar panels are exposed to harsh environmental conditions, climate variations, external impacts, and internal stresses, which often result in defects such as hot spots, bypass diode failures, cracks, bird droppings, and dust accumulation. These defects not only degrade the performance of solar panels but also threaten the safety and stability of the entire photovoltaic system. Traditional manual inspection methods are time-consuming, labor-intensive, and often subjective, making them inadequate for large-scale solar farms. In recent years, unmanned aerial vehicles (UAVs) equipped with infrared and visible light cameras have been widely adopted for solar panel inspection. Combined with deep learning-based computer vision techniques, these systems can automatically detect and locate various defects with high accuracy, significantly reducing maintenance costs and improving operational efficiency.
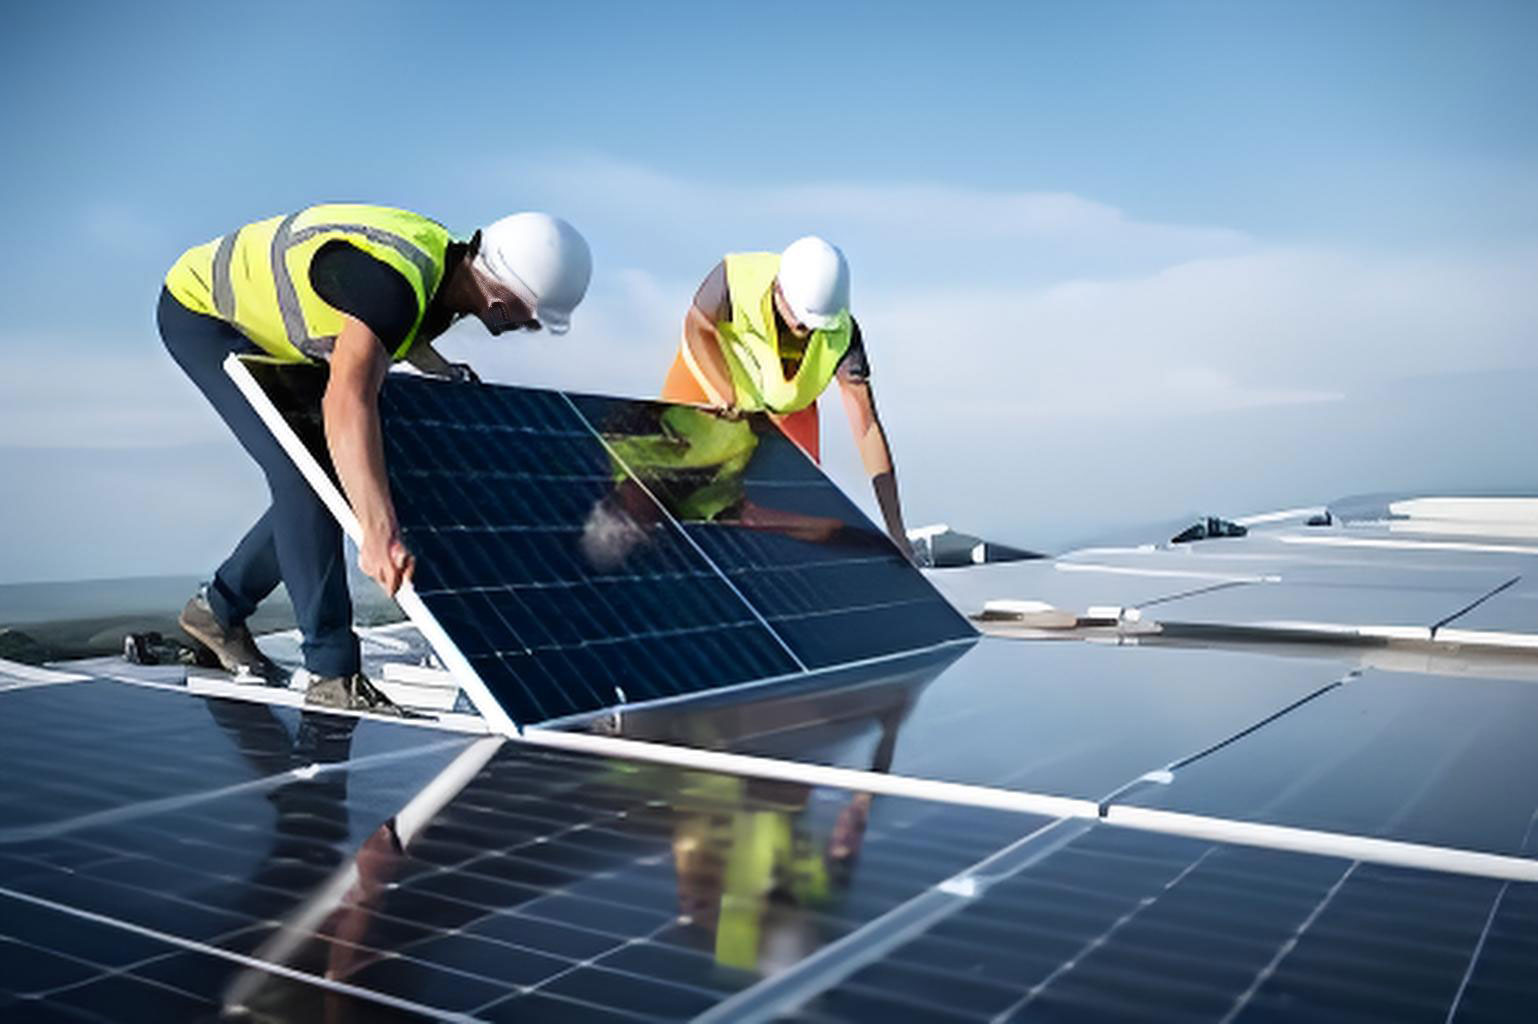
This thesis investigates the application of deep learning-based object detection and semantic segmentation algorithms to the task of solar panel defect detection under both infrared and visible light imaging. The primary contributions are fourfold. First, an improved semantic segmentation model named CM2Unet is proposed to accurately extract solar panel regions from infrared images, effectively eliminating background interference. Second, a lightweight object detection network, IN-PV-YOLO, is developed for internal defects such as hot spots and bypass diode failures, achieving a favorable balance between accuracy and model complexity. Third, a precision-oriented detection network, SF-PV-YOLO, is designed for surface defects including cracks, bird droppings, and dust, leveraging advanced feature extraction and fusion strategies. Finally, a complete defect detection system is implemented using Qt Designer and Python, integrating the proposed algorithms into a user-friendly software platform.
1. Introduction
The global energy landscape is undergoing a significant transformation driven by the depletion of conventional fossil fuels and increasing environmental concerns. Solar energy, as a clean and renewable resource, has gained considerable attention worldwide. Photovoltaic systems convert sunlight directly into electricity, and their deployment has expanded rapidly across the globe. However, the long-term outdoor operation of solar panels inevitably leads to various defects caused by environmental factors such as temperature fluctuations, humidity, wind loads, and UV radiation, as well as by mechanical impacts and internal electrical stress. These defects can lead to reduced power output, accelerated degradation, and even fire hazards. Therefore, timely and accurate defect detection is essential for maintaining the reliability and profitability of solar power plants.
Conventional inspection approaches rely on measuring electrical parameters at the inverter level, which can only localize faults to a string of solar panels rather than identifying the specific faulty module. In practice, manual visual inspection by trained personnel is still common, but it is inefficient and unsafe for large-scale solar farms, especially when panels are distributed over rugged terrain. The advent of UAV technology has revolutionized the inspection process by enabling fast and remote data acquisition. Drones equipped with high-resolution visible light cameras and thermal infrared cameras can capture detailed images of solar panels from various viewpoints. To process these images automatically, computer vision and deep learning methods have become indispensable tools. Deep neural networks can learn hierarchical feature representations from large datasets, enabling accurate recognition and localization of defects in complex backgrounds.
This research focuses on five common defect types: hot spots, bypass diode faults, cracks, bird droppings, and dust. Hot spots and bypass diode faults are internal defects that manifest as abnormal temperature patterns in infrared images, while cracks, bird droppings, and dust are surface defects visible in RGB images. The main challenges in solar panel defect detection include the high similarity between the background and the panel surface in infrared images, the large variation in defect scale and shape, the presence of complex textures, and the difficulty of deploying heavy models on embedded UAV platforms. To address these challenges, we propose tailored deep learning architectures that achieve both high detection accuracy and low computational cost.
2. Related Work
2.1 Traditional Image Processing Methods
Early approaches to solar panel defect detection relied on manually designed feature extraction rules. For instance, some researchers used standard thermal image processing combined with Canny edge detection to diagnose defects causing hot spots. Others employed two-dimensional matched filters to detect cracks in solar cells. These methods typically focus on specific defect characteristics and require substantial domain knowledge to design effective rules. Moreover, they often struggle with complex scenes and multi-defect coexistence, limiting their practical applicability.
2.2 Traditional Machine Learning Methods
With the advent of machine learning, methods based on support vector machines (SVM), neural networks, and clustering were introduced. For example, some studies used SVM classifiers with hand-crafted geometric features, while others applied deep belief networks followed by backpropagation to reconstruct defect images. These approaches improve upon purely manual rules but still depend heavily on feature engineering and often fail to capture high-level semantic information. Moreover, most traditional machine learning methods focus on classification rather than precise localization of defects.
2.3 Deep Learning Based Methods
Deep learning has revolutionized defect detection by automatically learning discriminative features from raw images. Object detection frameworks such as R-CNN, Fast R-CNN, Faster R-CNN, SSD, YOLO, and CenterNet have been widely applied to various industrial inspection tasks. In the context of solar panels, researchers have proposed various enhancements. For example, some works combined infrared and visible images using dual-stream networks, while others utilized attention mechanisms or transformer-based architectures. Despite significant progress, many existing algorithms still fail to simultaneously achieve detection accuracy and model compactness, particularly for small-scale and highly similar defects. In this work, we aim to bridge this gap by designing efficient networks specifically tailored for solar panel inspection.
3. Dataset Construction and Enhancement
3.1 Image Acquisition Technologies
Different imaging modalities reveal different types of defects. Electroluminescence (EL) imaging, photoluminescence (PL) imaging, ultraviolet (UV) imaging, and infrared thermography are commonly used for solar panel inspection. Among these, infrared thermography is particularly suited for field inspection as it can operate without powering down the system. Infrared cameras detect the thermal radiation emitted by solar panels, allowing identification of hot spots, diode failures, and other thermal anomalies. Visible light cameras are effective for detecting surface defects such as cracks, dirt, and shading. The advantages and limitations of these technologies are summarized in Table 1.
| Method | Principle | Advantages | Disadvantages |
|---|---|---|---|
| Photoluminescence | Light excitation of silicon layers | Non-contact, non-destructive | High cost, strict environment |
| Electroluminescence | Voltage bias and radiative recombination | Low cost, high resolution | Requires power disconnection |
| Ultraviolet | UV excitation and visible emission | Convenient with standard cameras | Special environment needed |
| Infrared thermography | Defect zones emit excess heat | Non-contact, no power off, high quality | Only defects producing heat are visible |
3.2 Defect Types
The defects considered in this work are described below:
- Hot spots: Caused by partial shading, dirt, or internal failures leading to reverse bias and localized heating. In infrared images, hot spots appear as bright circular or rounded rectangular regions.
- Bypass diode faults: Occur due to short circuits in the panel, causing a large area of the panel to heat up. They appear as bright rectangular bands spanning one-third to two-thirds of the panel width.
- Cracks: Caused by mechanical impact or thermal stress. In visible images, cracks appear as dense, chaotic white lines. Their scale varies greatly.
- Bird droppings: Small white or dark spots left by birds. They can block sunlight and lead to hot spots if not cleaned.
- Dust: A layer of dust on the surface reduces transmittance. It appears as a dull, uneven area with reduced contrast and texture.
3.3 Dataset Annotation and Splitting
We constructed two datasets: an infrared dataset for internal defects and a visible light dataset for surface defects. The infrared dataset contains 2585 images annotated with two classes: hot spot and bypass diode fault. The visible light dataset contains 3246 images annotated with three classes: crack, bird dropping, and dust. Annotation was performed using the Labelimg tool. All images were resized to 640×640 pixels for training. The datasets were split into training, validation, and test sets with ratios of 7:2:1.
3.4 Data Augmentation
To improve model generalization and prevent overfitting, various data augmentation techniques were applied, including random brightness adjustment, random rotation, and horizontal/vertical flipping. These operations simulate different lighting conditions, viewpoints, and orientations. Table 2 shows the number of images per class after augmentation.
| Dataset | Class | Original Images | After Augmentation |
|---|---|---|---|
| Infrared | Hot spot | 1497 | 2158 |
| Bypass diode fault | 1169 | 1865 | |
| Visible | Crack | 1397 | 2037 |
| Bird dropping | 1128 | 1836 | |
| Dust | 867 | 1596 |
4. Semantic Segmentation of Solar Panel Regions
4.1 Limitations of Traditional Segmentation
In infrared images, the ground background often shares similar thermal characteristics with solar panels, making it difficult to distinguish them using simple thresholding or region growing techniques. Threshold segmentation assigns pixels as foreground or background based on a fixed threshold, which fails when illumination varies. Region growing methods require manual seed selection and cannot extract separated solar panels. These limitations motivate the use of deep learning-based semantic segmentation.
4.2 Semantic Segmentation Networks
We compared several popular segmentation models, including Unet, DeepLabv3+, SegNet, ENet, SQNet, and FPENet. Unet, with its symmetric encoder-decoder structure and skip connections, is well suited for pixel-accurate segmentation but suffers from a large number of parameters and may produce blurred boundaries in complex scenes. DeepLabv3+ utilizes atrous convolution and ASPP for multi-scale context but is computationally heavy. SegNet uses max-pooling indices to reduce memory usage but yields coarse boundaries. Lightweight models like ENet and SQNet sacrifice precision for speed. Based on this analysis, we chose Unet as the baseline and introduced two improvements: replacing the encoder with MobileNetv2 and adding an edge detection module.
4.3 MobileNetV2 Backbone
MobileNetV2 is a lightweight convolutional neural network built upon inverted residual blocks and linear bottlenecks. It uses depthwise separable convolutions to reduce computation. The basic block structure is shown below. For stride=1, the block uses a 1×1 expansion convolution, a 3×3 depthwise convolution, and a 1×1 projection convolution, with a residual connection. For stride=2, the residual connection is removed. By embedding MobileNetV2 as the encoder of Unet, we significantly reduce the model size while preserving the ability to extract fine details.
4.4 Edge Detection Module
To sharpen the segmentation boundaries, we incorporated an edge detection branch that uses the Canny algorithm to extract contour information from the input image. The Canny operator performs Gaussian smoothing, gradient computation, non-maximum suppression, and double thresholding. The gradient magnitude \(M(i,j)\) is computed as:
$$M(i,j)=\sqrt{P_x^2(i,j)+P_y^2(i,j)}$$
where \(P_x\) and \(P_y\) are the partial derivatives along the horizontal and vertical directions, respectively. The edge features are then fused with the encoder features through a fusion module, which aligns the spatial dimensions and concatenates the feature maps. This helps the decoder focus on boundary regions, leading to more accurate segmentation.
4.5 CM2Unet Architecture
The proposed CM2Unet model is illustrated conceptually. The encoder uses MobileNetV2 to produce multi-scale feature maps from four bottleneck layers. The decoder up-samples these features step by step, and the edge features are injected at the appropriate resolution. The fusion module applies 1×1 convolution to match channels, and the edge map is processed through 2×2 convolution and pooling for spatial alignment. The final segmentation output is a pixel-wise classification of solar panel vs. background.
4.6 Experiments
We trained the models on a dataset consisting of 1200 manually annotated infrared images of solar panels. The learning rate was set to 0.01, batch size to 16, and the number of epochs to 300. We used the mean Intersection over Union (MIoU) and the number of parameters as evaluation metrics. The MIoU is defined as:
$$ \text{MIoU}=\frac{1}{n+1}\sum_{i=0}^{n}\frac{p_{ii}}{\sum_{j=0}^{n}p_{ij}+\sum_{j=0}^{n}p_{ji}-p_{ii}} $$
where \(p_{ij}\) denotes the number of pixels of class \(i\) predicted as class \(j\). Table 3 presents the comparison results.
| Model | MIoU (%) | Params (M) |
|---|---|---|
| DeepLabv3+ | 93.22 | 43.51 |
| SegNet | 93.65 | 29.45 |
| ENet | 81.63 | 0.36 |
| SQNet | 83.97 | 1.27 |
| FPENet | 83.62 | 0.52 |
| Unet | 94.65 | 31.38 |
| CM2Unet | 97.38 | 6.83 |
The proposed CM2Unet achieves the highest MIoU of 97.38%, outperforming the baseline Unet by 2.73 percentage points, while reducing the number of parameters to less than one-fourth. It also surpasses all other compared models in accuracy. Qualitative results show that CM2Unet effectively removes background interference and produces clearer boundaries even in challenging scenes with bright ground or discontinuous solar panels.
5. Internal Defect Detection with IN-PV-YOLO
5.1 Baseline YOLOv8n
YOLOv8 is a state-of-the-art single-stage object detector that combines the strengths of prior YOLO versions. The network consists of a backbone, a neck, and a detection head. The backbone employs cross-stage partial connections and the C2f module, which enhances feature reuse. The neck uses a path aggregation network to fuse multi-scale features. The head predicts class probabilities and bounding box coordinates. We chose the nano version (YOLOv8n) for its low computational cost, making it suitable for UAV deployment. However, the original model exhibits a suboptimal trade-off between accuracy and efficiency for solar panel defect detection.
5.2 Lightweight Backbone with VanillaNet
To reduce the model size and computational load, we replaced the default backbone with VanillaNet. VanillaNet is an extremely simple network composed of stacked 1×1 convolutions, batch normalization, and pooling layers. Its structure includes a stem, a series of stages with increasing channel dimensions, and a global average pooling layer. By integrating VanillaNet into YOLOv8, we significantly decrease the floating-point operations (GFLOPs) and parameters while maintaining competitive feature extraction ability.
5.3 DBoTNet Feature Extraction Layer
In order to enhance the model’s capability to capture complex features from infrared images without increasing computational burden, we introduce a dual-branch transformer-based bottleneck layer, termed DBoTNet. The original BoTNet replaces the 3×3 convolution in a ResNet bottleneck with a multi-head self-attention mechanism. In our improved version, we apply the bottleneck transformer to both branches of the residual structure and then concatenate their outputs, as depicted in the architecture. This design improves feature consistency and model stability. The multi-head self-attention operation is formulated as:
$$ \text{MultiHead}(Q,K,V) = \text{Concat}(\text{head}_1,\dots,\text{head}_n)W^O $$
where each head computes:
$$ \text{Attention}(Q,K,V) = \text{softmax}\left(\frac{QK^T}{\sqrt{d_k}}\right)V $$
5.4 Receptive Field and Attention Convolution
We propose a hybrid attention module named RFCBAM, which integrates receptive field attention and channel attention. The standard CBAM sequentially applies channel and spatial attention, but it treats all spatial positions equally. Our RFCBAM uses a group convolution to extract receptive field spatial features and then applies a squeeze-and-excitation module to re-weight channels. The resulting RFCBAMConv is used to replace the original convolutions in the C2f modules, allowing the network to focus on important features while mitigating the parameter-sharing drawback of standard convolution.
5.5 V7DownSampling Module
To improve multi-scale detection, we integrate the V7DownSampling module at specific stages. This module first performs max-pooling to reduce spatial dimensions, then applies two parallel convolutions with different kernel strategies, and finally concatenates the outputs. By replacing ordinary convolutional down-sampling layers with this module, the network better captures features at different scales and speeds up convergence.
5.6 Loss Function Improvement
The default YOLOv8 uses CIoU as the bounding box regression loss. CIoU considers the overlap area, central points distance, and aspect ratio. However, the aspect ratio term is a relative value and can be ambiguous. To address this, we adopt Focaler-WIoU, which combines the Focaler-IoU with the Wise-IoU (WIoU) loss. The Focaler-IoU is defined as:
$$ L_{\text{Focaler-IoU}} = 1 – \text{IoU}^{\text{Focaler}} $$
where
$$ \text{IoU}^{\text{Focaler}} = \begin{cases}
0, & \text{IoU} < d \\
\frac{\text{IoU}-d}{u-d}, & d \le \text{IoU} \le u \\
1, & \text{IoU} > u
\end{cases} $$
Here, \(d\) and \(u\) are interval boundaries that allow the loss to focus on specific regression samples. The final loss is given by:
$$ L_{\text{Focaler-WIoU}} = L_{\text{WIoUv3}} + \text{IoU} – \text{IoU}^{\text{Focaler}} $$
where \(L_{\text{WIoUv3}}\) incorporates a dynamic gradient gain based on the degree of anomaly. This loss function improves regression accuracy without changing the network structure.
5.7 IN-PV-YOLO Architecture
The complete IN-PV-YOLO network integrates all the above improvements. The backbone consists of VanillaNet stages followed by SPPF and DBoTNet. The neck contains the RFCBAM-attention-based C2f modules and V7DownSampling layers. The detection head is identical to that of YOLOv8. Table 4 lists the ablation study results.
| Method | GFLOPs | P (%) | R (%) | mAP50 (%) | Params (M) |
|---|---|---|---|---|---|
| YOLOv8n | 8.1 | 68.2 | 70.7 | 70.9 | 3.01 |
| +VanillaNet | 5.0 | 68.1 | 71.2 | 71.3 | 1.73 |
| +RFCBAM | 8.8 | 68.4 | 72.9 | 72.9 | 3.15 |
| +V7DownSampling | 7.8 | 69.9 | 72.5 | 73.7 | 2.74 |
| +DBoTNet | 8.2 | 69.8 | 71.7 | 72.5 | 3.08 |
| +Focaler-WIoU | 8.1 | 68.7 | 71.1 | 72.5 | 3.01 |
| IN-PV-YOLO (all) | 6.0 | 72.7 | 72.5 | 75.5 | 1.92 |
Each improvement contributes positively to the overall performance. The final IN-PV-YOLO model achieves an mAP of 75.5%, which is 4.6 percentage points higher than the baseline, while reducing the GFLOPs from 8.1 to 6.0 and the parameter count from 3.01M to 1.92M. This demonstrates an excellent trade-off between accuracy and efficiency.
5.8 Comparison with Other Detectors
We compared the proposed method with several mainstream detectors, including SSD, Faster R-CNN, YOLOv5n, YOLOv6n, YOLOv3-tiny, and YOLOv3. The results are shown in Table 5.
| Model | GFLOPs | Params (M) | mAP50 (%) |
|---|---|---|---|
| SSD | 62.8 | 26.29 | 59.2 |
| Faster R-CNN | 370.42 | 137.10 | 65.5 |
| YOLOv5n | 7.1 | 2.50 | 69.2 |
| YOLOv6n | 11.8 | 4.23 | 63.1 |
| YOLOv3-tiny | 18.9 | 12.13 | 57.4 |
| YOLOv3 | 282.2 | 103.67 | 82.7 |
| IN-PV-YOLO | 6.0 | 1.92 | 75.5 |
Although YOLOv3 achieves higher accuracy, its computational cost is prohibitive for embedded devices. IN-PV-YOLO offers a superior speed-accuracy trade-off, making it ideal for real-time UAV inspection. Additionally, we verified that the proposed improvements are also effective when applied to other YOLOv8 scales (s and m), demonstrating their generality.
6. Surface Defect Detection with SF-PV-YOLO
6.1 Motivations
Surface defects in solar panels, such as cracks, bird droppings, and dust, exhibit large variations in scale, shape, and texture. Unlike infrared images that provide thermal information, visible light images contain rich color and edge details but also complex backgrounds. In this context, we design a precision-oriented detection network, SF-PV-YOLO, based on YOLOv8n, to maximize accuracy while keeping computational costs acceptable.
6.2 HGNetv2 Backbone
We adopt HGNetv2 as the feature extraction backbone. HGNetv2 employs a hierarchical block architecture with learnable down-sampling layers. Each HGBlock consists of multiple convolutions with different kernel sizes followed by a concatenation and attention-like fusion. This design allows the network to capture both local and global contexts efficiently. The backbone produces multi-scale feature maps that are fed into the detection head.
6.3 Attentional Feature Pyramid Network (AFPN)
To improve the detection of small and multi-scale defects, we replace the standard FPN in the YOLOv8 neck with a progressive feature pyramid network. The AFPN introduces adaptive feature fusion modules (ASFF) that learn to fuse features from different levels with spatial weights. For a given level, the features from other levels are first resized to match the spatial resolution, then passed through convolutions, and finally combined using learned normalized weights. This mechanism allows the network to selectively aggregate information from multiple scales, enhancing detection performance.
6.4 Parameter-Free Attention (SPA)
We incorporate a parameter-free attention mechanism called SPA into the C2f modules of the neck. SPA uses symmetric activation functions and residual connections to emphasize important features without introducing additional learnable parameters. The formulation is as follows. Given an input feature \(O_{i-1}\), the attention map \(V_i\) is generated via a symmetric activation function \(\sigma\), and the output \(O_i\) is calculated as:
$$ O_i = U_i \odot V_i + \alpha U_i $$
where \(U_i\) is the transformed feature and \(\alpha\) is a residual scaling factor. This mechanism efficiently boosts informative regions while suppressing redundancy.
6.5 Depthwise Separable Convolution
To offset the increase in parameters caused by the heavier backbone and pyramid network, we replace all standard 3×3 convolutions in the neck with depthwise separable convolutions. A depthwise separable convolution decomposes a standard convolution into a depthwise convolution (applied independently to each channel) followed by a pointwise 1×1 convolution. The parameter count reduction ratio is:
$$ \frac{\text{DW+PW params}}{\text{Standard params}} = \frac{1}{C_{\text{out}}} + \frac{1}{K^2} $$
where \(K\) is the kernel size (e.g., 3). This significantly reduces memory usage while preserving representational capacity.
6.6 Ablation Experiments
Table 6 shows the ablation study results for SF-PV-YOLO.
| Method | GFLOPs | P (%) | R (%) | mAP50 (%) | Params (M) |
|---|---|---|---|---|---|
| YOLOv8n | 8.1 | 68.6 | 63.5 | 66.4 | 3.01 |
| +HGNetv2 | 7.7 | 73.6 | 66.7 | 69.5 | 2.50 |
| +AFPN | 11.1 | 72.4 | 61.8 | 67.4 | 2.74 |
| +DWConv | 6.9 | 69.1 | 64.5 | 66.9 | 2.44 |
| +SPA | 8.2 | 70.8 | 63.6 | 67.6 | 3.02 |
| SF-PV-YOLO (all) | 9.3 | 75.9 | 68.2 | 72.1 | 2.53 |
The final model achieves an mAP of 72.1%, which is 5.7 percentage points higher than the baseline YOLOv8n, with only a slight increase in GFLOPs (from 8.1 to 9.3) and a decrease in parameters (from 3.01M to 2.53M). This indicates the effectiveness of the proposed enhancements for solar panel surface defect detection.
6.7 Attention Mechanism Comparison
We also compared different attention mechanisms integrated into YOLOv8n, including SE, CBAM, self-attention, and SPA. The results are presented in Table 7.
| Method | P (%) | R (%) | mAP50 (%) | Params (M) | GFLOPs |
|---|---|---|---|---|---|
| YOLOv8n | 68.6 | 63.5 | 66.4 | 3.01 | 8.1 |
| +SE | 67.9 | 67.7 | 67.2 | 3.05 | 8.3 |
| +CBAM | 70.5 | 62.2 | 67.3 | 3.11 | 8.3 |
| +SA | 70.2 | 63.1 | 66.9 | 3.52 | 8.6 |
| +SPA | 70.8 | 63.6 | 67.6 | 3.02 | 8.2 |
SPA achieves the highest mAP with minimal additional parameters, confirming its suitability for lightweight detection models.
7. System Design and Implementation
7.1 Development Environment
We implemented a complete solar panel defect detection system using PyCharm, Qt Designer, and Python 3.9. The system runs on a Windows 10 machine with an NVIDIA RTX 3080 Ti GPU. The software architecture includes a login/registration module, a function selection module, image input modules, a solar panel segmentation module, an internal defect detection module, and a surface defect detection module.
7.2 Software Modules
The login interface allows users to create an account and sign in securely. After login, users choose between internal defect detection (infrared images) and surface defect detection (visible images). The image input module supports both online capture from a UAV via communication protocols and offline loading from local files. For internal defect detection, the system first performs semantic segmentation using the CM2Unet model to extract solar panel regions, then feeds the segmented results into the IN-PV-YOLO detector. For surface defect detection, images are directly processed by the SF-PV-YOLO model. The detection results display bounding boxes with class labels, confidence scores, and positions.
7.3 Functional Testing
The system was tested with sample images. For surface defects, the detection results shown in the interface correctly identified bird droppings, cracks, and dust regions with high confidence. For internal defects, the system successfully segmented solar panel areas from infrared images and detected hot spots and bypass diode faults. The graphical user interface is intuitive and allows users to switch between different models, such as YOLOv8, YOLOv3, and the proposed improved versions. A screenshot of the system interface is presented in the software implementation.
8. Conclusion and Future Work
In this thesis, we addressed the problem of solar panel defect detection using deep learning techniques. We proposed three main contributions: (1) an enhanced CM2Unet semantic segmentation model for accurate extraction of solar panel regions from infrared images; (2) a lightweight IN-PV-YOLO detector for internal defects that balances accuracy and computational efficiency; and (3) a precision-oriented SF-PV-YOLO detector for surface defects. Extensive experiments demonstrated that each proposed modification improves performance over the baseline models. The final systems were integrated into a practical software platform, providing an end-to-end solution for UAV-based solar panel inspection.
Future work will focus on expanding the dataset with more defect types and scenarios, improving the detection robustness under extreme weather conditions, and deploying the models on edge devices such as the Jetson Nano to achieve real-time inference onboard UAVs. Additionally, we aim to incorporate multi-modal fusion strategies that jointly use infrared and visible images for more comprehensive defect diagnosis. The ultimate goal is to build a fully automated, intelligent maintenance system for solar power plants that greatly reduces human intervention and operational costs.