
In recent years, the rapid adoption of new energy vehicles has brought the performance and durability of lithium-ion batteries into sharp focus. As a researcher in this field, I have been particularly interested in how external factors, such as mechanical pressure, influence the long-term cycling behavior of lithium-ion batteries. The cruising range of electric vehicles is directly tied to the capacity retention of these batteries over time, making it crucial to understand the effects of stress and strain during operation. This article delves into an experimental investigation where we compared the cycling performance of lithium-ion batteries under natural conditions versus those subjected to controlled external pressure. Our goal is to provide insights that can inform the design and optimization of battery systems for enhanced longevity and reliability.
The importance of lithium-ion batteries in modern transportation cannot be overstated. They serve as the primary energy storage component in electric vehicles, and their electrochemical performance dictates key metrics like range and lifespan. During cycling, lithium-ion batteries undergo repeated insertion and extraction of lithium ions, which can lead to volume changes and internal stress buildup. This phenomenon, often referred to as the “breathing effect,” is influenced by various side reactions that accumulate over time, causing irreversible expansion and capacity fade. We hypothesize that applying an appropriate external pressure might mitigate these effects by maintaining electrode contact and suppressing structural deformations. However, excessive pressure could be detrimental, leading to issues like separator damage or hindered ion transport. Thus, our study aims to quantify the impact of external pressure on capacity retention through systematic testing.
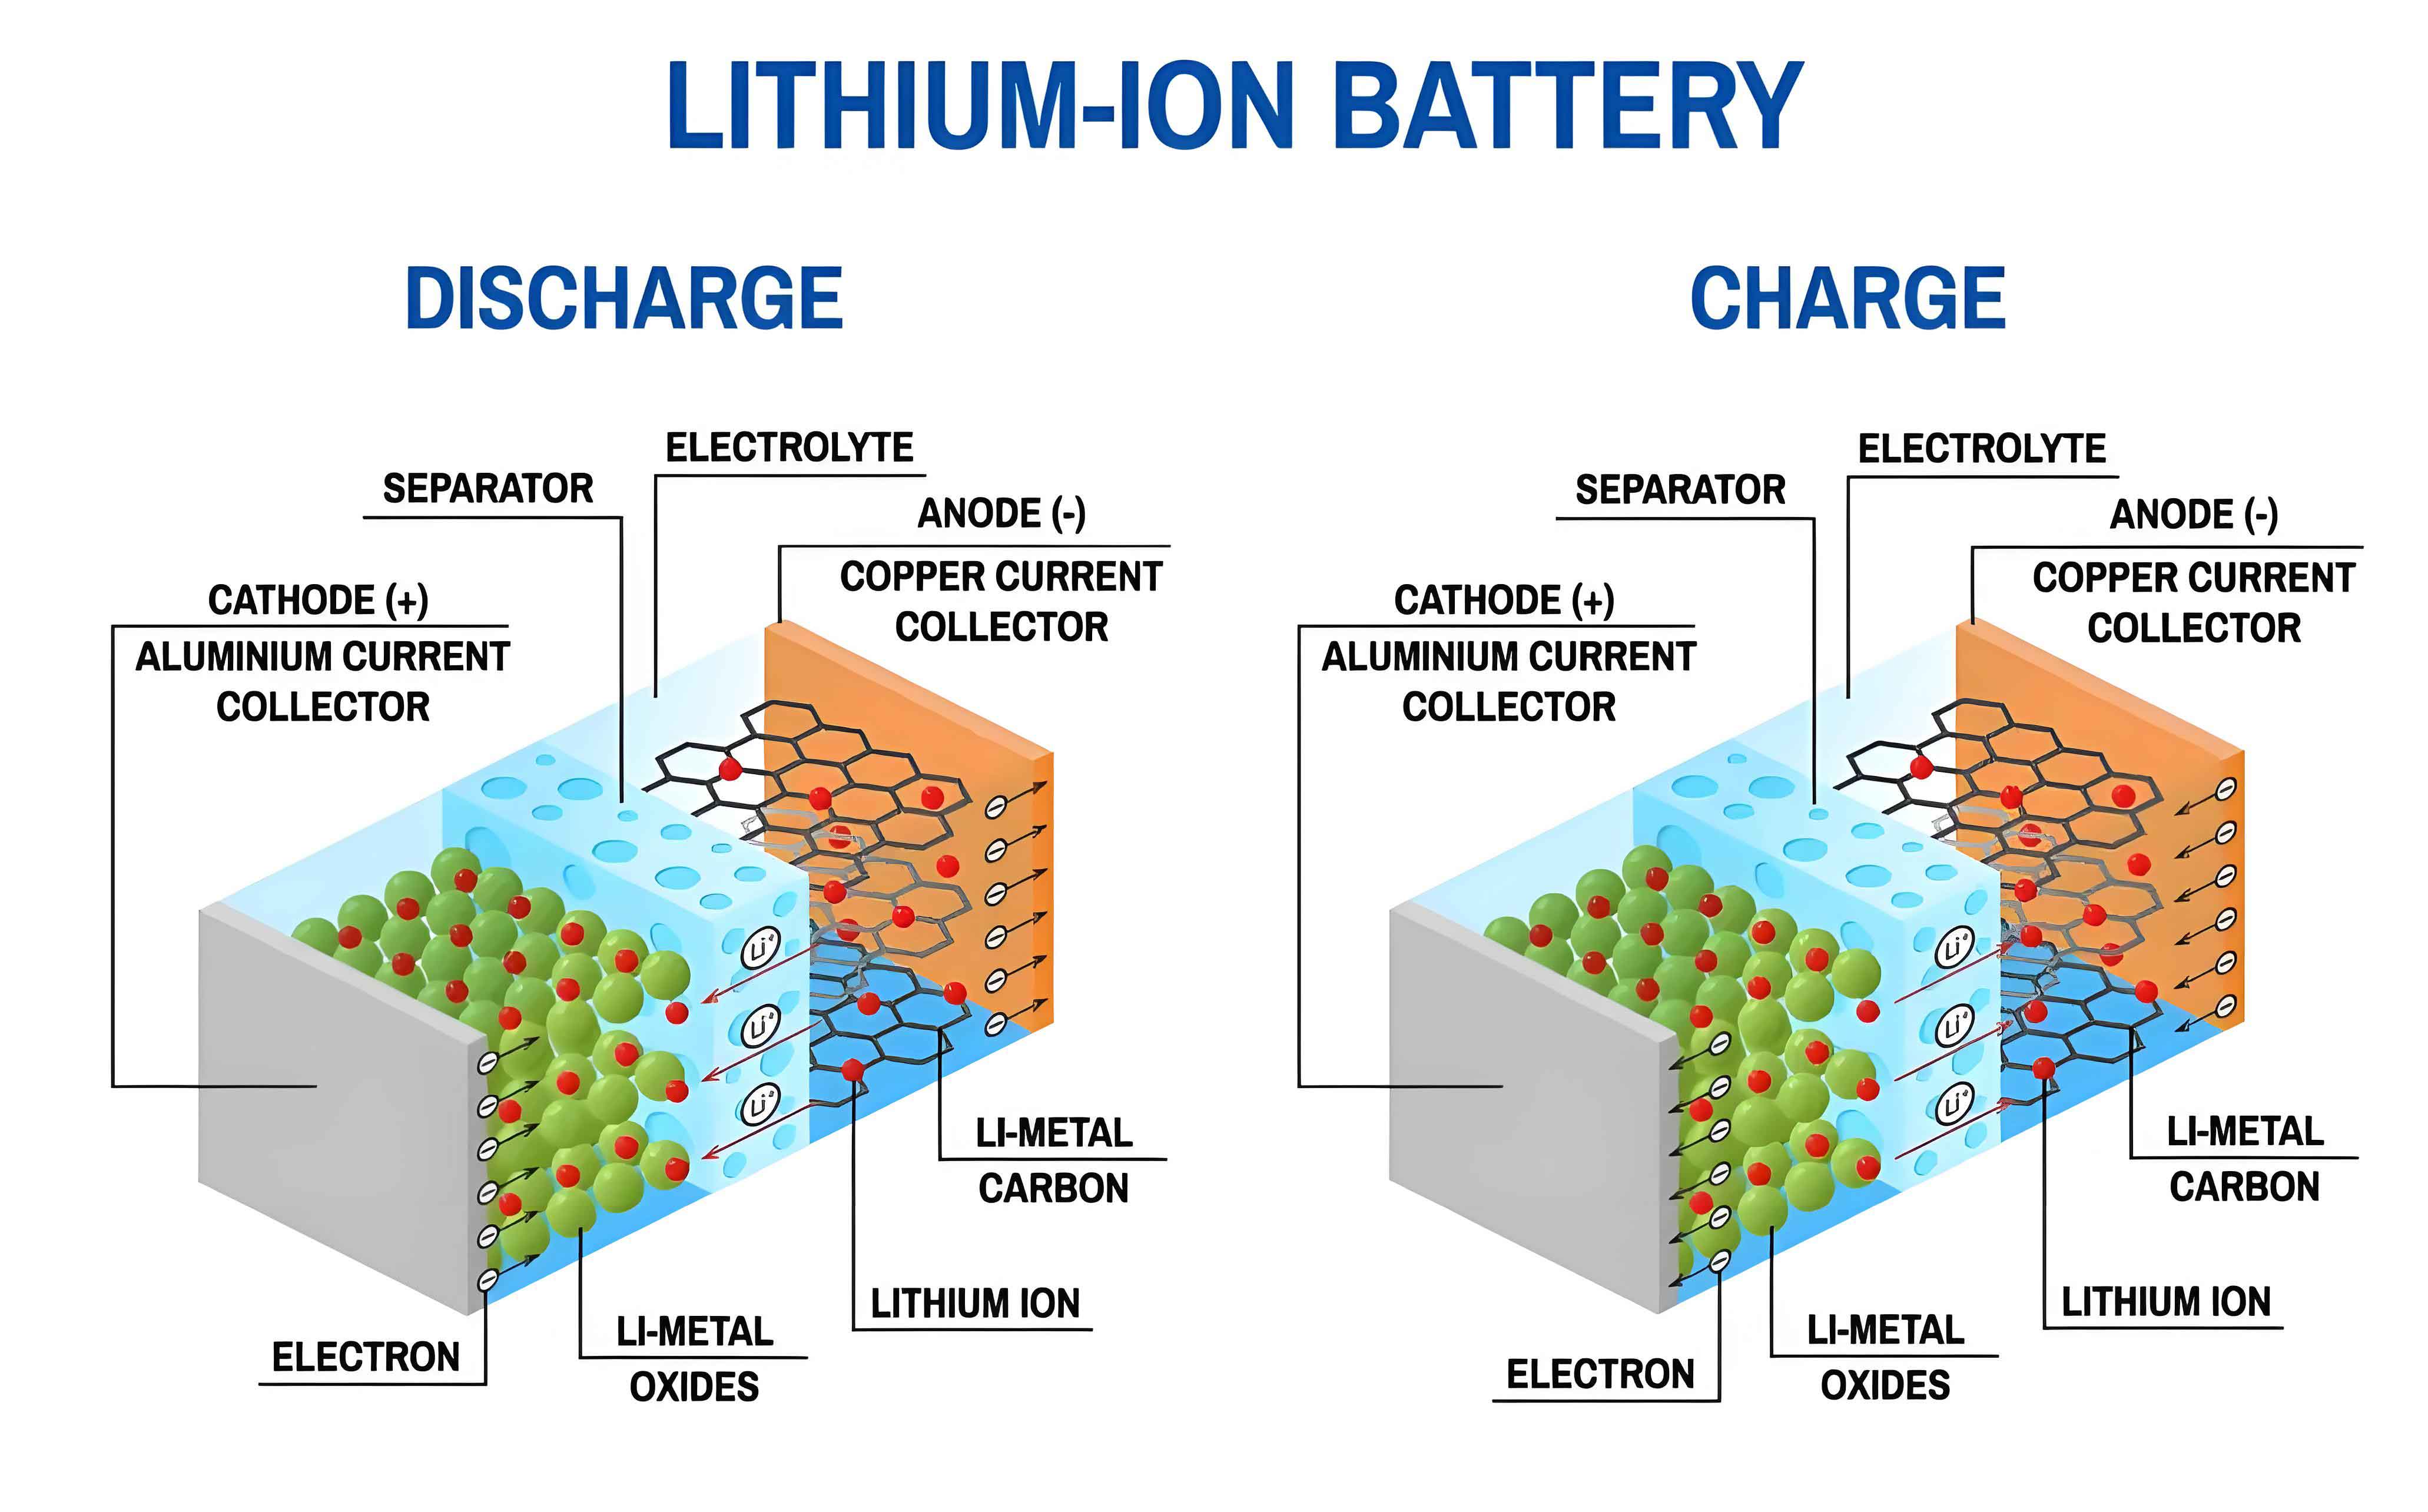
To understand the underlying mechanisms, we must first consider the electrochemical processes in a lithium-ion battery. The primary reaction involves the movement of lithium ions between the cathode and anode. For a lithium iron phosphate (LiFePO4) battery, which we used in our tests, the charge-discharge reaction can be represented as:
$$ \text{Cathode: } \text{LiFePO}_4 \rightleftharpoons \text{Li}_{1-x}\text{FePO}_4 + x\text{Li}^+ + x e^- $$
$$ \text{Anode: } \text{C} + x\text{Li}^+ + x e^- \rightleftharpoons \text{Li}_x\text{C} $$
While this idealized process is reversible, side reactions such as solid electrolyte interphase (SEI) growth, electrolyte decomposition, and active material loss occur concurrently. These side reactions consume lithium ions and generate heat, leading to volume expansion and stress accumulation. The internal stress, \(\sigma_{\text{int}}\), can be modeled as a function of state of charge (SOC) and cycle number, \(n\):
$$ \sigma_{\text{int}}(n, \text{SOC}) = \sigma_0 + \alpha \cdot n + \beta \cdot f(\text{SOC}) $$
where \(\sigma_0\) is the initial stress, \(\alpha\) represents the irreversible stress increase per cycle due to aging, and \(\beta\) accounts for reversible stress changes during SOC variations. External pressure, \(P_{\text{ext}}\), applied to the battery can counteract this internal stress, potentially reducing the net strain, \(\epsilon\):
$$ \epsilon = \frac{\sigma_{\text{int}} – P_{\text{ext}}}{E} $$
where \(E\) is the effective modulus of the battery components. Optimal external pressure should minimize \(\epsilon\) to prevent capacity fade, but if \(P_{\text{ext}}\) is too high, it may cause mechanical failure. Studies have shown that pressure affects interfacial resistance and lithium plating tendencies, which in turn influence capacity retention. To quantify these effects, we designed a comparative experiment with two groups of lithium-ion batteries.
Our experimental setup involved four prismatic lithium-ion batteries with lithium iron phosphate chemistry. We divided them into two groups: Group 1 consisted of two batteries with a rated capacity of 150 Ah each, and Group 2 had two batteries with a rated capacity of 100 Ah each. All batteries were within a healthy state of charge range prior to testing. The tests were conducted in a controlled environment at a constant temperature of 25°C using a standard cycling protocol. Each cycle comprised the following steps:
- Charge at 1C constant current to an upper voltage limit of 3.65 V, followed by constant voltage charging until the current dropped to 0.05C.
- Rest for 30 minutes.
- Discharge at 1C constant current to a lower voltage limit of 2.5 V.
- Rest for 30 minutes.
This sequence was repeated for 200 cycles to assess long-term performance. For each group, one battery was tested under natural conditions (no external constraint), while the other was placed in a rigid fixture that applied uniform external pressure via torque-controlled bolts, simulating the constrained environment within a battery pack. We used the same charging-discharging equipment and thermal chamber for all tests to ensure consistency. Key parameters are summarized in Table 1.
| Group | Battery ID | Rated Capacity (Ah) | Initial Capacity (Ah) | Initial Energy (Wh) | Test Condition |
|---|---|---|---|---|---|
| 1 | B1 | 150 | 151.21 | 474.81 | Natural |
| B2 | 150 | 151.07 | 472.52 | Pressurized | |
| 2 | B3 | 100 | 98.32 | 308.75 | Natural |
| B4 | 100 | 97.61 | 305.82 | Pressurized |
The capacity retention rate, \(R\), after \(n\) cycles is defined as:
$$ R(n) = \frac{C_{\text{discharge}}(n)}{C_{\text{discharge}}(1)} \times 100\% $$
where \(C_{\text{discharge}}(n)\) is the discharge capacity at cycle \(n\). We monitored this metric throughout the test to compare performance. The results after 200 cycles are presented in Table 2, along with derived parameters to highlight trends.
| Group | Battery ID | Final Capacity (Ah) | Final Energy (Wh) | Capacity Retention Rate (%) | Average Capacity Fade per Cycle (%) |
|---|---|---|---|---|---|
| 1 | B1 (Natural) | 142.75 | 448.87 | 94.41 | 0.02795 |
| B2 (Pressurized) | 145.60 | 456.87 | 96.38 | 0.01810 | |
| 2 | B3 (Natural) | 90.12 | 283.35 | 91.65 | 0.04175 |
| B4 (Pressurized) | 92.43 | 290.15 | 94.69 | 0.02655 |
From Table 2, it is evident that the pressurized batteries exhibited higher capacity retention rates in both groups. In Group 1, the natural battery showed a retention rate of 94.41%, while the pressurized one achieved 96.38%, a difference of 1.97%. In Group 2, the gap was larger: the natural battery had 91.65% retention versus 94.69% for the pressurized one, a difference of 3.04%. This suggests that external pressure effectively slows capacity fade, particularly for batteries with lower initial health. The average capacity fade per cycle, calculated as \(\frac{100\% – R(n)}{n}\), further underscores this benefit: pressurized batteries had lower fade rates, indicating more stable cycling.
To model the capacity degradation, we can use an empirical equation that incorporates cycle number and pressure effects. The capacity, \(C(n)\), as a function of cycles can be expressed as:
$$ C(n) = C_0 \cdot e^{-k \cdot n} $$
where \(C_0\) is the initial capacity and \(k\) is the degradation rate constant. For batteries under external pressure, \(k\) is expected to be smaller. From our data, we can derive \(k\) values for each condition. For instance, for Group 1 natural battery: \(k_1 = -\frac{\ln(0.9441)}{200} \approx 0.000286\), and for the pressurized battery: \(k_2 = -\frac{\ln(0.9638)}{200} \approx 0.000184\). This confirms that pressure reduces \(k\) by approximately 35.7% in this case. A more comprehensive model might include pressure explicitly:
$$ k(P) = k_0 – \gamma \cdot P + \delta \cdot P^2 $$
where \(k_0\) is the degradation rate at zero pressure, \(\gamma\) is a positive coefficient for beneficial pressure effects, and \(\delta\) accounts for detrimental effects at high pressure. Our tests used a fixed pressure level, but future work could vary \(P\) to optimize this relationship.
The cycling data also reveal trends in capacity evolution over time. Figure 1 (not shown, as per instructions) would typically plot capacity versus cycle number, but we can describe the curves mathematically. For Group 1 batteries, the capacity decline followed an exponential decay with a relatively constant slope after an initial rapid drop. This initial drop likely represents activation losses, followed by a stable aging phase. The capacity curves can be fitted to:
$$ C(n) = C_{\infty} + (C_0 – C_{\infty}) \cdot e^{-\lambda n} $$
where \(C_{\infty}\) is the asymptotic capacity and \(\lambda\) is the decay constant. For Group 2 batteries, which had lower initial capacities, the decay accelerated after about 100 cycles, indicating accelerated aging. This may be due to pre-existing degradation from prior usage, highlighting how battery history affects pressure sensitivity.
We also analyzed the energy efficiency, \(\eta\), during cycling, defined as the ratio of discharge energy to charge energy per cycle. For a lithium-ion battery, \(\eta\) typically decreases over time due to increased internal resistance. We observed that pressurized batteries maintained higher efficiency, as shown in Table 3, which summarizes average efficiency over 200 cycles.
| Battery ID | Average Energy Efficiency (%) | Initial Internal Resistance (mΩ) | Final Internal Resistance (mΩ) | Resistance Increase (%) |
|---|---|---|---|---|
| B1 (Natural) | 95.2 | 0.85 | 1.12 | 31.8 |
| B2 (Pressurized) | 96.5 | 0.83 | 1.01 | 21.7 |
| B3 (Natural) | 94.8 | 0.92 | 1.25 | 35.9 |
| B4 (Pressurized) | 95.9 | 0.90 | 1.15 | 27.8 |
The lower resistance increase in pressurized batteries suggests that external pressure helps maintain electrode integrity and reduces side reactions that contribute to resistance growth. This is critical for real-world applications, as higher resistance leads to voltage drop and reduced power output. The relationship between pressure and resistance can be approximated by:
$$ R_{\text{int}}(n) = R_0 + \zeta \cdot n – \theta \cdot P $$
where \(R_0\) is the initial resistance, \(\zeta\) is the aging coefficient, and \(\theta\) represents the pressure-induced reduction in resistance growth.
Beyond capacity and resistance, we considered the volumetric changes in lithium-ion batteries. The expansion strain, \(\epsilon_v\), due to cycling can be estimated from the capacity fade, assuming a linear correlation with active material loss. For a lithium-ion battery, the volume change per cycle, \(\Delta V\), is proportional to the lithium ion flux and side reaction products. A simplified model is:
$$ \Delta V(n) = \phi \cdot (C_0 – C(n)) $$
where \(\phi\) is a material-specific constant. External pressure compresses the battery, reducing the net volume change. The effective strain under pressure is:
$$ \epsilon_{\text{eff}} = \epsilon_v – \frac{P}{K} $$
with \(K\) being the bulk modulus of the battery. Minimizing \(\epsilon_{\text{eff}}\) helps prevent mechanical degradation.
Our findings align with prior research indicating that moderate external pressure benefits lithium-ion battery cycle life. However, it is essential to note the limits: excessive pressure can cause separator creep, electrode fracture, or lithium plating, leading to rapid failure. The optimal pressure range likely depends on battery design, materials, and operating conditions. For the lithium-ion batteries in our study, the applied pressure (simulating pack conditions) was beneficial, but longer-term cycling beyond 200 cycles might reveal a threshold where benefits diminish. We propose a safety factor, \(S\), for pressure design:
$$ S = \frac{P_{\text{max}}}{P_{\text{opt}}} $$
where \(P_{\text{max}}\) is the pressure causing failure and \(P_{\text{opt}}\) is the optimal pressure from performance tests. Further studies should determine \(P_{\text{max}}\) for different lithium-ion battery types.
In conclusion, our experimental analysis demonstrates that external pressure can significantly improve the cycling performance of lithium-ion batteries, enhancing capacity retention and reducing resistance growth. The pressurized batteries in both groups outperformed their natural counterparts, with capacity retention differences of 1.97% to 3.04% after 200 cycles. These results underscore the importance of mechanical constraints in battery pack design to mitigate aging effects. We recommend that future designs incorporate pressure management systems to maintain optimal levels throughout the battery’s life. Additionally, models integrating pressure effects into degradation algorithms can improve state-of-health estimations for battery management systems. As lithium-ion batteries continue to evolve, understanding their mechanical-electrochemical interplay will be key to advancing electric vehicle technology and ensuring sustainable mobility.
To generalize our findings, we can derive a set of best practices for lithium-ion battery deployment under pressure. First, initial battery health should be assessed, as pre-aged batteries may respond differently to pressure. Second, pressure should be uniformly applied to avoid localized stresses. Third, monitoring tools should track expansion and resistance to adjust pressure dynamically. These steps can help maximize the lifespan of lithium-ion batteries in demanding applications. Our work contributes to the growing body of knowledge on lithium-ion battery durability, and we hope it inspires further research into multi-physics optimization for energy storage systems.