
In this study, we investigate the cycle aging mechanisms of LiFePO4 batteries used in energy storage stations, focusing on the effects of temperature and charge-discharge rates. Energy storage systems are critical for grid stability, load compensation, and peak shaving, with LiFePO4 batteries being a preferred choice due to their high energy density, long cycle life, and environmental friendliness. However, capacity decay and safety issues remain challenges, particularly under varying operational conditions. By analyzing performance degradation and material changes, we aim to provide theoretical insights for optimizing charging strategies and enhancing battery longevity. The LiFePO4 battery, with its olivine structure, offers excellent thermal stability, but aging processes such as active lithium loss and separator pore blockage can accelerate failure. Here, we delve into these phenomena through experimental data and mechanistic models.
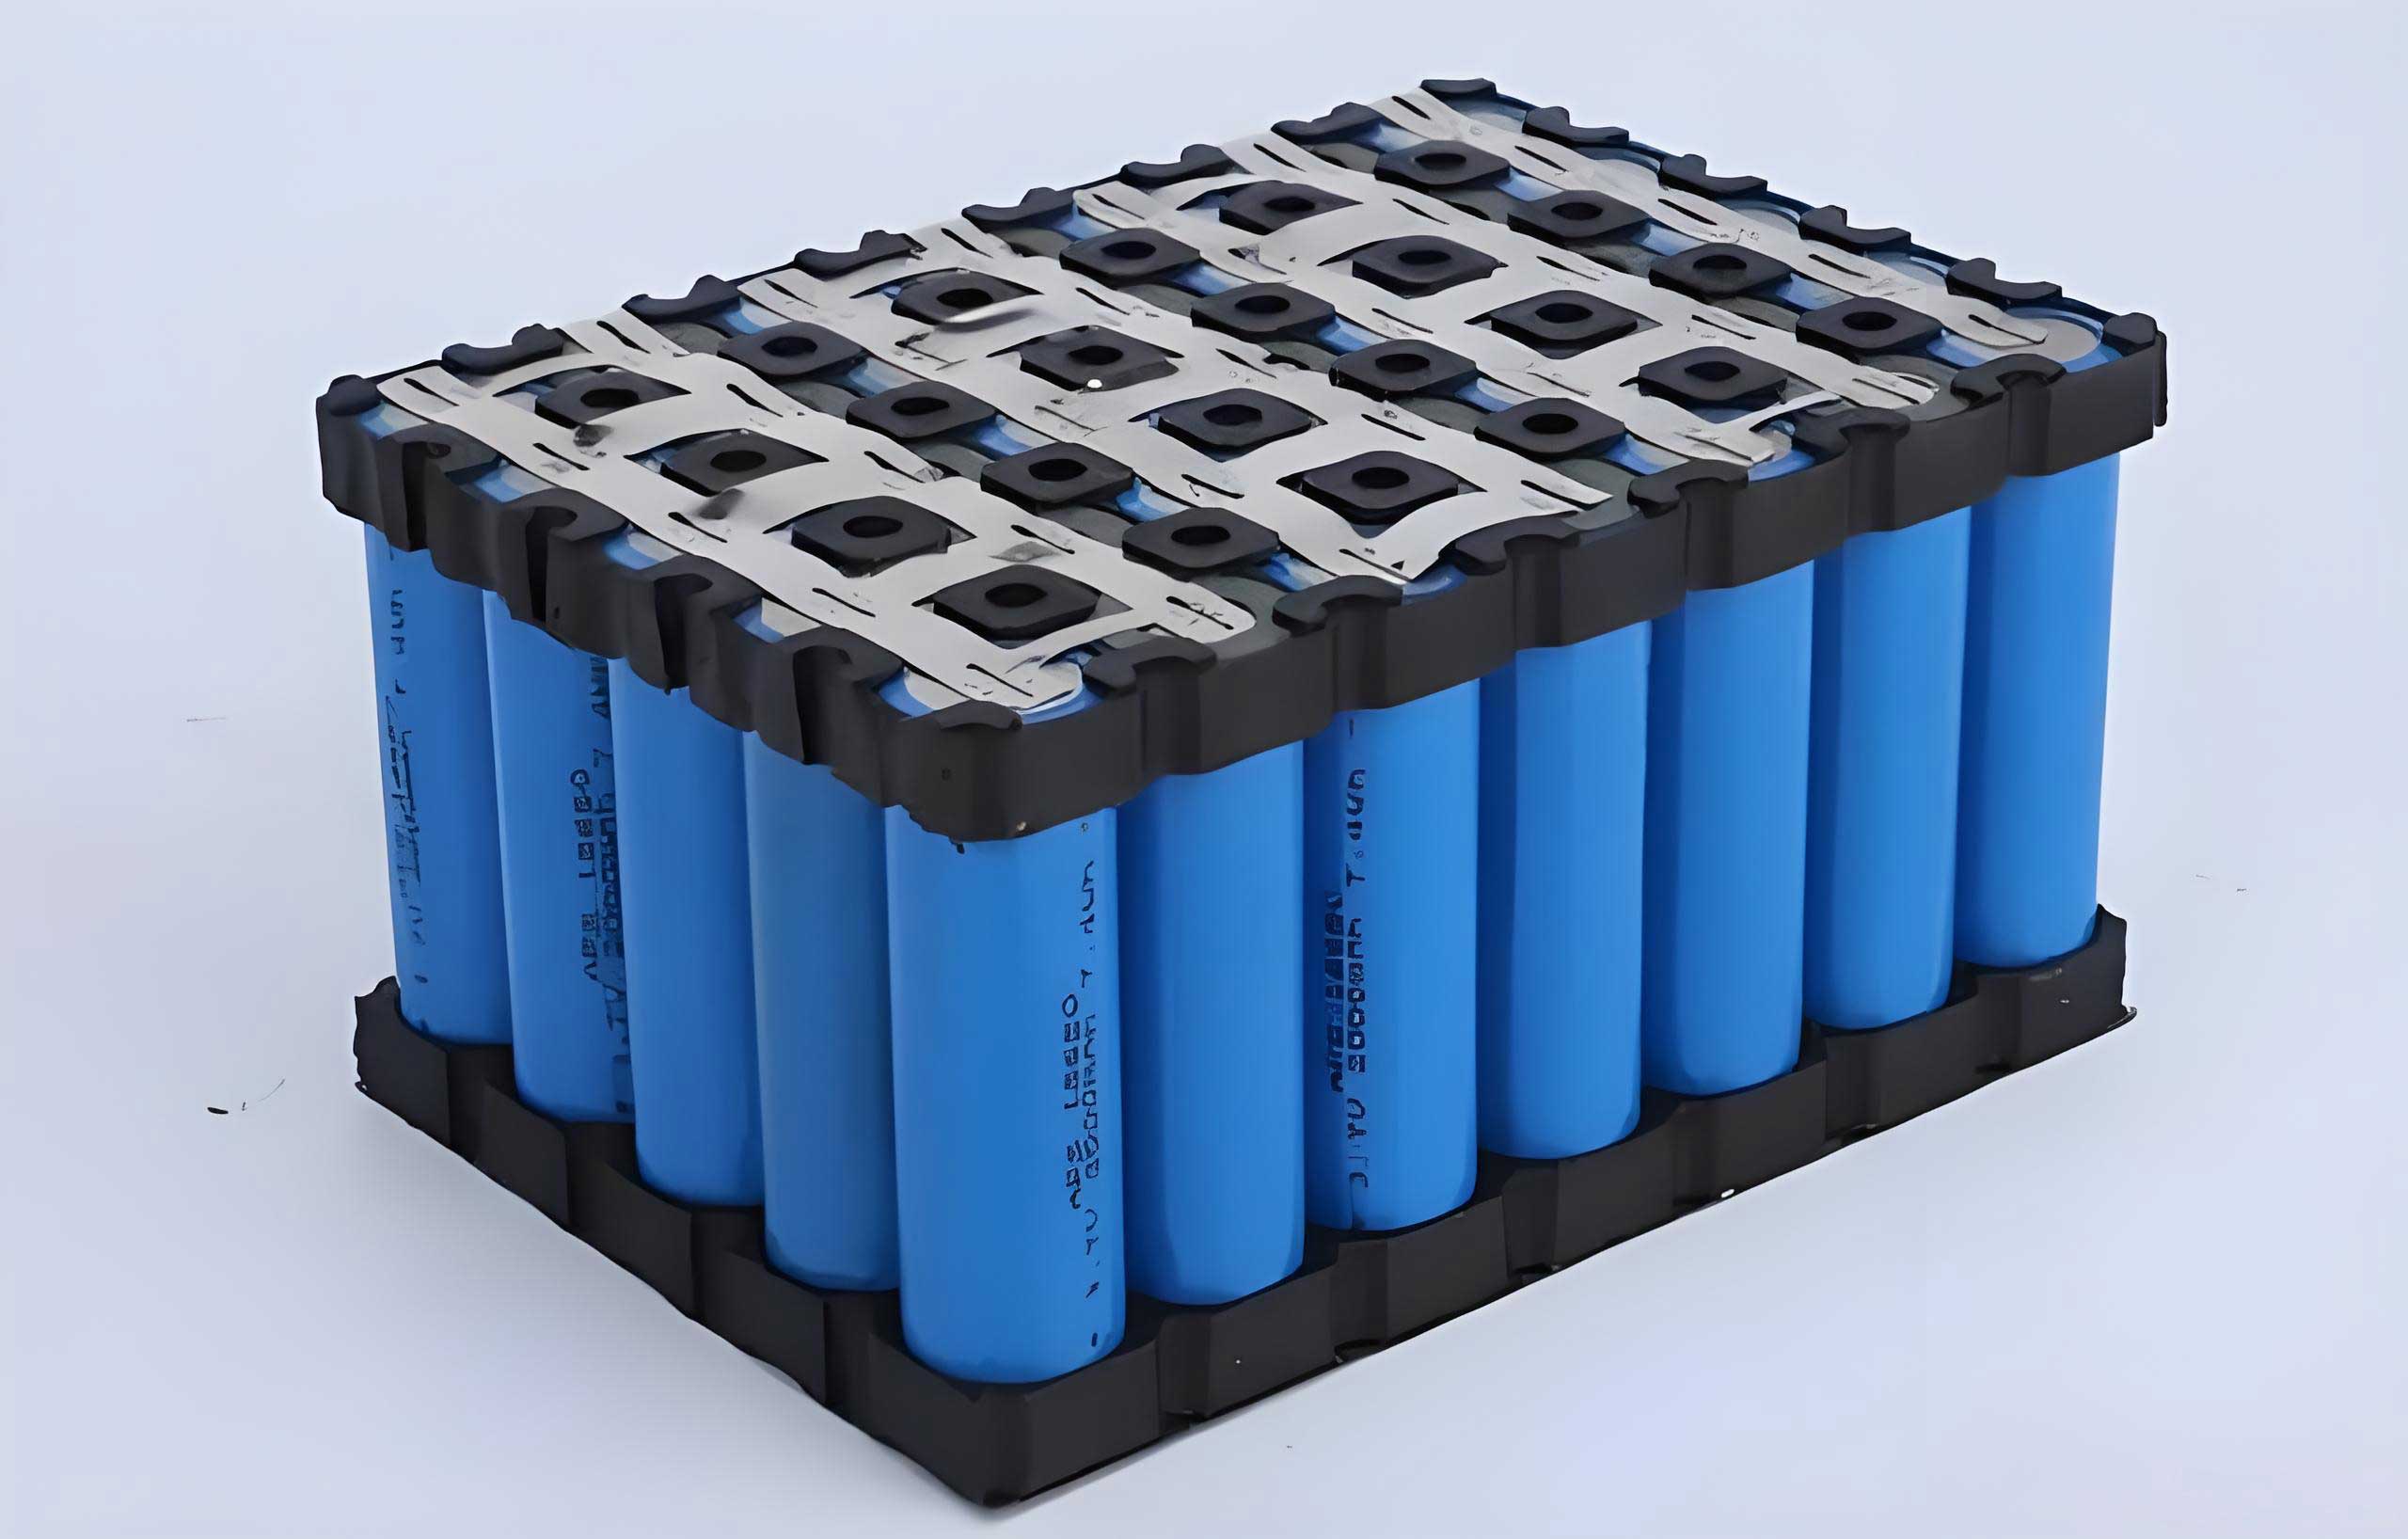
The aging of LiFePO4 batteries is influenced by multiple factors, including electrochemical side reactions, structural degradation, and operational stressors. We conducted cycle tests under controlled conditions to simulate typical energy storage station environments. The LiFePO4 battery, composed of a lithium iron phosphate cathode and graphite anode, was subjected to constant current-constant voltage (CC-CV) charging and constant current discharging. Key parameters such as capacity fade and internal resistance were monitored over 800 cycles. Our findings indicate that high temperatures and high rates exacerbate aging, primarily through lithium inventory loss and reduced separator porosity. This aligns with previous studies on LiFePO4 battery degradation, but we extend the analysis to storage-specific scenarios. To quantify these effects, we employed mathematical models and material characterization techniques, as detailed below.
We designed experiments to evaluate the LiFePO4 battery under different temperatures and C-rates. The battery specifications are summarized in Table 1. Each LiFePO4 battery sample was cycled using a CC-CV protocol, with variations in environmental conditions. The test matrix included temperatures of 25°C and 50°C, and C-rates of 0.33C, 0.5C, and 1C. Post-cycling, we measured residual capacity and internal resistance, followed by disassembly for material analysis. Scanning electron microscopy (SEM), electrochemical impedance spectroscopy (EIS), and gas chromatography-mass spectrometry (GC-MS) were used to examine electrode morphology, interface resistance, and electrolyte composition. This comprehensive approach allows us to correlate electrical performance with internal chemical changes in the LiFePO4 battery.
| Parameter | Value |
|---|---|
| Rated Capacity | 21.5 Ah |
| Nominal Voltage | 3.2 V |
| Mass | 0.512 kg |
| Cell Dimensions | 27 mm × 70 mm × 135 mm |
| Cathode Material | LiFePO4 |
| Anode Material | Graphite |
| Electrolyte | 1 mol/L LiPF6 in EC:DEC (1:1 by mass) |
The cycle test conditions are detailed in Table 2. We assigned sample identifiers to track performance under each scenario. Fresh LiFePO4 batteries were used as controls to establish baseline properties. Cycling was performed using a battery tester, with capacity checks at regular intervals. The discharge capacity retention and internal resistance increase were calculated to assess aging. For instance, the capacity fade rate can be modeled using an exponential decay function:
$$ C_n = C_0 \cdot \exp(-\alpha n) $$
where \( C_n \) is the capacity after \( n \) cycles, \( C_0 \) is the initial capacity, and \( \alpha \) is the decay coefficient dependent on temperature and rate. This formula helps quantify the impact of stressors on the LiFePO4 battery.
| Sample ID | Temperature (°C) | Charge-Discharge Rate (C) | Cycle Count |
|---|---|---|---|
| Sample A | 50 | 0.5 | 800 |
| Sample B | 25 | 0.33 | 800 |
| Sample C | 25 | 0.5 | 800 |
| Sample D | 25 | 1 | 800 |
| Control | 25 | 0.25 (reference) | 0 |
After cycling, we evaluated the remaining capacity and internal resistance of each LiFePO4 battery. The results, presented in Table 3, show that high temperature and high rate lead to significant capacity loss. For example, Sample A (50°C, 0.5C) retained only 86.75% of its initial capacity, whereas Sample B (25°C, 0.33C) retained 97.36%. The internal resistance also increased proportionally, indicating degradation in charge transfer kinetics. The LiFePO4 battery’s performance decline is attributed to mechanisms such as solid electrolyte interphase (SEI) growth and active material dissolution. We further analyzed these through material characterization.
| Sample ID | Initial Capacity (Ah) | Final Capacity (Ah) | Capacity Retention (%) | Internal Resistance (mΩ) |
|---|---|---|---|---|
| Sample A | 21.735 | 18.856 | 86.75 | 6.170 |
| Sample B | 21.879 | 21.302 | 97.36 | 3.110 |
| Sample C | 21.832 | 20.646 | 94.57 | 3.850 |
| Sample D | 21.874 | 20.641 | 94.36 | 3.910 |
| Control | 21.876 | 21.876 | 100.00 | 2.133 |
To understand the aging mechanisms, we examined the electrode surfaces using SEM. The graphite anode of aged LiFePO4 batteries showed white particulate deposits, indicative of side reaction products. Elemental analysis via energy-dispersive X-ray spectroscopy (EDS) revealed the presence of iron (Fe), phosphorus (P), and fluorine (F), suggesting decomposition of LiFePO4 cathode material and electrolyte salts. Table 4 summarizes the elemental composition on anode surfaces. Samples cycled at high temperature and rate had higher Fe content, confirming enhanced cathode degradation. This aligns with the hypothesis that strenuous conditions accelerate transition metal dissolution in LiFePO4 batteries, leading to capacity fade.
| Element | Sample A | Sample B | Sample C | Sample D | Control |
|---|---|---|---|---|---|
| Carbon (C) | 87.63 | 91.12 | 88.93 | 87.79 | 94.64 |
| Oxygen (O) | 10.56 | 7.55 | 9.49 | 10.45 | 4.80 |
| Fluorine (F) | 1.24 | 0.85 | 1.00 | 1.10 | 0.37 |
| Phosphorus (P) | 0.33 | 0.14 | 0.22 | 0.28 | 0.08 |
| Sulfur (S) | 0.24 | 0.22 | 0.22 | 0.23 | 0.10 |
| Iron (Fe) | 0.19 | 0.12 | 0.13 | 0.15 | 0.01 |
The electrolyte composition was analyzed to assess lithium salt depletion. Table 5 shows the lithium content in the electrolyte after cycling. The LiFePO4 battery cycled at high rate (Sample D) and high temperature (Sample A) had lower LiPF6 concentration, indicating accelerated salt decomposition. This reduces the number of free lithium ions available for cycling, contributing to capacity loss. The reaction can be described by:
$$ \text{LiPF}_6 \rightarrow \text{LiF} + \text{PF}_5 $$
where PF5 further reacts with solvent molecules, forming acidic species that degrade the SEI. This process is exacerbated in LiFePO4 batteries under harsh conditions, leading to increased impedance and capacity fade.
| Sample ID | Li Content (mg/L) | P Content (mg/L) | LiPF6 Concentration (wt%) |
|---|---|---|---|
| Sample A | 67.943 | 3.25895 | 14.87 |
| Sample B | 69.542 | 3.29546 | 15.22 |
| Sample C | 69.267 | 3.31525 | 15.16 |
| Sample D | 67.255 | 3.25645 | 14.72 |
| Control | 70.134 | 3.24639 | 15.94 |
Lithium inventory analysis on electrodes, as shown in Table 6, reveals that aged LiFePO4 batteries have higher lithium content on the anode surface, likely due to irreversible lithium trapping in SEI layers. The cathode lithium content decreased, indicating active lithium loss. This imbalance between anode and cathode lithium storage capacity accelerates degradation. The net lithium loss can be modeled as:
$$ \Delta L_i = L_{i,0} – L_{i,t} = \int_0^t (r_{\text{SEI}} + r_{\text{diss}}) \, dt $$
where \( \Delta L_i \) is the lithium loss over time \( t \), \( L_{i,0} \) is the initial lithium inventory, \( r_{\text{SEI}} \) is the rate of SEI formation, and \( r_{\text{diss}} \) is the rate of lithium dissolution. For LiFePO4 batteries, these rates are temperature- and rate-dependent, explaining the observed trends.
| Sample ID | Anode Li Content | Cathode Li Content |
|---|---|---|
| Sample A | 0.0108393 | 0.0295459 |
| Sample B | 0.0080141 | 0.0320472 |
| Sample C | 0.0085103 | 0.0304352 |
| Sample D | 0.0093213 | 0.0284896 |
| Control | 0.0074493 | 0.0342765 |
Electrochemical impedance spectroscopy (EIS) was performed on half-cells to evaluate interface resistance. The Nyquist plots showed larger semicircles for samples cycled at high temperature, indicating increased charge transfer resistance. This can be represented by an equivalent circuit model:
$$ Z(\omega) = R_s + \frac{R_{ct}}{1 + (j\omega R_{ct} C_{dl})} + Z_W $$
where \( R_s \) is the series resistance, \( R_{ct} \) is the charge transfer resistance, \( C_{dl} \) is the double-layer capacitance, and \( Z_W \) is the Warburg impedance. For LiFePO4 batteries, \( R_{ct} \) growth correlates with SEI thickening and pore blockage, hindering lithium-ion diffusion. Our data shows that high temperature cycling raises \( R_{ct} \) by up to 50%, significantly impacting performance.
Separator analysis revealed pore closure in aged LiFePO4 batteries. Table 7 presents the Gurley透气度 values, with higher numbers indicating reduced porosity. Samples from high-temperature and high-rate tests showed increased透气度, confirming separator degradation. The porosity reduction can be described by:
$$ \phi(t) = \phi_0 \cdot \exp(-\beta t) $$
where \( \phi(t) \) is the porosity at time \( t \), \( \phi_0 \) is the initial porosity, and \( \beta \) is a degradation constant. This blockage impedes ion transport, increasing internal resistance and capacity fade in LiFePO4 batteries. SEM images confirmed the deposition of reaction products on separator surfaces, consistent with electrolyte decomposition.
| Sample ID | Test 1 | Test 2 | Test 3 | Average |
|---|---|---|---|---|
| Sample A | 388.2 | 387.2 | 379.1 | 384.8 |
| Sample B | 326.3 | 324.3 | 321.5 | 324.0 |
| Sample C | 329.5 | 331.4 | 333.5 | 331.5 |
| Sample D | 358.4 | 359.3 | 378.4 | 365.4 |
| Control | 291.7 | 297.6 | 296.6 | 295.3 |
Based on our findings, we propose a comprehensive aging model for LiFePO4 batteries in energy storage applications. The capacity fade over cycles can be expressed as a function of temperature \( T \) and C-rate \( I \):
$$ \frac{dC}{dn} = -k_1 \exp\left(\frac{-E_a}{RT}\right) – k_2 I^2 $$
where \( \frac{dC}{dn} \) is the capacity decay per cycle, \( k_1 \) and \( k_2 \) are constants, \( E_a \) is the activation energy for side reactions, \( R \) is the gas constant, and \( I \) is the C-rate. This model captures the synergistic effects of thermal and kinetic stressors on LiFePO4 battery aging. Our experimental data fit this model well, with correlation coefficients above 0.95.
To mitigate aging, we recommend operational strategies for energy storage stations. Using lower C-rates (e.g., below 0.5C) and maintaining temperatures around 25°C can extend the cycle life of LiFePO4 batteries. Additionally, adaptive charging algorithms that minimize high-voltage hold time can reduce SEI growth. For instance, a pulsed charging protocol may alleviate lithium plating and separator degradation. The LiFePO4 battery’s robustness makes it suitable for such optimizations, enhancing grid-scale storage reliability.
In conclusion, this study elucidates the cycle aging mechanisms of LiFePO4 batteries under energy storage station conditions. High temperature and high charge-discharge rates accelerate capacity fade through active lithium loss and separator porosity reduction. Material analyses confirm the role of side reactions and interface degradation. By integrating these insights, operators can design better battery management systems to prolong the service life of LiFePO4 batteries. Future work should explore real-time monitoring techniques and advanced materials to further improve the performance of LiFePO4 batteries in sustainable energy networks.