
1. Introduction
In the process of achieving the “30 · 60” dual carbon strategy goal, the penetration rate of new energy has rapidly increased. Taking wind power as an example, according to data from the National Energy Administration, as of the end of November 2022, the installed capacity of wind power was about 350 million kilowatts, a year-on-year increase of 15.1%. The large-scale integration of wind turbines has led to serious wind abandonment and insufficient peak shaving capacity of thermal power units, affecting the safe and stable operation of the power system. Energy storage has high energy density and fast charging and discharging capabilities. By configuring energy storage systems, the above problems can be effectively alleviated. However, as the penetration rate of wind power continues to increase, traditional time slot partitioning will further deteriorate the net load curve and increase the cost of energy storage configuration. Considering the re generation of wind power output, time slot partitioning will reduce the peak valley difference and wind abandonment rate of the net load curve, thereby improving the economic efficiency of the energy storage system. Therefore, in order to ensure the economic configuration of energy storage systems, it is of great research significance to consider the allocation of energy storage systems based on time division.
At present, scholars both domestically and internationally have conducted extensive research on the configuration of energy storage systems. Using regional energy systems as the application scenario, energy storage configuration is only aimed at minimizing the comprehensive investment and operating costs of the energy storage system, without considering the impact of indicators such as energy storage system benefits on the model; Establish an optimized configuration model for power and heat storage equipment in a regional comprehensive energy system. This model takes the lowest total system cost as the objective function, while considering investment, operation, and compensation costs. Improve the efficiency of regional comprehensive energy systems by optimizing the configuration of equipment with the goal of minimizing the total system cost; A hybrid energy system model has been proposed, which mainly consists of photovoltaic power stations, small hydropower stations, and pumped storage power stations. On the basis of this model, a bilevel programming model is constructed with two objective functions: minimizing the system investment cost and maximizing the system’s revenue from electricity sales. Intended to achieve maximum economic benefits by optimizing investment and returns in the energy system. The above literature mainly considers the cost of energy storage and configures energy storage systems with the optimization goal of economy. In addition, reference [8] proposed an optimization model for user demand response energy storage regulation (DR-ESS) to achieve optimal electricity consumption. By establishing a real-time electricity price demand response model for users, considering capacity market contracts, and optimizing energy storage power and capacity with the goal of maximizing the net income of users throughout their entire life cycle, and optimizing energy storage charging and discharging strategies with the goal of maximizing daily income of users, the maximum benefit of electricity consumption is achieved, but the impact of time period division on energy storage configuration is not considered; The research object of reference [9] is to add energy storage devices and existing distributed photovoltaics to form a grid connected optical storage microgrid. A demand side response model was introduced to optimize the configuration of energy storage in the microgrid, but no consideration was given to re optimizing peak and valley periods.
In summary, this article divides the time period based on net load and constructs an optimization model for energy storage configuration in high wind power penetration systems. In the optimization of time slot partitioning, this model takes wind power consumption rate, user satisfaction maximization, and peak valley difference minimization as multi-objective functions, and transforms them into a single objective optimization problem through weighting coefficients. Finally, the optimal time slot partitioning is solved through simulation using quantum particle swarm optimization algorithm; In the capacity allocation model, a comprehensive consideration is given to energy storage costs, thermal power unit operating costs, wind abandonment penalty costs, energy storage benefits, and thermal power unit benefits. The objective function is to minimize the system net cost, and the optimal energy storage is obtained through the solver CPLEX optimization.
2. Time period division and user response model
As the penetration rate of new energy continues to increase, the traditional time division in the past will further increase the peak valley difference of net load. Therefore, it is necessary to re divide the time period. Based on the net load curve, the formula for calculating the peak valley membership degree of each time node is shown in equation (1).
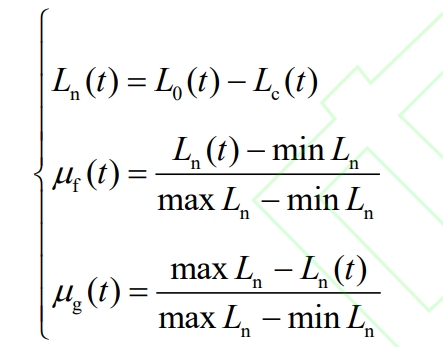
In the equation, μ F (t) is the peak membership degree at time t; μ G (t) is the valley membership degree at time t; L0 (t) and Lc (t) respectively represent the user load value and new energy output value at time t; Ln (t) is the net load curve value at time t; Max Ln and min Ln are the peak and valley values of the net load curve, respectively.
From equation (1), it can be seen that the value of peak valley membership at each time represents the likelihood of belonging to the peak valley period. Therefore, time periods can be divided by determining the threshold of peak valley membership, as shown in equation (2).
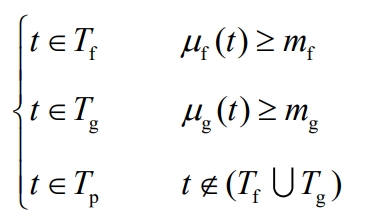
In the formula, Tf, Tg, and Tp refer to peak, valley, and normal periods respectively; Mf and mg are the peak and valley membership values, respectively.
Under the stimulation of the electricity price difference during the time period, users respond to the new time period division and obtain the corresponding load curve through fitting. The calculation formula is shown in equation (3).
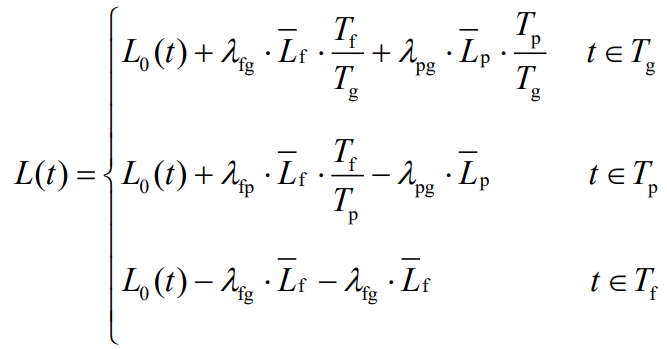
In the formula, L (t) is the load value after the user’s response at time t; λ Fg λ Fp λ Pg represents the peak valley, peak flat, and flat valley load transfer rates, respectively; Lf and Lp are the average load values of the user during the peak and normal response periods, respectively.
3.Optimization model for energy storage configuration considering time period division
Unreasonable traditional time slot division can lead to an increasing peak valley difference, affecting the stability of the power grid system. In order to improve wind power consumption rate, reduce energy storage configuration costs, and alleviate the pressure of peak shaving on thermal power units, it is necessary to optimize the traditional time slot division first, and then consider the economy of the thermal storage system for energy storage configuration. The structure diagram of the energy storage configuration optimization model considering time period division proposed in this article.
In the time period optimization model, the net load is first calculated based on the input load and wind power data, and the peak valley flat time periods are re divided based on the net load curve. Multi objective optimization is carried out to minimize the peak valley difference rate, maximize the wind power consumption rate, and user satisfaction, and obtain the optimal peak valley membership threshold; Based on the consumer psychology model, the user response load curve is calculated. In the energy storage configuration model, the factors of energy storage cost, thermal power unit operation cost, wind abandonment penalty cost, energy storage revenue, and thermal power unit revenue are comprehensively considered. The goal is to minimize the net cost of the system, optimize the energy storage capacity and maximum charging and discharging power, and select the configuration scheme with the lowest cost as the configuration result of the energy storage system.
3.1 Time Period Optimization Model
3.1.1 Objective function
Introducing demand side management in energy storage configuration, in order to ensure the rationality of time period division, the optimization process should consider the absorption rate RX of the power generation side fan and the peak valley difference RD of the net load curve on the one hand, and the satisfaction of the user side on the other hand, ultimately obtaining the optimal peak valley membership thresholds mf and mg.
This method is a multi-objective optimization, which is transformed into a single objective optimization using a weighted coefficient method. The objective functions are to maximize wind power consumption rate, minimize peak valley difference, and maximize user satisfaction:
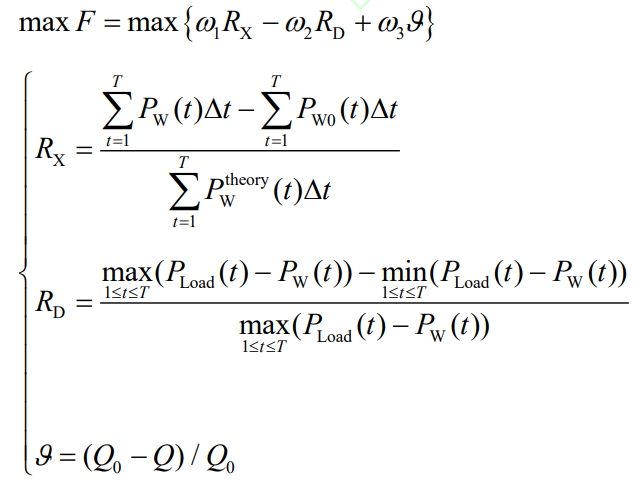
In the equation, ω 1 ω 2 ω 3 is the weighting coefficient; Pw0 (t) and Pw (t) are the grid connected power values at time t before and after the response of the wind turbine user; PteoryW (t) is the theoretical output value of the wind turbine at time t; PLoad (t) is the load value of the system at time t; Q0 and Q respectively represent the total electricity consumption cost before and after the user side response; T Δ T is the number of scheduling periods and the length of each period for the energy storage system.
Among them, the scheduling period in this article is one day, taking T=24, and the duration of each segment Δ T=1h.
3.1.2 Constraints
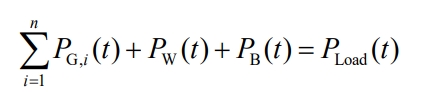
(1) System energy balance constraints
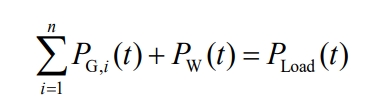
In the formula, PG, i (t) is the output value of thermal power unit i at time t; N is the number of thermal power units in the system.
(2) Constraints of thermal power units
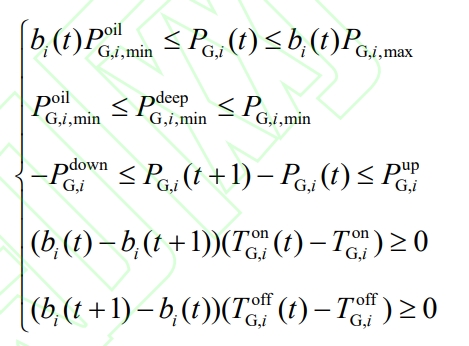
The constraints of thermal power units include peak shaving power constraints, unit ramp rate constraints, and minimum duration of start-up and shutdown constraints.
In the formula, bi (t) is the operating state of thermal power unit i at time t; PG, i, max, PoilG, i, min, PdeepG, i, min, PG, i, min are the maximum output power of the thermal motor group i, the minimum power for oil depth peak shaving, the minimum power for non oil depth peak shaving, and the minimum power for conventional peak shaving, respectively; Pup G, i, and Pdown G, i are the maximum upward and downward climbing amounts of the thermal motor group i, respectively; TonG, i (t) and ToffG, i (t) are the duration of the startup and shutdown of thermal power unit i at time t, respectively; TonG, i, and ToffG, i are the minimum start and stop durations of the thermal motor group i.
When bi (t)=1, the unit starts up; When bi (t)=0, the unit shuts down.
(3) Wind power constraints
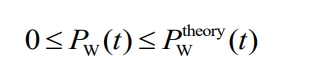
The constraint on the consumption of wind turbines is:
(4) Time constraints
The total time of each peak valley leveling period should not be less than 6 hours and each continuous period should not be less than 2 hours, namely:
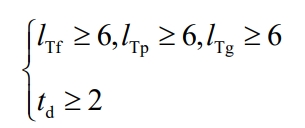
In the formula, lTf, lTp, and lTg are the total length of peak period, total length of normal period, and total length of valley period, respectively; Td is the length of each consecutive period.
(5) User side constraints
The change in electricity consumption costs on the user side before and after time slot division should be between -1% and 0%, namely:
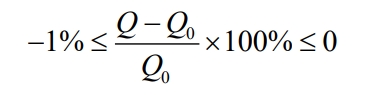
In the formula, Q0 and Q respectively represent the total electricity consumption cost before and after the user side response.
3.2 Energy Storage Configuration Optimization Model
3.2.1 Objective function
In order to improve the economic efficiency of energy storage configuration, based on the optimal time division and considering system costs and benefits, the capacity configuration and maximum charging and discharging power of the energy storage system are optimized with the objective function of minimizing the net cost of the system. The overall objective function of the energy storage configuration optimization model is:
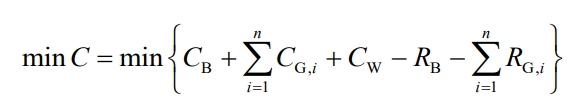
In the formula, CB represents the total investment cost of the energy storage system; CG, i is the operating cost of the thermal motor set i; CW is the penalty cost for wind abandonment; RB is the total revenue of the energy storage system; RG, i is the compensation income of the thermal motor group i.
(1) Investment cost of energy storage system
The total investment cost of energy storage system CB includes two parts: initial investment cost CB1 and operation and maintenance cost CB2, namely:
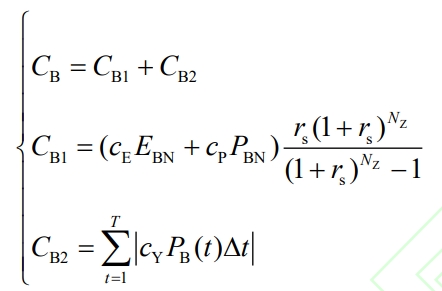
In the formula, Ec and Pc are the unit prices for energy storage capacity configuration and power configuration, respectively; EBN and PBN respectively represent the rated capacity and rated power of the energy storage configuration; Rs is the discount rate; NZ is the operating life of energy storage; Yc is the unit price of energy storage operation and maintenance cost; PB (t) is the output value of the energy storage system at time t.
Among them, when PB (t)>0, the energy storage system is discharged, and when PB (t)<0, the energy storage system is charged.
(2) Operating cost of thermal power units
When the output of the thermal power unit is in conventional peak shaving, the main cost is coal consumption cost CcoalG, i; When the unit is in deep peak shaving, it will incur additional loss costs to the unit, CdeepG, i; When the unit is in peak shaving mode with oil injection depth, additional oil injection costs will be incurred, CoilG, i. The corresponding calculation formula is as follows:
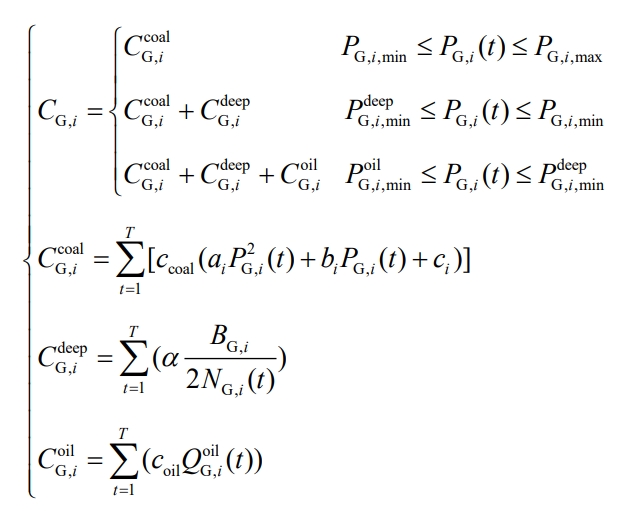
In the formula, ai, bi, and ci are the coefficients of the consumption characteristic function of the thermal motor group i, respectively; α Is the operating loss coefficient of thermal power units; BG, i is the purchase cost of the thermal motor group i; NG, i (t) is the number of rotor cracking cycles of thermal power unit i at time t, which is related to the output of the unit; QoilG, i (t) is the amount of oil injected into the thermal motor unit i at the time of deep peak shaving t; Ccoal and Coal are unit coal prices and unit oil prices, respectively.
(3) Penalty cost for wind abandonment
In order to improve the wind power consumption rate, the penalty cost CW for abandoned wind power is introduced, and the calculation formula is:
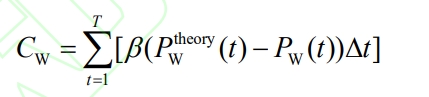
In the equation, β Is the penalty coefficient for wind abandonment.
(4) Energy storage revenue
When the energy storage system assists in peak shaving of thermal power units, on the one hand, it can obtain energy storage compensation benefits RB1; On the other hand, the energy storage system charges during the low net load period and discharges during the peak net load period, resulting in a price difference and earning arbitrage income RB2; The formula for calculating the total energy storage revenue RB is:
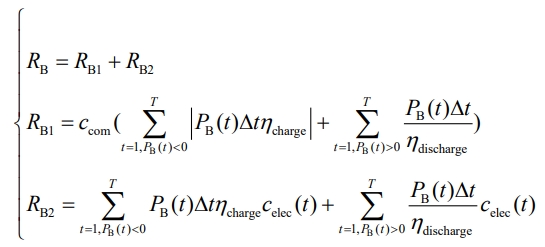
In the formula, ccom and celec (t) respectively represent the compensation unit price for energy storage participating in grid peak shaving and the electricity price of the grid at time t; η Charge η Discharge refers to the charging and discharging efficiency of the energy storage system.
(5) Revenue from thermal power units
When thermal power units are in deep peak shaving, corresponding compensation benefits will be obtained according to local policies, and the calculation formula is:
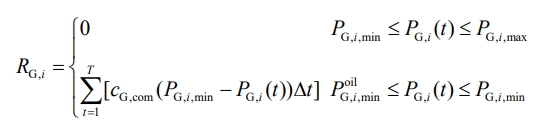
In the formula, cG and com are the unit prices for deep peak shaving compensation of thermal power units.
3.2.2 Constraints
(1) System energy balance constraints:
(2) Energy storage system constraints
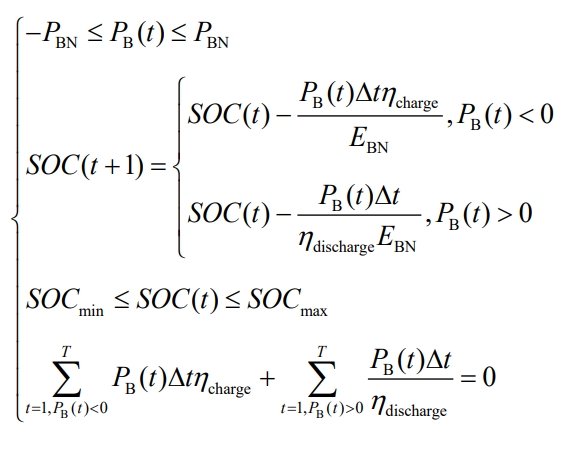
The constraints of the energy storage system include charging and discharging power constraints, state of charge constraints, and daily charging and discharging energy balance constraints.
In the formula, SOC (t) is the state of charge at the time of energy storage t; SOCmax and SOCmin are the upper and lower limits of the energy storage state of charge, respectively.
In addition, its constraints also include the constraints of thermal power units and wind power in 3.1.2.
4.Model solving
(1) A Solution Method for Time Period Optimization Model
Traditional particle swarm optimization algorithms have drawbacks such as poor randomness in search and being prone to falling into local optima. Therefore, this article uses quantum particle swarm optimization to improve the particle update process, improving the randomness of particle optimization and reducing the parameters that need to be set in the model. The algorithm steps are as follows:
1)Initialize population parameters, set decision variables to peak valley membership degrees mf and mg, input raw data, add system constraints and penalty functions;
2)Calculate the fitness function of each particle and generate the initial individual optimal position Pibest and global optimal position gbest;
3)Update the particle population, pi is used to update the position of the i-th particle, and the calculation formula is as follows:
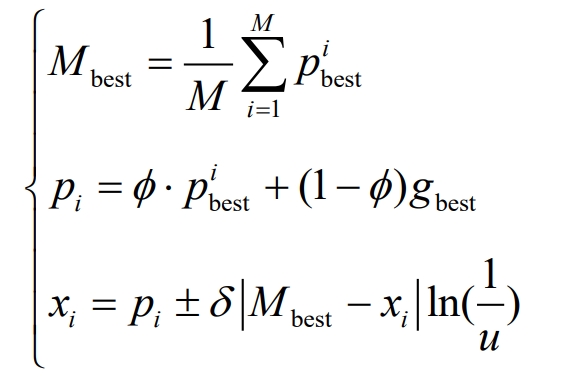
In the formula, Mbest is the best position in the average particle history; M is the population size; φ And u are uniformly distributed values on (0,1); Xi is the position of the i-th particle; δ The innovation parameter is generally not greater than 1.
The probability of taking positive and negative values in the particle position update formula is 50%.
4)Determine whether the algorithm termination condition is met. If it is met, the operation will end and the optimal solution will be output. Otherwise, proceed to the next iteration.
(2) Solution Method for Energy Storage Configuration Optimization Model
Call the CPLEX 12.8 solver in YALMIP toolbox in Matlab2018b to solve. First, set the basic unit of energy storage capacity and power configuration as Δ E Δ P to initialize decision variables; Input data parameters, optimization variables, constraints, objective functions, and optimization solution configurations in sequence according to the syntax structure of the solver; Then, the optimal configuration scheme of the energy storage system is obtained.
5.Example analysis
5.1 Basic Data
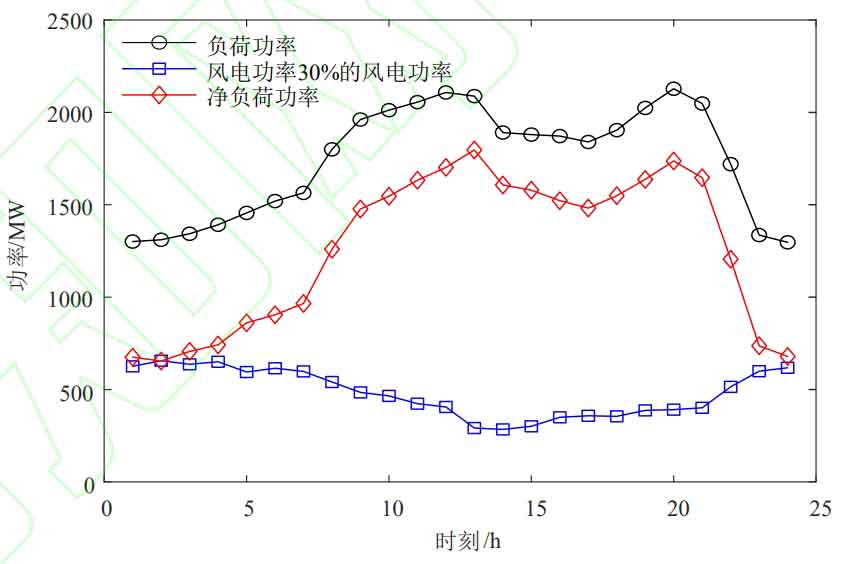
This article uses typical daily wind power data and load data from a regional power grid for optimization simulation, as shown in Figure 1. The wind power penetration rate corresponding to Figure 1 is 30%, and changing its total installed capacity can correspond to different penetration rates. Mature lithium iron phosphate batteries are selected for energy storage, and the parameters related to energy storage are shown in Table 1. The traditional local time division and peak valley electricity prices are shown in Table 2.
| Parameter | Numerical value |
| Charging and discharging efficiency/% | 97 |
| Unit price of capacity configuration/[yuan/(kW · h)] | 2250 |
| Unit price of power configuration/(yuan/kW) | 4500 |
| Unit price of operation and maintenance cost/[yuan/(kW · h)] | 0.05 |
| Operating years/year | 8.2 |
| Discount rate | 0.04 |
| Unit price of energy storage participating in peak shaving | 0.4 |
| State of Charge Limit/% | 10—90 |
| Penalty coefficient for wind abandonment/[yuan/(kW · h)] | 0.61 |
| Coal price/(yuan/t) | 685 |
| Oil price/(yuan/t) | 6130 |
| Unit price of deep peak shaving compensation for thermal power units/[yuan/(kW · h)] | 0.4 |
| Operating loss coefficient of thermal power units (without or with oil) | 1.2,1.5 |
| Time period | Electricity price/[yuan/(kW · h)] | |
| Peak Time | 8:00~11:00,18:00~23:00 | 1.149 |
| Valley Time | 7:00~8:00,11:00~18:00 | 0.782 |
| Peace Time | 23:00~7:00 | 0.414 |
Among them, the total installed capacity of the thermal power unit system is 2200MW, with two units each of 200MW, 300MW, and 600WM. The mode setting is: all units participate in basic peak shaving, and the minimum output of the units is 50% Pn; Only 600WM units can participate in deep peak shaving, with a critical output of 40% Pn for deep peak shaving without oil injection, and a minimum output of 30% Pn for deep peak shaving with oil injection. The relevant parameters of the thermal power unit system are shown in Table 3.
| Unit capacity/MW | Consumption characteristic coefficient value ai/(t/MW ^ 2) | Consumption characteristic coefficient value bi/(t/MW) | Consumption characteristic coefficient value ci/t | Climbing rate/(MW/h) |
| 200 | 0.0011241 | 0.28730 | 4.07362 | 58 |
| 200 | 0.0011241 | 0.28730 | 4.07362 | 84 |
| 300 | 0.00013074 | 0.23222 | 16.007 | 103 |
| 300 | 0.00013074 | 0.23222 | 16.007 | 125 |
| 600 | 0.0000169 | 0.27601 | 11.46196 | 130 |
| 600 | 0.0000169 | 0.27601 | 11.46196 | 150 |
The time period optimization model uses quantum particle swarm optimization algorithm to solve the optimization, with a particle population size of 200, an iteration number of 80, and innovative parameters δ Is 0.5.
5.2 Comparison and Analysis of Different Energy Storage Configuration Schemes
In the article, the net load after the integration of new energy is divided into time periods, and the capacity and power of energy storage are configured with the goal of optimal economic efficiency. In order to demonstrate the superiority of the configuration scheme in the text and fully consider the changes in permeability, the following three scenarios and two algorithms are set up for comparative analysis.
Scenario 1, Scenario 2, and Scenario 3 correspond to wind power penetration rates of 30%, 50%, and 80%, respectively. Algorithm 1 allocates energy storage with economic efficiency as the goal under traditional time slot partitioning, while Algorithm 2 allocates energy storage with economic efficiency as the goal under optimal time slot partitioning (this model). Each scenario is optimized using two algorithms.
(1) Comparison of time period division results
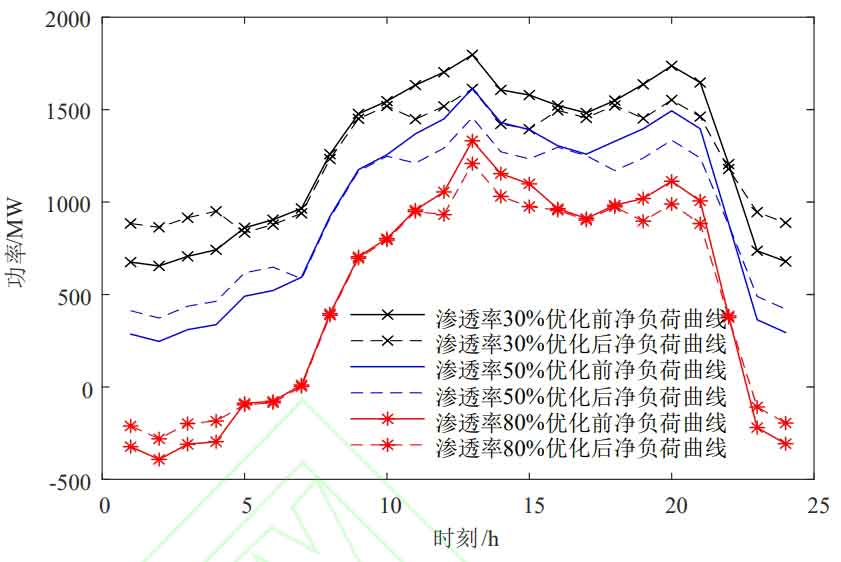
In the time interval optimization model, the weighted coefficients are all 1/3 to obtain the optimal peak valley and interval division results under different permeabilities, as shown in Table 4. The optimal time division of user side response results in the net load curves before and after the time division under different wind power penetration rates, as shown in Figure 2.
| Scene | Peak membership threshold | Valley membership threshold | Peak Time | Peace Time | Valley Time |
| 1 | 0.7867 | 0.8222 | 11:00~16:00, 19:00~22:00 | 5:00~11:00, 16:00~19:00 | 0:00~5:00, 22:00~24:00 |
| 2 | 0.7763 | 0.7492 | 11:00~16:00, 18:00~22:00 | 7:00~11:00, 16:00~18:00 | 0:00~7:00, 22:00~24:00 |
| 3 | 0.8068 | 0.8273 | 12:00~16:00, 19:00~21:00 | 7:00~12:00, 16:00~19:00 | 0:00~7:00, 21:00~24:00 |
From Table 4, it can be seen that there is a significant deviation between peak and valley periods compared to traditional periods, with a significant increase in valley periods. This is due to the fact that wind power output is higher at night than during the day, while residents use relatively less electricity in the early morning. As the penetration rate of wind turbines increases, traditional time division will worsen the duck curve. Therefore, the optimized time period uses valley hour electricity prices at night and in the early morning. Under the incentive of electricity prices, Based on consumer psychology, it encourages users to change their electricity usage habits, leading to load transfer. From Figure 2, it can be intuitively seen that the optimal period division plays a role in peak shaving and valley filling, and the optimized net load curve becomes smoother, which is conducive to the safe and economic operation of thermal power units.
Calculate the peak valley difference, user satisfaction, and wind power consumption rate of the net load curve before and after optimization under different penetration rates, as shown in Table 5.
| Wind power penetration rate | Algorithm | Total electricity cost/10000 yuan (satisfaction) | Net load maximum load/MW | Net load minimum load/MW | Peak valley difference of net load/MW | Net load rate | Wind power consumption rate |
| 30% | 1 | 3442.1 | 1796.61 | 654.59 | 1142.02 | 70.28% | 86.15% |
| 30% | 2 | 3436.2(-0.17%) | 1612.13 | 834.55 | 777.58 | 77.07% | 94.30% |
| 50% | 1 | 3442.1 | 1615.24 | 246.40 | 1368.84 | 59.64% | 74.47% |
| 50% | 2 | 3408.7(-0.97%) | 1457.00 | 372.76 | 1084.24 | 64.77% | 81.18% |
| 80% | 1 | 3442.1 | 1331.59 | -392.00 | 1723.59 | 37.17% | 56.28% |
| 80% | 2 | 3420.7(-0.62%) | 1208.65 | -280.24 | 1488.89 | 39.97% | 66.93% |
From Table 5, it can be seen that: ① Taking the wind power penetration rate of 30% as an example, after users responded to the new peak valley period division, the total electricity cost decreased by 59000 yuan, a decrease of 0.17 percentage points, and user satisfaction was improved; The peak valley difference of net load has been reduced by 364.44MW, and the load rate has also been improved, playing a role in peak shaving and valley filling, reducing the operational burden of thermal power units; The wind power consumption rate has increased by 8.15 percentage points, and real-time segment division has played a role in promoting wind power consumption. This is because under the optimal segment division, the load responded by users is more consistent with wind power output; ② As the permeability increases, the peak valley difference increases in a stepped manner, and the load rate and wind power consumption rate continue to decrease. After optimizing the time period, both have corresponding improvements, verifying the effectiveness of time period optimization in different permeabilities.
(2) Comparison of energy storage configuration results
On the basis of optimizing the time period, set the power iteration step of the energy storage system to Δ P=5MW, iteration step size of energy storage capacity is Δ E=10MW,
The initial state of charge of energy storage is set to 0.2, with the goal of minimizing net cost, to obtain the optimal energy storage capacity and power configuration. The optimization results are shown in Figure 3, Figure 4, and Figure 5.
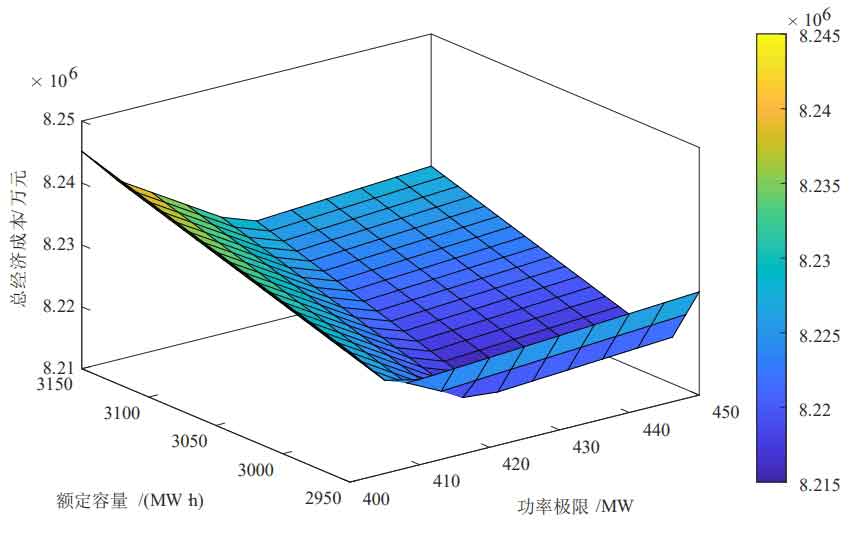
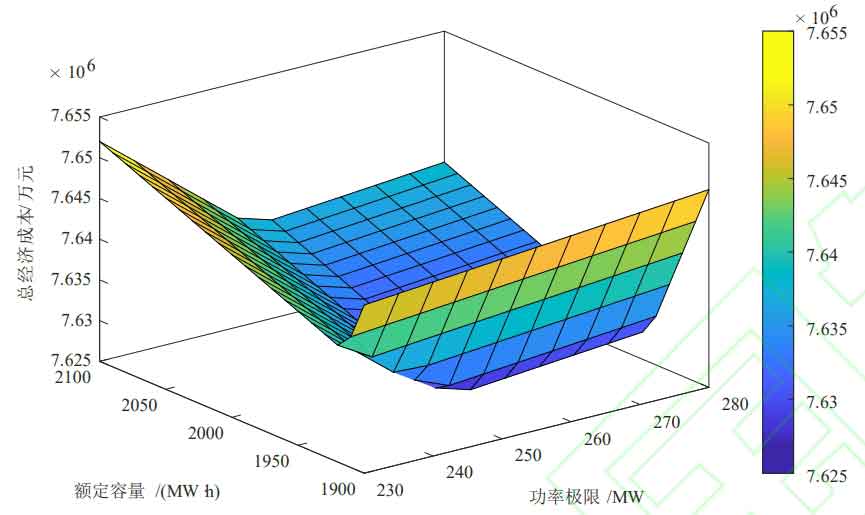
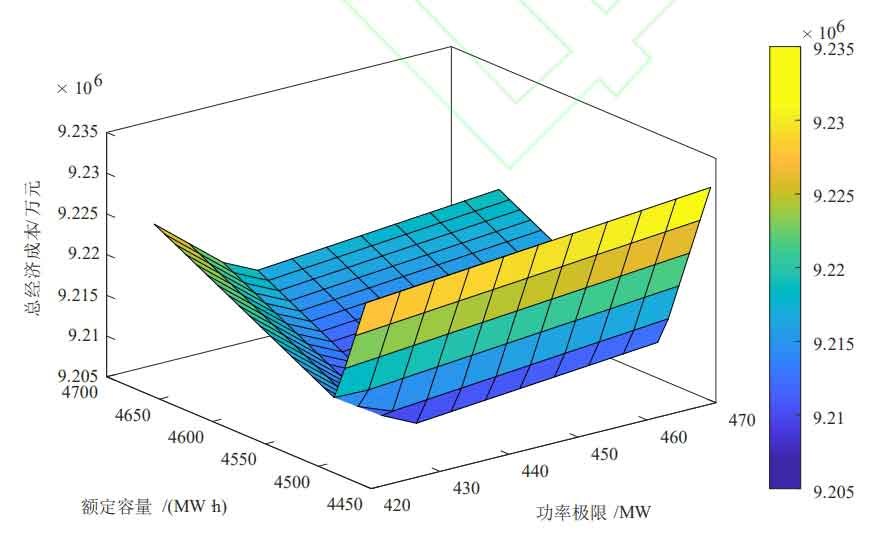
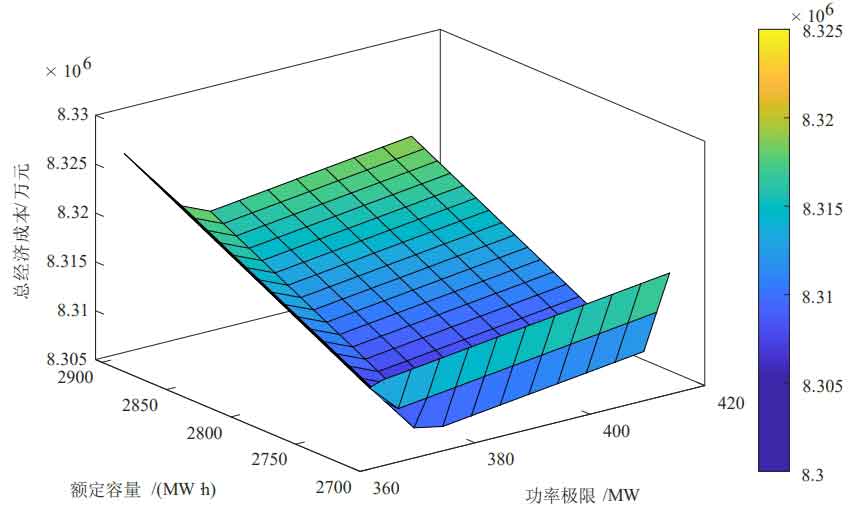
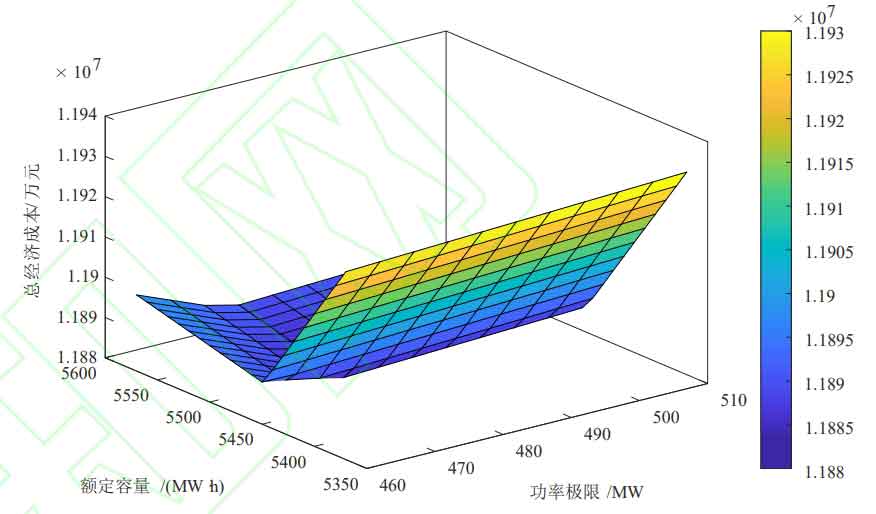
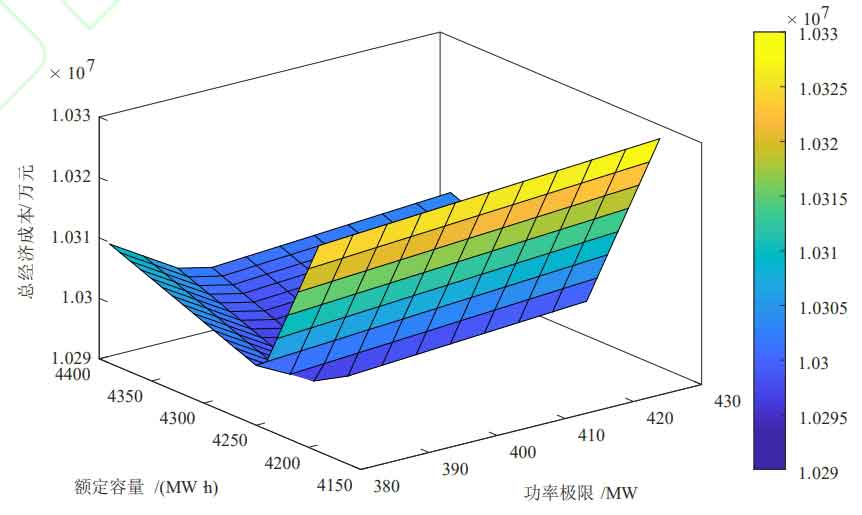
The optimal energy storage configuration, daily investment cost of energy storage system, operating cost of thermal power unit, penalty cost for wind abandonment, net system cost, and wind abandonment rate corresponding to different permeabilities and algorithms are shown in Table 6.
| Wind power penetration rate | Algorithm | Capacity configuration/(MW · h) | Power configuration/MW | Daily investment cost of energy storage system/10000 yuan | Operating cost of thermal power units/10000 yuan | Penalty cost for wind abandonment/10000 yuan | Net system cost/10000 yuan | Abandonment rate/% |
| 30% | 1 | 2980 | 425 | 49.93 | 728.19 | 43.60 | 821.49 | 6.6 |
| 30% | 2 | 1950 | 255 | 32.506 | 710.73 | 19.578 | 762.65 | 2.86 |
| 50% | 1 | 4560 | 435 | 74.85 | 639.86 | 206.38 | 920.72 | 18.06 |
| 50% | 2 | 2780 | 380 | 46.47 | 637.91 | 146.39 | 830.49 | 12.81 |
| 80% | 1 | 5470 | 475 | 83.65 | 654.24 | 450.74 | 1188.34 | 24.65 |
| 80% | 2 | 4260 | 395 | 65.15 | 645.41 | 318.90 | 1029.28 | 17.44 |
From the data in Table 6, it can be seen that:
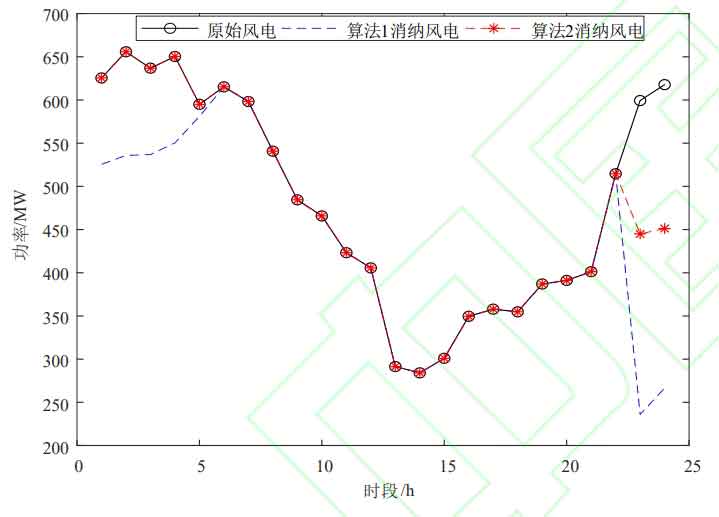
① When the wind power penetration rate is 30%, the optimal energy storage system configuration results for Algorithm 1 and Algorithm 2 are 425MW/2980MW · h and 255MW/1950MW · h, respectively. Considering the optimization of the time period, the capacity and power configuration are reduced, resulting in lower initial investment costs. After considering the optimization of the time period, the net cost of the system is reduced by 588400 yuan, and the economic efficiency is improved; The wind abandonment rate decreased from 6.6% to 2.86%, promoting the consumption of wind power. The consumption of wind power is shown in Figures 6 and 7. Due to the smoother net load of Algorithm 2 during time optimization, the configured energy storage is more economical. Considering the optimization of time slot division, compared to only considering economic optimization, the cost is lower and the wind power consumption rate is higher, so Algorithm 2 is better;
② As the penetration rate of wind power increases, the demand for energy storage and wind abandonment rate also increase. This is because the increase in penetration rate leads to a larger peak valley difference in the net load curve, requiring more energy storage for peak shaving. At the same time, the cost of wind abandonment penalty increases. Due to the high cost of energy storage, the allocation finds an economic balance between wind abandonment cost and energy storage investment cost.
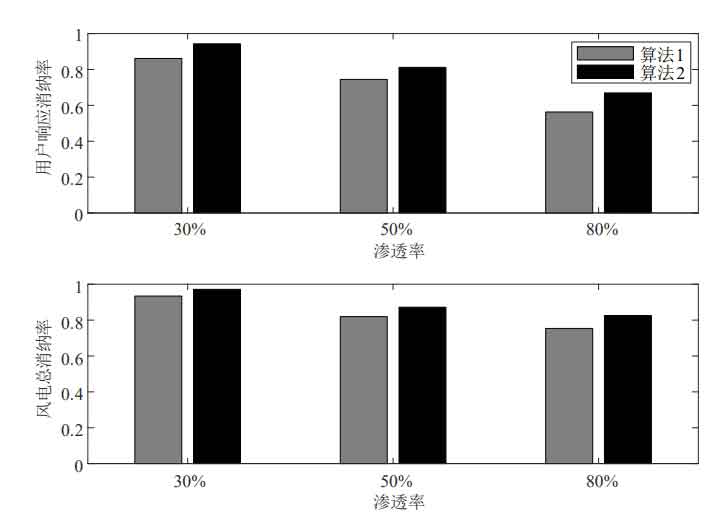
From Figures 6 and 7, it can be seen that as the permeability increases, the wind power consumption rate gradually decreases. Compared with Algorithm 1, Algorithm 2 improves the wind power consumption rate, thereby reducing the penalty cost for wind abandonment.
Figure 8 shows the operating status of the energy storage system with a wind power penetration rate of 30%, with positive charging and negative discharging. As shown in Figure 8, the energy storage system charges during low net load periods and discharges during peak net load periods, reducing the peak shaving pressure on thermal power units; The peak charging and discharging power of Algorithm 1 and Algorithm 2 energy storage systems are 425MW and 255MW, respectively, both within the rated power range, and the state of charge remains between 0.1 and 0.9, indicating that the energy storage system meets the constraints in the text.
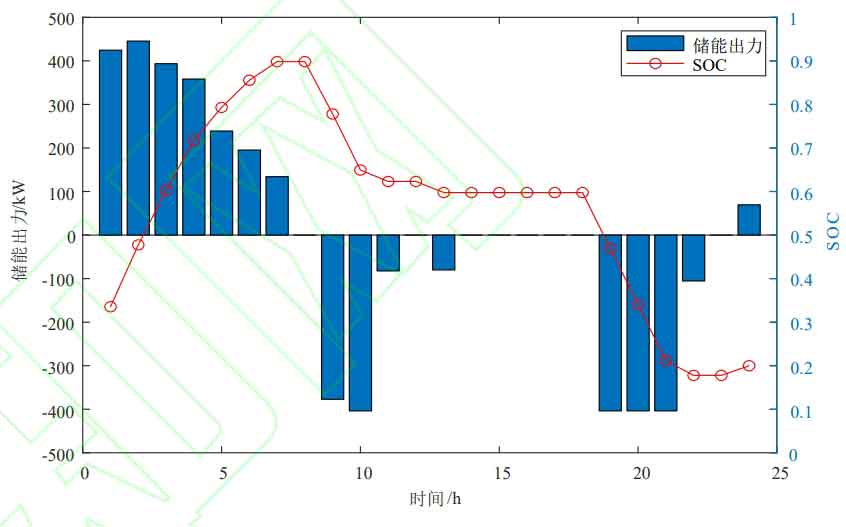
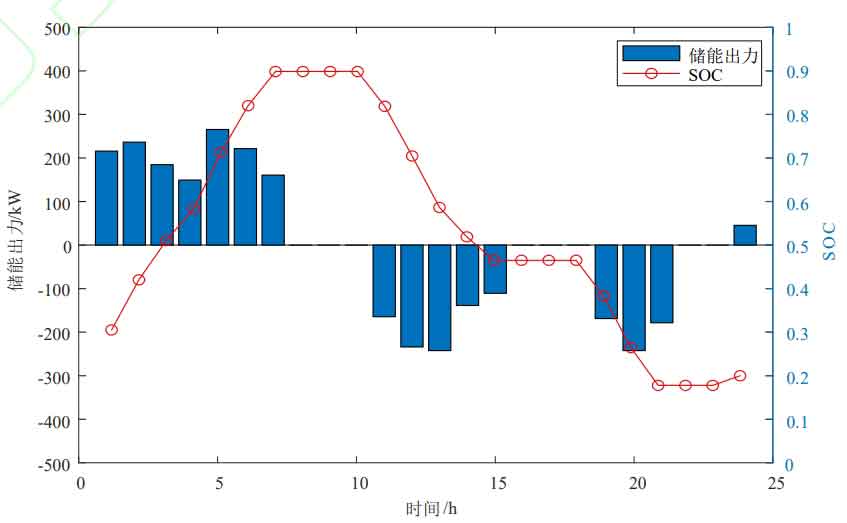
Figure 9 shows the operation of thermal power units with a wind power penetration rate of 30%. It can be seen from Figure 9 that when equipped with energy storage at a wind power penetration rate of 30%, the duck curve corresponding to the output of thermal power units is smoother than that without energy storage; Before configuring energy storage, the peak valley difference of the duck curve was 696.608MW. After configuring energy storage according to Algorithm 1, the peak valley difference of the duck curve was 616.590MW. After configuring energy storage according to Algorithm 2, the peak valley difference of the duck curve was 422.761MW. Therefore, under Algorithm 2, the output of the thermal power unit was smoother and the operating stability of the unit was higher; Compared to Algorithm 1, Algorithm 2 reduces the operating cost of thermal power units by 174600 yuan, resulting in a more significant reduction in daily output of the units. The regulation capacity of thermal power units is reduced, reducing the additional operational and oil costs brought about by deep peak shaving, resulting in better economic efficiency.
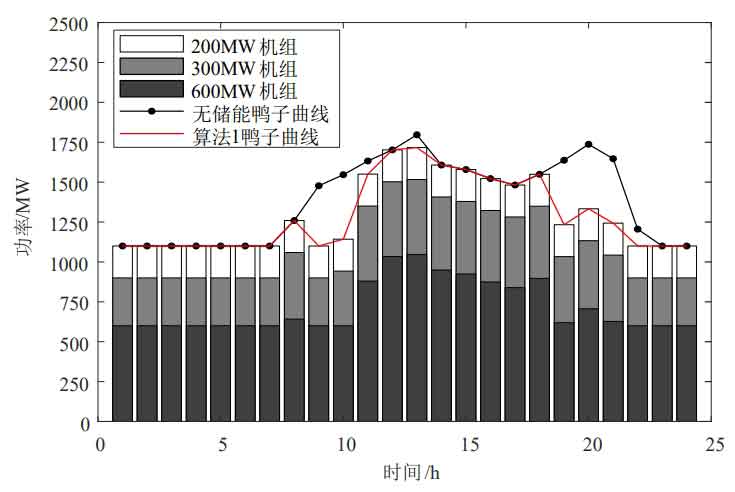
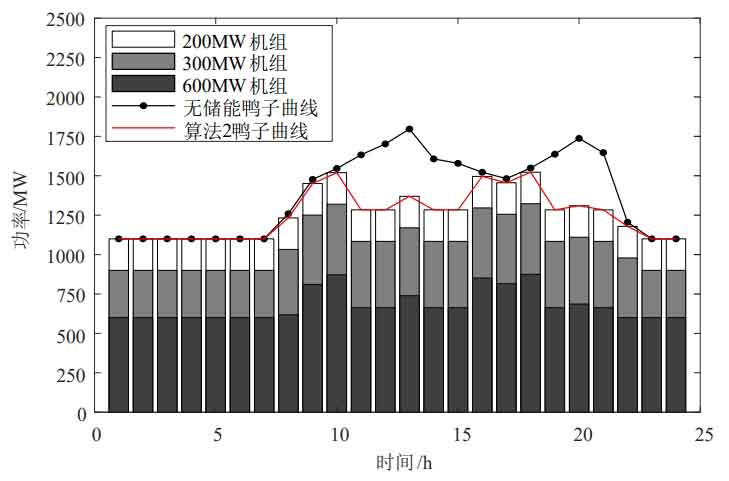
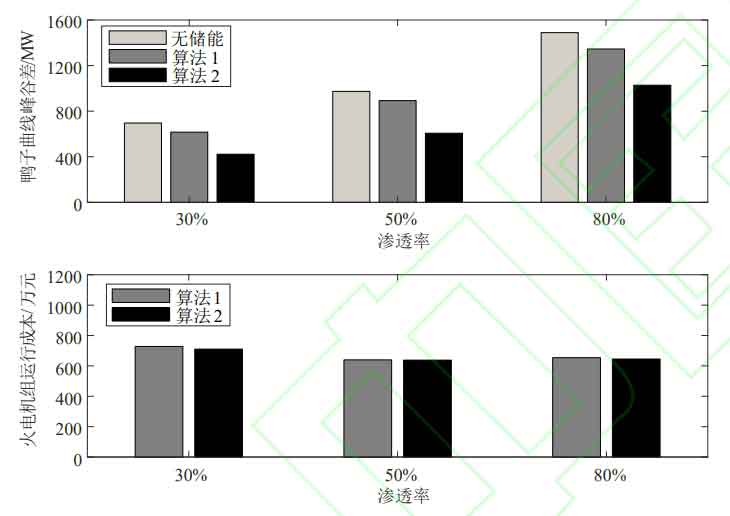
Figure 10 shows the operating costs and peak valley differences of thermal power units under different wind power permeabilities and algorithms. From Figure 10, it can be seen that under different permeabilities, the duck curve peak valley difference and thermal power unit operating cost of Algorithm 2 are lower than those of Algorithm 1; The operating cost of thermal power units does not fluctuate significantly under changes in permeability, as the addition of energy storage systems shares the peak shaving problem caused by increased permeability, verifying that energy storage can effectively alleviate the pressure on thermal power units; Under the same penetration rate, considering the optimization of time period division reduces the operating cost of thermal power units compared to only considering economic optimization. This is because the improved demand side response reduces the peak valley difference of net load. Therefore, Algorithm 2 is more optimal.
6.Conclusion
This article proposes a demand side management based optimization model for the configuration of energy storage systems to address the difficulties in peak shaving and wind abandonment of thermal power units caused by the increasing proportion of new energy. Through example analysis, the following conclusions are drawn:
(1) Compared with traditional time division, the optimal time division is based on the optimization of the net load curve, which further reduces the peak valley difference, improves the load rate, and plays a role in peak shaving and valley filling; The wind power consumption rate has also been improved, and real-time segment division has played a role in promoting wind power consumption.
(2) Compared with traditional energy storage configuration schemes, the optimization of energy storage configuration considering time period division proposed in this article has higher economic efficiency, reduces system net cost and wind abandonment rate, smoothes the “duck curve”, and the peak valley difference of thermal power unit output is lower than only considering economic optimization. The peak shaving and valley filling effect is more significant, alleviating the peak shaving pressure of the unit, and improving its safety and economy of operation.
(3) As the penetration rate of wind power continues to increase, the advantage of optimizing time slot allocation becomes more prominent. When the penetration rate is 30%, 50%, and 80%, the net cost of the system is reduced by 7.16%, 9.80%, and 13.39%, respectively. This has important practical significance for improving wind power penetration rate in the future.
Due to the increasing penetration rate of new energy in recent years, this article only focuses on optimizing energy storage configuration for specific penetration scenarios. Energy storage has a long lifespan. Therefore, reliability indicators can be added in the future to predict changes in penetration rate and configure reasonable energy storage.