
The rapid integration of renewable energy sources and the widespread adoption of electric vehicles (EVs) have necessitated the development of intelligent charging infrastructure. Photovoltaic (PV)-powered EV charging stations represent a synergistic solution, harnessing solar energy to directly power transportation. At the heart of these stations, the cell energy storage system plays a pivotal role in mitigating the intermittency of solar generation, managing demand fluctuations, stabilizing the local grid, and ensuring reliable charging services. Consequently, the performance, health, and longevity of the cell energy storage system are critical determinants of the overall station’s efficiency, economic viability, and safety. This article presents a comprehensive technical framework and evaluation methodology for cell energy storage systems within EV-PV charging stations, encompassing advanced cell modeling, state estimation, lifetime prediction, and a fuzzy logic-based holistic assessment.
1. Advanced Tandem Photovoltaic Cell Model for Enhanced Energy Harvesting
The primary energy source for the charging station is the photovoltaic array. To maximize the energy yield per unit area—a crucial factor for space-constrained charging sites—this study employs a tandem (or multi-junction) solar cell architecture. Tandem cells stack multiple p-n junction solar cells with different bandgaps, allowing for a broader and more efficient utilization of the solar spectrum. The top sub-cell absorbs high-energy photons (short wavelengths), while the bottom sub-cell captures the lower-energy photons (long wavelengths) that pass through the top cell. The open-circuit voltage (V_OC) of a tandem device is approximately the sum of the V_OC of its sub-cells. However, the overall current is limited by the sub-cell generating the smallest photocurrent; therefore, current matching is essential to minimize losses.
The modeled tandem structure is built upon a foundational single-junction cell based on Sb2(S,Se)3 as the absorber material. The composition of this material, defined by the Se/(S+Se) ratio, allows for tunable optoelectronic properties, particularly the bandgap (E_g). The structure of a single cell is as follows:
- Transparent Conducting Oxide Layer (TCOL): Fluorine-doped Tin Oxide (FTO).
- Electron Transport Layer (ETL): Cadmium Sulfide (CdS).
- Absorber Layer (AL): Tunable Sb2(S1-x,Sex)3.
- Hole Transport Layer (HTL).
- Metal Electrode: Gold (Au).
The absorption coefficient α(λ, x) of the Sb2(S1-x,Sex)3 layer is a key parameter that varies with the selenium fraction (x) and photon wavelength (λ). It can be empirically described for different compositions, influencing the photon harvesting capability. The bandgap E_g(x) exhibits a near-linear relationship with the composition x:
$$E_g(x) \approx E_g(Sb_2S_3) – [E_g(Sb_2S_3) – E_g(Sb_2Se_3)] \cdot x$$
where E_g(Sb2S3) ≈ 1.7 eV and E_g(Sb2Se3) ≈ 1.2 eV.
In the tandem configuration, the top cell is illuminated under the standard AM1.5G spectrum. The light transmitted to the bottom cell is filtered by the top cell’s layers. The spectral transmittance T(λ) to the bottom sub-cell is given by:
$$T(\lambda) = T_0(\lambda) \cdot \exp\left(-\sum_{k=1}^{n} \alpha_k(\lambda) \cdot t_k\right)$$
where T_0(λ) is the incident AM1.5G spectral irradiance, n is the number of layers in the top cell (TCOL, ETL, AL, HTL), and α_k and t_k are the absorption coefficient and thickness of the k-th layer, respectively. By carefully selecting the bandgap (via Se ratio) and thickness of the absorber layers in both top and bottom sub-cells, their photocurrents can be matched, optimizing the tandem cell’s power conversion efficiency for the charging station’s energy input.
2. Performance Assessment and Prognostics for the Cell Energy Storage System
The cell energy storage system, typically composed of lithium-ion battery packs, requires continuous monitoring and assessment of three core states: State of Charge (SOC), State of Health (SOH), and the prediction of Remaining Useful Life (RUL).
2.1 State of Charge (SOC) Estimation
SOC indicates the available capacity relative to the maximum. While simple coulomb counting (current integration) is common, it drifts due to unaccounted losses and aging. This work employs a Kalman Filter (KF) based approach for robust, closed-loop SOC estimation. The SOC definition is:
$$SOC(t) = \frac{Q_{remain}(t)}{Q_{rated}} \times 100\%$$
where Q_remain(t) is the remaining capacity and Q_rated is the nominal capacity. The KF uses a cell model (e.g., equivalent circuit model) and iteratively corrects the SOC estimate by minimizing the error between the model’s predicted voltage and the measured terminal voltage. This method inherently compensates for measurement noise and model inaccuracies. Temperature (T) significantly impacts capacity; the daily capacity loss L_cal at different SOC and T levels must be characterized for accurate calibration within the estimation algorithm.
2.2 State of Health (SOH) Estimation
SOH quantifies the battery’s degradation compared to its fresh state, often defined by capacity fade:
$$SOH_C(t) = \frac{C(t) – C_{EOL}}{C_{BOL} – C_{EOL}} \times 100\%$$
Here, C(t) is the actual maximum available capacity at time t, C_BOL is the beginning-of-life capacity, and C_EOL is the capacity at end-of-life (e.g., 80% of C_BOL). This study utilizes a voltage curve fitting method during constant-current charging phases. As the battery degrades, its charge voltage profile shifts. Features such as the voltage rise for a fixed capacity increment or the time/charge required to reach a specific voltage point are extracted. A machine learning model (e.g., regression) maps these features to the SOH. Degradation arises from two mechanisms:
- Cycle Aging: Loss due to repeated charge-discharge cycles, dependent on depth-of-discharge (DOD), rate (C-rate), and temperature.
- Calendar Aging: Loss due to storage, primarily driven by time, temperature, and SOC during storage.
The total SOH decay is a superposition of these effects, often leading to faster degradation in summer due to elevated temperatures.
2.3 Remaining Useful Life (RUL) Prediction
RUL forecasting is a long-term prediction essential for maintenance and replacement planning. A data-driven approach is adopted, leveraging historical operational data (cycles, C-rates, temperatures, estimated SOH trajectories) to train a prognostic model. This model, such as a Long Short-Term Memory (LSTM) recurrent neural network, learns the complex, non-linear degradation patterns from a fleet of similar cells. It takes sequences of stress factors and SOH values as input and outputs a probability distribution for the RUL, defined as the number of future cycles or days until SOH reaches the EOL threshold.
2.4 Integrated Online Monitoring and Safety Framework
For a reliable cell energy storage system, online monitoring is non-negotiable. A dedicated Battery Monitoring Module (BMM) is deployed for each cell or module. It measures voltage, temperature, and sometimes current. Data is transmitted to a central Battery Management System (BMS). The BMS executes the state estimation algorithms (SOC, SOH) and runs the RUL prediction models. A critical function is safety protection: if any parameter (voltage, temperature, current) exceeds safe thresholds, or if the prognostic model indicates imminent failure risk, the BMS can trigger alarms, limit power, or disconnect the cell energy storage system. This big-data-driven closed-loop system enables condition-based maintenance, preventing catastrophic failures and optimizing system use.
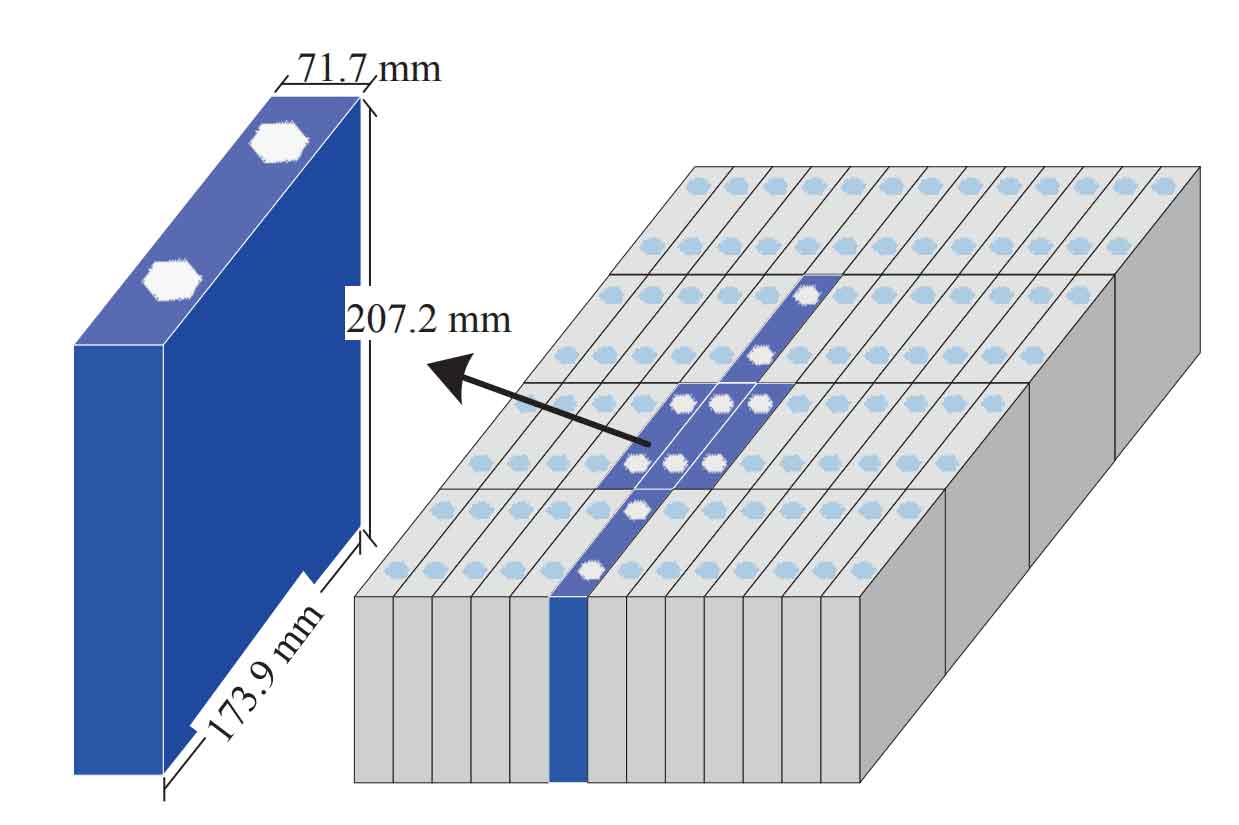
The figure above illustrates the physical realization of a cell energy storage system, showing individual lithium iron phosphate (LiFePO4) cells and their integration into a larger battery pack or module. This modular construction is fundamental for the scalability and manageability of the cell energy storage system in EV charging stations, though it also introduces complexities in balancing and monitoring that the BMS must address.
3. Holistic Risk Assessment Using Fuzzy Logic Evaluation
To move beyond individual metrics and assess the overall condition and risk profile of the cell energy storage system, a fuzzy logic-based comprehensive evaluation method is proposed. Fuzzy logic handles the imprecision and subjectivity inherent in risk assessment by converting linguistic terms into quantitative measures.
3.1 Defining Linguistic Variables and Rules
First, key risk factors (inputs) and the overall system status (output) are defined linguistically. For an EV-PV charging station cell energy storage system, critical risk factors are identified as shown in Table 1.
| Risk Factor Code | Risk Factor Description | Linguistic Terms (Low, Medium, High) |
|---|---|---|
| X1 | State of Health (SOH) Level | Degradation Level |
| X2 | State of Charge (SOC) Imbalance | Imbalance Severity |
| X3 | Temperature Gradient | Thermal Non-uniformity |
| X4 | Aging Rate (from RUL model) | Aging Acceleration |
| X5 | Historical Fault Frequency | Fault Proneness |
| X6 | Control System Communication Health | Communication Reliability |
Each input is assigned membership functions (e.g., Triangular or Trapezoidal) that map a crisp value (e.g., SOH=85%) to a degree of membership (e.g., 0.7 in “Medium”, 0.3 in “High”). Similarly, the output “Overall System Risk” has terms like {Low, Moderate, High, Critical}.
Fuzzy rules are then established by expert knowledge. These are “IF-THEN” statements, e.g.:
Rule R_u: IF (X1 is Medium) AND (X2 is High) AND (X4 is High) THEN (Overall Risk is Critical).
A set of such rules (u = 1 to M) forms the rule base.
3.2 Fuzzy Inference and Defuzzification
For a given set of measured inputs (x1, x2, …, x6), the fuzzy inference process is as follows:
- Fuzzification: Convert each crisp input x_i to membership degrees for its linguistic terms.
- Rule Evaluation: For each rule R_u, determine its firing strength w_u, typically using the MIN (AND) operator on the antecedent membership degrees. For rule R_u with antecedents A_{u1}, A_{u2}, …:
$$w_u = \min(\mu_{A_{u1}}(x_1), \mu_{A_{u2}}(x_2), …)$$ - Implication & Aggregation: Apply the firing strength to the rule’s consequent (output fuzzy set), often using the MIN operator. Aggregate the output from all rules into a single composite output fuzzy set.
- Defuzzification: Convert the aggregated output fuzzy set into a crisp “Overall Risk Score” (e.g., on a scale of 0-100). The Centroid method is commonly used:
$$Risk\_Score = \frac{\int \mu_{output}(z) \cdot z \, dz}{\int \mu_{output}(z) \, dz}$$
where z is the output variable and μ_output(z) is its aggregated membership function.
3.3 Weighted Rule Evaluation for Refined Assessment
Not all rules are equally important. A refined method assigns an importance weight I(R_u) to each rule based on expert judgment. Furthermore, the consistency between rules can be evaluated. The similarity S(R_u, R_v) between two fuzzy rules can be calculated based on their antecedent structures. The weighted agreement for rule R_u is:
$$WA(R_u) = \frac{\sum_{v=1, v\neq u}^{M} I(R_v) \cdot S(R_u, R_v)}{\sum_{v=1, v\neq u}^{M} I(R_v)}$$
The final weight for each rule, combining its importance and agreement with other rules, is given by the Consistency Coefficient CC:
$$CC(R_u) = \beta \cdot I(R_u) + (1-\beta) \cdot \frac{WA(R_u)}{\sum_{n=1}^{M} WA(R_n)}$$
Here, β ∈ [0,1] is a factor balancing the importance of expert-assigned weight (I) versus peer agreement (WA). The final aggregated output is then computed using these CC(R_u) as the rule weights during implication and aggregation, providing a more nuanced risk assessment.
3.4 Application and Risk Prioritization
Applying this fuzzy evaluation methodology to operational data from a cell energy storage system allows for continuous risk scoring. The analysis consistently identifies factors like high aging rate (X4) and significant cell imbalance (X2) as primary contributors to a high overall risk score. This quantifies the intuitive understanding that battery aging is a dominant risk, informing maintenance schedules—such as proactive cell balancing or preemptive replacement of degrading modules—thereby enhancing the safety and reliability of the entire EV-PV charging station. The fuzzy output can be categorized to trigger specific actions: e.g., “Moderate Risk” might trigger increased logging frequency, while “Critical Risk” could initiate an orderly shutdown and alert maintenance crews.
4. Conclusion
The effective operation of an electric vehicle photovoltaic charging station is intrinsically linked to the performance and management of its integrated cell energy storage system. This article has presented a multifaceted technical framework for such systems. It began with an advanced tandem solar cell model to optimize energy harvesting, providing a robust foundation for the station’s power supply. The core of the framework focuses on the cell energy storage system itself, detailing sophisticated algorithms for real-time State of Charge and State of Health estimation, coupled with data-driven models for Remaining Useful Life prediction. These form a comprehensive prognostics and health management suite. Finally, to synthesize these discrete metrics into an actionable overview, a fuzzy logic-based holistic evaluation method was proposed. This method translates quantitative battery data and qualitative risk factors into a clear, prioritized assessment of system-wide risk, with particular sensitivity to aging-related failures. The integration of these components—from energy generation and storage modeling to state estimation and systemic risk evaluation—provides a powerful, closed-loop methodology for designing, monitoring, and maintaining reliable, efficient, and safe EV-PV charging infrastructure. Future work will focus on the real-time implementation of this framework and the fusion of prognostic data with grid interaction algorithms for optimal energy dispatch.