
Our research focuses on the thermal management of lithium‑ion battery compartments in energy storage power stations, particularly those located in the northwest region of China. During operation, heat generated by batteries and auxiliary equipment accounts for a significant portion of energy loss, while solar radiation further increases the thermal load in summer. To maintain safe operating temperatures, cooling systems consume substantial amounts of stored electricity. Our analysis reveals that the combined losses from heat generation and cooling energy can reach 8.4% of the charged electricity, severely impacting charging‑discharging efficiency. We propose two retrofit solutions: installing reflective panels or photovoltaic (solar) panels on top of the battery compartment. This paper systematically compares the effectiveness of these two approaches in reducing solar heat gain and lowering or offsetting cooling energy consumption. Detailed calculations, economic assessments, and multiple tables and formulas are presented to support our findings.
1. Heat Sources and Cooling Demand in a Battery Compartment
We consider a typical 2.5 MW/5 MWh battery compartment deployed in Shache County, Xinjiang. The compartment contains 14 battery clusters, each with 25 modules, each module comprising 16 cells – a total of 5,600 cells. A daily one‑charge‑one‑discharge cycle is adopted (12:00–14:00 charging, 19:00–21:00 discharging), operating 300 days per year. Two air‑conditioning units provide cooling, each rated at 20 kW cooling capacity and 10 kW input power, with a set‑point temperature of 18 °C.
1.1 Solar Radiation Heat Gain
The average daily solar radiation in Shache during summer is about 8.0 kWh/m², with peak hourly intensity around 1.0 kWh/(m²·h). The battery compartment is a standard 40‑foot container (12.2 m × 2.4 m × 2.6 m). For simplicity, we consider only the top surface area (12.2 m × 2.4 m = 29.28 m²). With a white‑painted roof having a solar absorption coefficient of 25%, the daily solar heat absorbed is:
$$Q_{\text{solar, daily}} = 8.0 \times 29.28 \times 0.25 = 58.56\,\text{kWh}$$
The peak hourly solar heat gain power is:
$$P_{\text{solar, peak}} = 1.0 \times 29.28 \times 0.25 = 7.32\,\text{kW}$$
1.2 Battery and Auxiliary Equipment Heat Generation
We assume each cell generates 9 W of heat during both charging and discharging, and negligible heat during idle periods. Over a daily cycle (2 h charging + 2 h discharging = 4 h), the total battery heat is:
$$Q_{\text{battery, daily}} = 5600 \times 9 \times 4 / 1000 = 201.6\,\text{kWh}$$
The peak battery heat power during charging/discharging is:
$$P_{\text{battery, peak}} = 5600 \times 9 / 1000 = 50.4\,\text{kW}$$
Auxiliary equipment (cables, fans, BMS, etc.) contributes heat: 6.0 kW during charging/discharging, 3 kW when fans continue running after the cycle, and 1 kW at other times. Summing up, the daily auxiliary heat is about 52.0 kWh.
During the summer charging period (12:00–14:00), the total heat source power reaches:
$$P_{\text{total, peak}} = P_{\text{battery}} + P_{\text{aux}} + P_{\text{solar}} = 50.4 + 6.0 + 7.32 = 63.72\,\text{kW}$$
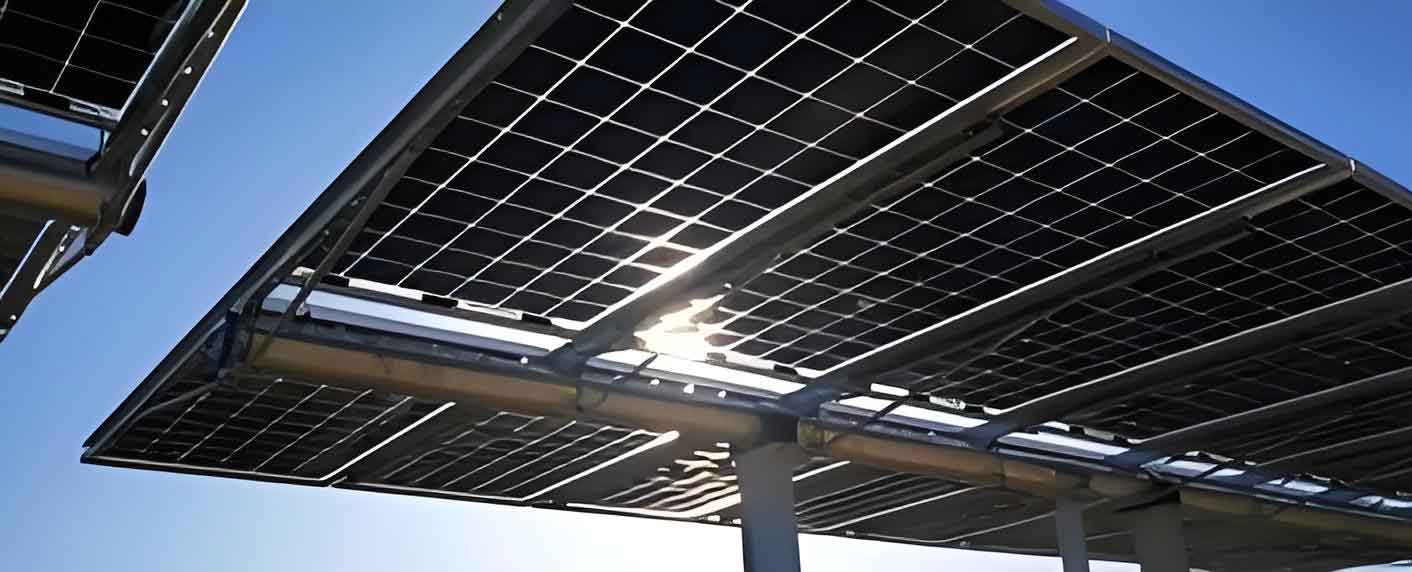
The figure above illustrates a typical bifacial solar panel that we consider for our study. Detailed specifications are discussed in Section 3.
1.3 Cooling Energy Consumption
The required cooling capacity is obtained from the heat balance:
$$P_c = P_b + P_a + P_s – P_d – \frac{Q_{\text{stored}}}{t}$$
where:
- \(P_c\) – required cooling capacity (kW)
- \(P_b\) – battery heat generation power (kW)
- \(P_a\) – auxiliary equipment heat power (kW)
- \(P_s\) – solar radiation heat gain power (kW)
- \(P_d\) – heat transfer to the environment (negligible, ~0)
- \(Q_{\text{stored}} = c m \Delta T\) – heat stored as battery temperature rise; \(c\) is specific heat, \(m\) is mass, \(\Delta T\) is permissible temperature rise (taken as 8 °C)
The cooling power consumption is:
$$E_c = \frac{P_c}{\text{COP}}$$
where COP (Coefficient of Performance) depends on ambient temperature and set‑point; in summer noon, COP ≈ 1.6.
From our calculations, the peak cooling demand during summer charging is 38.1 kW, requiring an electrical input of 23.9 kW (since 38.1 / 1.6 ≈ 23.8). The existing two AC units together provide only 40 kW cooling and 20 kW input power, which is insufficient – leading to overtemperature alarms and forced power reduction.
Table 1 summarizes the daily heat balance and cooling energy consumption under original (baseline) conditions.
| Component | Daily Heat (kWh) | Peak Power (kW) |
|---|---|---|
| Battery heat | 201.6 | 50.4 |
| Auxiliary equipment heat | 52.0 | 6.0 |
| Solar radiation heat | 58.6 | 7.3 |
| Total heat input | 312.2 | 63.7 |
| Heat stored in battery (ΔT=8 °C) | — | ~25.6 kW during charging |
| Required cooling (peak) | — | 38.1 kW |
| Cooling electricity consumption (peak) | — | 23.9 kW |
| Total daily cooling electricity | 166.2 kWh | — |
Overall, the battery compartment consumes 253.6 kWh/day due to heat losses (@5.1% of charged electricity) and 166.2 kWh/day for cooling (@3.3%), together accounting for 8.4% of the daily charge (5,000 kWh). This severely reduces the round‑trip efficiency.
2. Adding Reflective Panels
2.1 Reduction in Solar Heat Gain
By placing highly reflective panels (made of PMMA with mirror coating or polished aluminum) on the compartment roof, the solar absorption coefficient drops from 25% to about 5%, and only a small fraction (≈2%) of absorbed heat is conducted into the container. Thus, the daily solar heat absorption becomes:
$$Q_{\text{solar, ref}} = 8.0 \times 29.28 \times 0.05 = 11.71\,\text{kWh}$$
However, because the reflective panel is not directly bonded but spaced, the effective heat conducted into the compartment is even lower – we conservatively take 2% of the absorbed heat, i.e., about 0.23 kWh/day. The peak hourly solar heat gain power is only:
$$P_{\text{solar, ref, peak}} = 1.0 \times 29.28 \times 0.02 = 0.59\,\text{kW}$$
Effectively, the reflective panel reduces summer solar heat gain by nearly 99% compared to the original roof.
2.2 Cooling Energy Saving
With dramatically lower solar load, the peak cooling capacity requirement during summer charging drops to about 31.3 kW (down from 38.1 kW). The air‑conditioning units (40 kW total) now easily meet the demand. Furthermore, the cooling electricity consumption decreases accordingly. Table 2 compares key parameters after adding reflective panels.
| Parameter | Baseline | With Reflective Panel |
|---|---|---|
| Peak cooling capacity needed (kW) | 38.1 | 31.0 |
| Peak cooling electricity consumption (kW) | 23.9 | 19.4 |
| Daily cooling electricity (kWh) | 166.2 | 130.6 |
| AC operating hours per day (h) | 16 | 8 |
| Percentage of charge used for cooling | 3.3% | 2.6% |
The reduction in daily cooling electricity is 35.6 kWh. Over a summer season of 100 equivalent days (taking into account the seasonal variation), the annual saving is:
$$\Delta E_{\text{cool, ref}} = 35.6 \times 100 = 3560\,\text{kWh}$$
At an electricity price of 0.25 CNY/kWh, the annual monetary saving is 890 CNY.
2.3 Economic Assessment of Reflective Panels
The reflective panels are made of 2 mm PMMA, costing about 150 CNY/m², weight 2.38 kg/m². Total roof area 29.28 m² gives a material cost of 4,392 CNY. Installation is simple and no extra support structure is needed. The static payback period is:
$$\text{Payback}_{\text{ref}} = \frac{4392}{890} \approx 4.9\,\text{years}$$
Additional benefits include reduced AC runtime (lower failure rate), less risk of overtemperature, and prolonged battery life. Table 3 provides a summary.
| Item | Value |
|---|---|
| Panel area (m²) | 29.28 |
| Unit cost (CNY/m²) | 150 |
| Total investment (CNY) | 4,392 |
| Annual cooling electricity saving (kWh) | 3,560 |
| Annual revenue from saving (CNY) | 890 |
| Payback period (years) | 4.9 |
3. Adding Photovoltaic (Solar) Panels
Installing photovoltaic (PV) panels on the battery compartment roof serves a dual purpose: reducing solar heat gain and generating electricity that can offset part of the cooling load. We selected N‑type TOPCon modules with dimensions 2382 mm × 1134 mm, efficiency ≈22‑23%, power ≈630 W, and unit price ~0.75 CNY/W. Eight modules are arranged along the length of the container with a spacing of 1.6 m, tilted at 33° to maximize annual yield. Total installed capacity: 8 × 630 W = 5.04 kW.
With the PV panels covering the roof, the solar absorption of the compartment roof itself drops to about 5% (since most radiation is intercepted by the panels). The effective daily solar heat absorbed by the container is:
$$Q_{\text{solar, PV}} = 8.0 \times 29.28 \times 0.05 = 11.71\,\text{kWh}$$
But because the PV panels are mounted with a gap for ventilation, only about 2% of the absorbed heat is actually transferred to the compartment. Thus the net solar heat gain is slightly higher than with reflective panels but still dramatically lower than baseline: ~0.23 kWh/day. The peak solar heat gain power is about 1.5 kW (some direct radiation reaches the roof between modules).
3.1 Cooling Energy Reduction and Power Generation
The daily cooling electricity consumption after installing PV panels is reduced to 136.2 kWh (saving 30.0 kWh per summer day). Over 100 equivalent summer days, the annual cooling saving is 3,000 kWh, worth 750 CNY at 0.25 CNY/kWh.
Additionally, the PV panels generate electricity. The site (Shache) has an equivalent full‑load hours of about 1,600 h per year (slightly better than the ground‑mounted PV due to better airflow and tilt). Annual generation:
$$E_{\text{PV, annual}} = 5.04 \times 1600 = 8,064\,\text{kWh}$$
This electricity can be stored in the battery (since the storage station absorbs daytime generation) and used to offset cooling power or sold back to the grid. At the same electricity price, the annual revenue from generation is:
$$\text{Revenue}_{\text{PV}} = 8064 \times 0.25 = 2,016\,\text{CNY}$$
3.2 Economic Analysis of PV Panels
The total investment includes module cost (5.04 kW × 0.75 CNY/W = 3,780 CNY) plus design, installation, and balance‑of‑system costs estimated at 3 times module cost (11,340 CNY). Total investment ≈ 15,120 CNY. The annual income from both cooling saving (750 CNY) and PV generation (2,016 CNY) totals 2,766 CNY. Static payback period:
$$\text{Payback}_{\text{PV}} = \frac{15120}{2766} \approx 5.5\,\text{years}$$
Table 4 summarizes all economic parameters.
| Item | Value |
|---|---|
| PV module capacity (kW) | 5.04 |
| Module cost (CNY) | 3,780 |
| Balance‑of‑system cost (CNY) | 11,340 |
| Total investment (CNY) | 15,120 |
| Annual cooling saving (kWh) | 3,000 |
| Annual cooling saving revenue (CNY) | 750 |
| Annual PV generation (kWh) | 8,064 |
| Annual generation revenue (CNY) | 2,016 |
| Total annual revenue (CNY) | 2,766 |
| Payback period (years) | 5.5 |
4. Comparative Discussion
Both reflective panels and solar panels significantly reduce cooling energy consumption and improve the charging‑discharging efficiency of the energy storage station. The reflective panel has a lower initial investment (4,392 CNY) and a shorter payback period (4.9 years), but it provides no additional electricity generation. The solar panel requires about 3.4 times the investment but generates revenue from electricity sales, leading to a slightly longer payback (5.5 years). However, the solar panel also extends the AC unit’s lifespan by reducing operation hours and provides a hedge against rising electricity prices.
Table 5 provides a direct side‑by‑side comparison of key performance indicators.
| Indicator | Reflective Panel | Photovoltaic Panel |
|---|---|---|
| Investment (CNY) | 4,392 | 15,120 |
| Annual cooling saving (kWh) | 3,560 | 3,000 |
| Annual PV generation (kWh) | — | 8,064 |
| Total annual revenue (CNY) | 890 | 2,766 |
| Payback period (years) | 4.9 | 5.5 |
| Efficiency improvement (percentage points) | +0.7 | +0.6 |
| AC runtime reduction (h/day) | 8 h → off | 8 h → off (but extra 3 h low‑load due to partial shading) |
It is worth noting that the price of solar panels has dropped dramatically in recent years; if the module price falls further below 0.70 CNY/W, the payback for the PV solution could become comparable or even better than the reflective alternative. Additionally, the generated solar electricity can be counted as renewable energy credits in some regions, adding extra incentive.
5. Conclusion
Our investigation demonstrates that both retrofitting options effectively mitigate solar heat load on battery compartments of energy storage stations. Installing reflective panels can save 3,560 kWh of cooling electricity per year per compartment, with a payback time of approximately 4.9 years. Mounting photovoltaic panels yields an annual cooling saving of 3,000 kWh plus 8,064 kWh of clean generation, leading to a payback period of about 5.5 years. Both measures improve the overall charging‑discharging efficiency by 0.6–0.7 percentage points and reduce stress on air‑conditioning equipment. Considering the ancillary benefits of extending battery life, lowering failure risks, and supporting renewable energy integration, these technologies are highly recommended for widespread adoption in the energy storage industry.