
The rapid evolution of the new energy vehicle industry has positioned lithium iron phosphate (LiFePO4) batteries as a cornerstone technology, prized for their inherent safety, long cycle life, and favorable cost structure. However, the performance and longevity of battery packs are critically dependent on the consistency of individual cells. Self-discharge, a phenomenon where a battery loses its stored charge while idle, is a key factor undermining this consistency. Elevated self-discharge in a single cell within a series-connected pack can lead to capacity imbalance, accelerated degradation, and potential safety risks during charging. Consequently, developing efficient and reliable screening processes to identify cells with abnormal self-discharge rates is paramount in high-quality battery manufacturing.
Traditional screening methods involve aging batteries at a specific state of charge (SOC) under controlled temperature, followed by measuring the open-circuit voltage (OCV) drop over time. A common quantitative metric is the K-value, defined as the rate of voltage drop per unit time. This study systematically investigates and compares two distinct post-formation aging protocols for large-format, high-capacity LiFePO4 batteries: one employing standard room-temperature aging and another incorporating a high-temperature aging step. The core objective is to evaluate their efficacy in accelerating the stabilization process and, more importantly, in effectively identifying cells with high self-discharge.
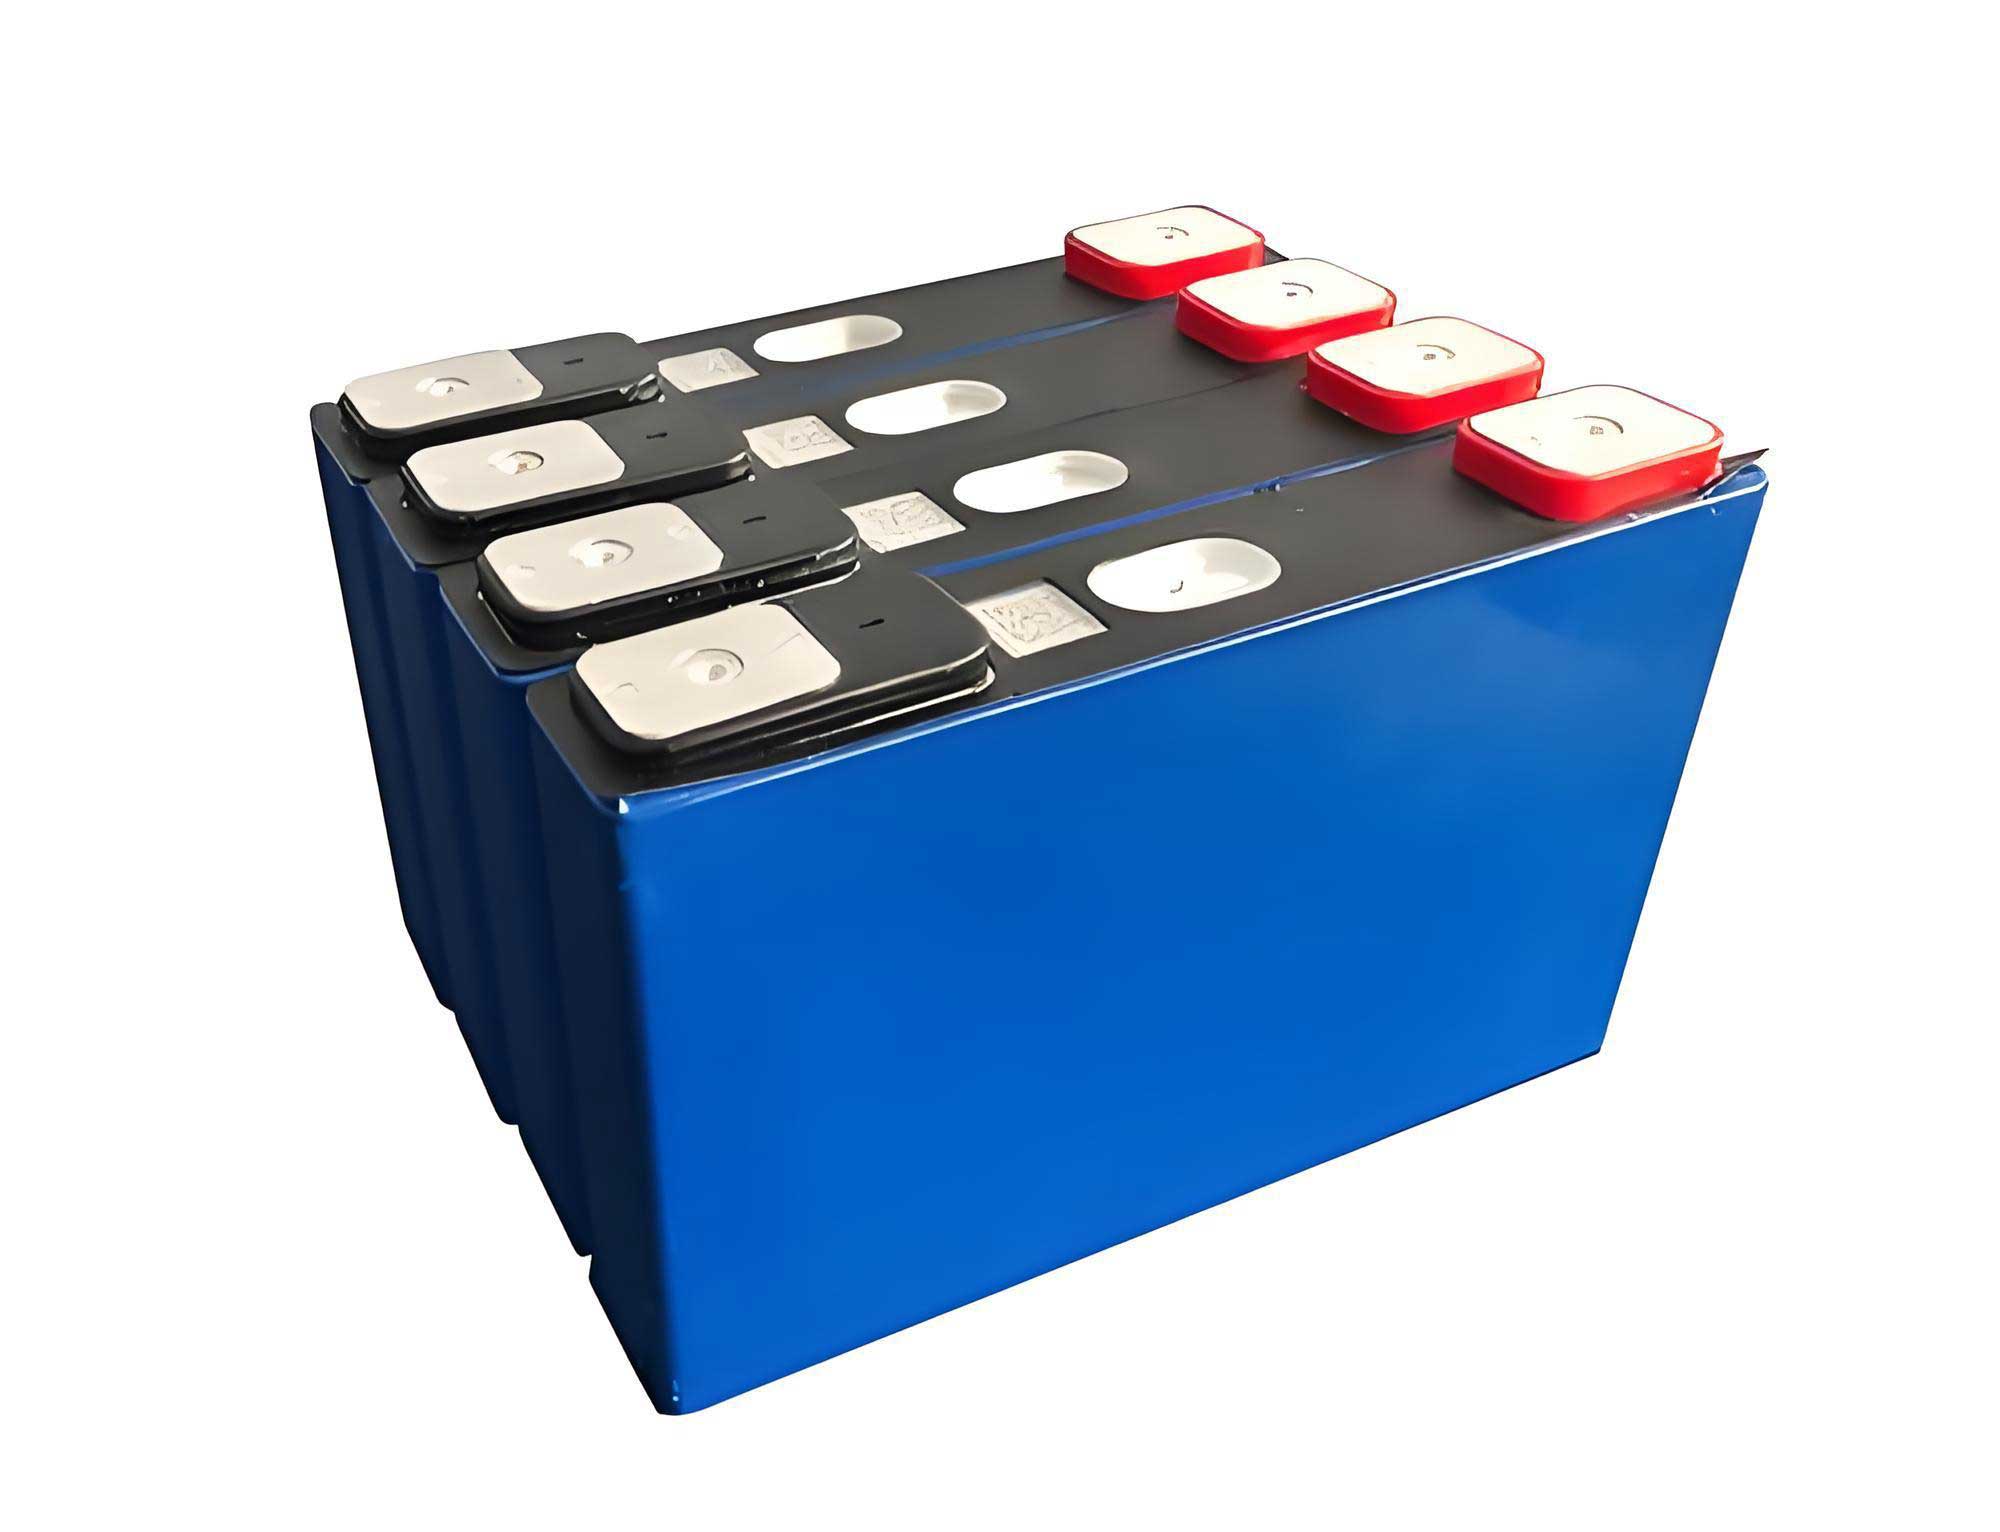
Theoretical Framework for Self-Discharge and K-Value Screening
Self-discharge in a LiFePO4 battery is a complex process driven by internal parasitic reactions. These can include electrolyte decomposition at the electrodes, slow dissolution of active materials, and electronic short circuits caused by micro-dendrites or contaminant bridges. The rate of these reactions is influenced by both internal factors (e.g., electrode material purity, electrolyte formulation, separator integrity) and external conditions, primarily temperature and SOC.
A higher temperature provides the activation energy for many parasitic reactions, thereby accelerating self-discharge. This principle is leveraged in screening processes to “accelerate” the manifestation of inherent defects within a shorter timeframe. Similarly, the SOC, representing the chemical potential of the electrodes, influences reaction kinetics; typically, higher SOC correlates with a greater driving force for certain degradation pathways.
The K-value method provides a practical, non-destructive metric for comparing self-discharge rates. Since the OCV of a lithium-ion battery has a well-defined, though relatively flat for LiFePO4, relationship with its SOC, a measurable voltage drop over time directly correlates to charge loss. The K-value is calculated as:
$$ K = \frac{\Delta V}{\Delta T} = \frac{V_{i} – V_{f}}{t_{f} – t_{i}} $$
where \( V_{i} \) and \( V_{f} \) are the initial and final open-circuit voltages measured at times \( t_{i} \) and \( t_{f} \), respectively. The unit is typically mV/day. For a population of batteries, the distribution of K-values is analyzed. Cells with K-values statistically far from the population mean are considered outliers with abnormally high self-discharge. A standard statistical method for outlier detection is the “3σ criterion,” where any data point lying outside three standard deviations from the mean is flagged. The threshold is defined as:
$$ K_{threshold} = \mu_{K} + 3\sigma_{K} $$
Here, \( \mu_{K} \) is the sample mean of the K-values, and \( \sigma_{K} \) is the sample standard deviation, calculated after removing any obvious voltage measurement anomalies. This method forms the statistical backbone of the screening process discussed in this work for LiFePO4 batteries.
Experimental Design and Cell Preparation
For this comparative study, large-capacity prismatic wound cells were fabricated. The cathode was composed of LiFePO4 as the active material, coated onto an aluminum foil current collector. The anode utilized artificial graphite coated on a copper foil. A polypropylene (PP) based separator was used. The cells were assembled, dried, filled with electrolyte, and sealed to yield a nominal capacity of 202 Ah, with an operational voltage window of 2.5 V to 3.65 V.
The core of the experiment involved subjecting cells from the same production batch to two different post-formation aging and screening protocols, designated as Process A (Room-Temperature Focused) and Process B (High-Temperature Accelerated). The detailed steps are outlined in the table below.
| Process Step | Process A (Control) | Process B (Experimental) |
|---|---|---|
| 1. Formation | 0.33C Constant Current/Constant Voltage (CC/CV) charge to 3.65 V. | |
| 2. High-SOC Aging | Aging at 100% SOC, 25°C for 10 days. | Aging at 100% SOC, 45°C for 3 days, then at 25°C for 4 days (7 days total). |
| 3. Conditioning | CC/CV charge to 3.65 V, discharge to 2.5 V, then charge to 30% SOC. | |
| 4. Low-SOC Screening | Aging at 30% SOC, 25°C for 10 days. OCV monitored daily. K-value calculated. | Aging at 30% SOC, 25°C for 10 days. OCV monitored daily. K-value calculated. |
| 5. Long-Term Validation | OCV monitored after 30 total days at 30% SOC to verify screening results. | |
Voltage measurements were taken using a high-precision digital multimeter. The K-value for the primary screening was calculated after the 10-day aging period at 30% SOC (\( K_{10} \)). A final validation K-value was calculated after 30 days (\( K_{30} \)). The “3σ criterion” was applied to both \( K_{10} \) and \( K_{30} \) distributions to identify self-discharge outliers for each LiFePO4 battery group.
Results and Analysis: High-SOC Aging Phase
The initial aging phase at 100% SOC served as a stabilization period. Analysis of the voltage data revealed distinct behaviors between the two processes.
Voltage Consistency: After the complete high-SOC aging period, the voltage spread (max-min) for Process A (25°C for 10 days) was 17.56 mV. In contrast, Process B (3 days at 45°C + 4 days at 25°C) achieved a significantly tighter voltage spread of 10.98 mV. This demonstrates that the high-temperature step promotes more uniform electrode passivation and stabilization across the population of LiFePO4 batteries, leading to improved initial voltage consistency.
Voltage Drop and Implied K-Value: The average total voltage drop during the high-SOC phase provides insight into the acceleration factor. The data is summarized below:
| Metric | Process A (10 days at 25°C) | Process B (3 days at 45°C) |
|---|---|---|
| Total Avg. Voltage Drop | 12.93 mV | 15.86 mV |
| Avg. Drop per Day | ≈ 1.29 mV/day | ≈ 5.29 mV/day (during 45°C period) |
| Effective Acceleration Factor | 1x (Baseline) | ≈ 4.1x (5.29 / 1.29) |
This calculation confirms that aging the LiFePO4 battery at 45°C accelerates the voltage decay process by approximately a factor of four compared to room temperature. Therefore, one day of high-temperature aging is roughly equivalent to four days of room-temperature aging in terms of induced voltage change at full charge.
K-Value Distribution at High SOC: Despite the measurable voltage drops, the calculated daily K-values during the 100% SOC phase were highly scattered for both groups. The distribution showed no clear statistical separation between normal and potentially faulty cells. This can be attributed to the steep voltage-SOC curve of the LiFePO4 battery at very high SOC, where small, non-uniform charge losses due to initial stabilization processes can cause disproportionately variable voltage drops. This makes the K-value an unreliable screening metric at this specific condition. The key benefit of high-temperature aging here is accelerated stabilization, not screening.
Results and Analysis: Low-SOC Screening Phase
The critical screening occurred during the 30% SOC aging at 25°C. The voltage-SOC curve for a LiFePO4 battery is much steeper in this mid-to-low range, meaning a given charge loss produces a more pronounced and consistent voltage drop, making the K-value a sensitive screening tool.
Voltage and K-Value Evolution: Both groups exhibited a rapid voltage drop in the first three days, which gradually plateaued. The average K-value for Process A over the 10-day period was higher than for Process B. This suggests that cells from the room-temperature-focused Process A retained a slightly less stable state, leading to a faster initial voltage decay at 30% SOC compared to the pre-stabilized cells from the high-temperature Process B.
Screening Efficacy (10-Day Data): After 10 days at 30% SOC, the K-value (\( K_{10} \)) was calculated for every LiFePO4 battery. Applying the “3σ criterion” to the distributions yielded the following screening results:
| Process | Population Size | Cells Flagged by \( K_{10} \) > μ+3σ | Screening Rate |
|---|---|---|---|
| Process A | ~180 | 6 | 3.3% |
| Process B | ~165 | 6 | 3.6% |
The key finding is that both processes identified an almost identical number of outlier cells, and the screening rates were statistically equivalent. This confirms that the high-temperature acceleration step in Process B did not create false positives or miss inherent defects; it effectively preserved the fundamental self-discharge characteristics of the LiFePO4 battery while speeding up the preceding stabilization.
Validation of Screening Results (30-Day Data): To verify the accuracy and avoid “missed detections,” the OCV was monitored for a total of 30 days at 30% SOC. The final K-value (\( K_{30} \)) was recalculated. The application of the “3σ criterion” on this extended dataset identified the exact same set of 6 outlier cells in each group. There were zero instances of a cell being flagged at day 30 that was not already flagged at day 10, and vice-versa. This validates the reliability of the 10-day screening window for this type of LiFePO4 battery when preceded by appropriate aging. The consistency can be expressed as:
$$ \text{Set}(K_{10}^{outliers}) \equiv \text{Set}(K_{30}^{outliers}) $$
for both Process A and Process B.
Discussion: The Role of Temperature and SOC in LiFePO4 Battery Screening
The findings elucidate a sophisticated two-stage mechanism for optimal screening of LiFePO4 batteries. The first stage (high-SOC, optionally high-temperature) is dedicated to acceleration and stabilization. Elevated temperature at full charge vigorously drives parasitic reactions and solid electrolyte interphase (SEI) growth, quickly “aging” the cell to a more stable state and weeding out cells with gross defects that might cause immediate failure. This explains the improved voltage consistency after Process B.
The second stage (low-SOC, room-temperature) is dedicated to precision measurement. The 30% SOC point is chosen because the LiFePO4 cathode’s voltage plateau ends, and the OCV becomes a more sensitive function of lithium content in the graphite anode. The chemical potential is lower, reducing the driving force for new parasitic reactions, allowing the measurement to reflect longer-term, subtle internal micro-short circuits or ionic leakage paths. The K-value distribution at this stage is wide precisely because these subtle defects create significantly different leakage currents, enabling clear statistical separation.
The high-temperature step’s value is in compressing the timeline of the first stage without altering the outcome of the second. The effective acceleration factor (\( \alpha \)) can be modeled with an Arrhenius-type relationship for the voltage drop rate:
$$ \frac{K_{T_{high}}}{K_{T_{low}}} \approx \alpha = \exp\left[\frac{E_a}{R}\left(\frac{1}{T_{low}} – \frac{1}{T_{high}}\right)\right] $$
where \( E_a \) is an apparent activation energy for the dominant self-discharge processes during early-life aging of the LiFePO4 battery, \( R \) is the gas constant, and \( T \) is absolute temperature. Our observed factor of ~4 between 25°C (298K) and 45°C (318K) corresponds to an apparent \( E_a \) of approximately 0.65 eV, which is reasonable for mixed diffusion and reaction-limited processes in battery aging.
Conclusion
This comprehensive comparative study establishes a clear framework for optimizing the aging and screening process for large-format LiFePO4 batteries. The key conclusions are:
- SOC-Dependent Screening Efficacy: Screening based on K-value distribution is ineffective at 100% SOC due to high voltage scatter but becomes highly effective at a lower SOC (e.g., 30%), where the OCV is a sensitive indicator of minor charge loss.
- Equivalence of Screening Outcome: A process incorporating a controlled high-temperature (45°C) aging step at full charge is equally effective as a standard room-temperature aging process in identifying LiFePO4 battery cells with abnormally high self-discharge during subsequent low-SOC screening. Both methods identified the same outlier cells with high reliability.
- Significant Process Acceleration: The principal advantage of the high-temperature step is a dramatic reduction in the required aging time. For the studied LiFePO4 battery, aging at 45°C accelerated the stabilization and manifestation of voltage drop by a factor of approximately four. This enables a substantial shortening of the production cycle time without compromising quality control.
- Improved Initial Consistency: The high-temperature aging process also yielded a battery population with superior initial voltage consistency after stabilization, which is beneficial for subsequent module assembly.
Therefore, for manufacturers of LiFePO4 batteries, especially high-capacity cells where production throughput is critical, adopting a protocol that combines a short, high-temperature aging at high SOC followed by a precision K-value screening at a lower SOC represents an optimal strategy. It balances the need for rigorous quality assurance with the demands of efficient production, ensuring the delivery of consistent and reliable battery packs for the electric vehicle market.