
1. Working principle and mathematical model of solar cells
1.1 Working principle of solar cells
The basic working principle of solar cells is the photovoltaic effect of semiconductors, which directly converts light energy into electrical energy through the PN junction in the cell. Its working principle is:
(1) When light is irradiated on a PN junction, due to energy conservation, the energy states of electrons in the atom increase to form free electrons and holes.
(2) Under the action of an internal electric field, electrons enter the N region and holes enter the P region, generating an electromotive force at both ends of the PN junction.
(3) Connecting the external circuit of the PN junction can generate current.
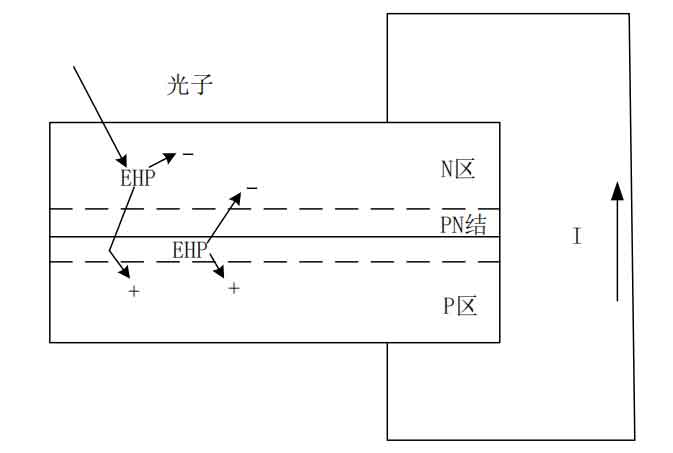
This process can be shown in Figure 1.
1.2 Mathematical model of solar cells
In an ideal state, a solar cell can be equivalent to a giant planar diode, and its equivalent circuit can be shown in Figure 2.
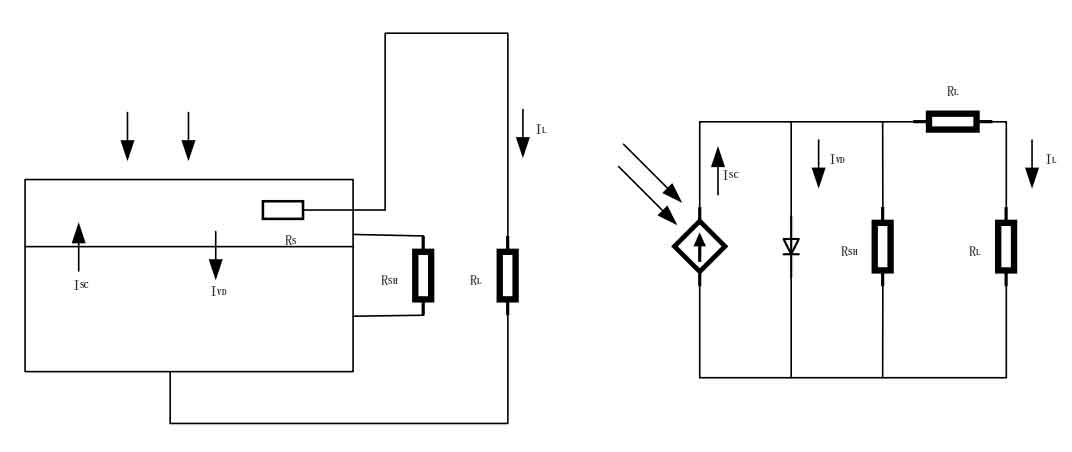
ISC represents the photogenerated current of the solar cell, which is related to the intensity and temperature of the incident light. IVD represents the diffusion current through the PN junction, and its expression is shown in the formula.
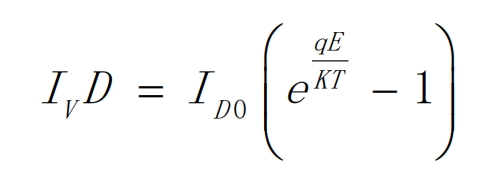
In the formula, ID0 represents the saturation current of the solar cell in the absence of light, as shown in the expression.
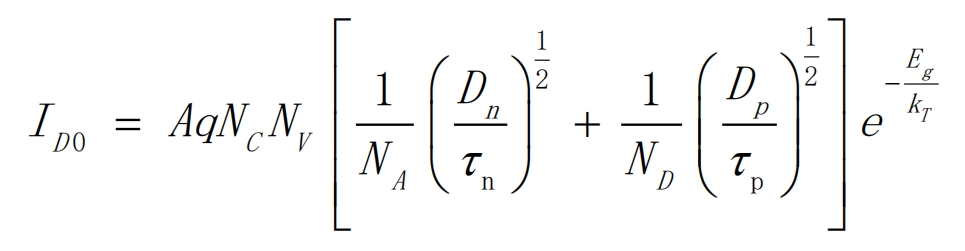
Then the load current IL can be obtained, as shown in its expression.
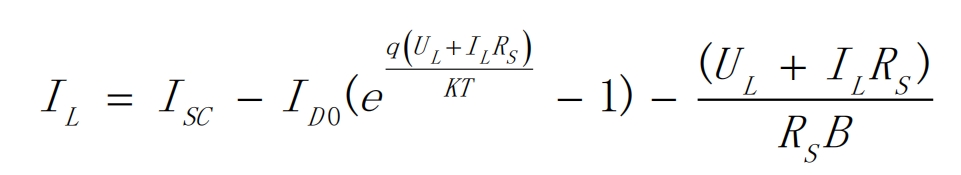
In an ideal state, the influence of parallel resistance and series resistance can be ignored, and the above equation can be simplified as shown in the formula.
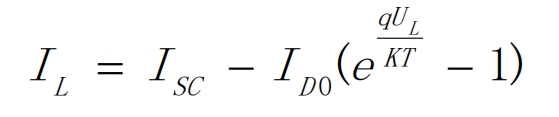
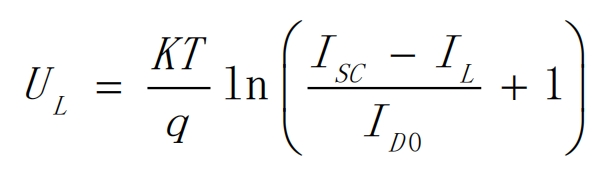
The I-V relationship of solar cells under ideal conditions can be obtained as shown in the formula.
Therefore, it can be determined that light intensity and temperature are important parameters determining the output characteristics of solar cells. By changing the light intensity or temperature, a series of curve clusters can be obtained, indicating the relationship between light intensity and temperature on the output characteristics of solar cells. As shown in Figure 3.
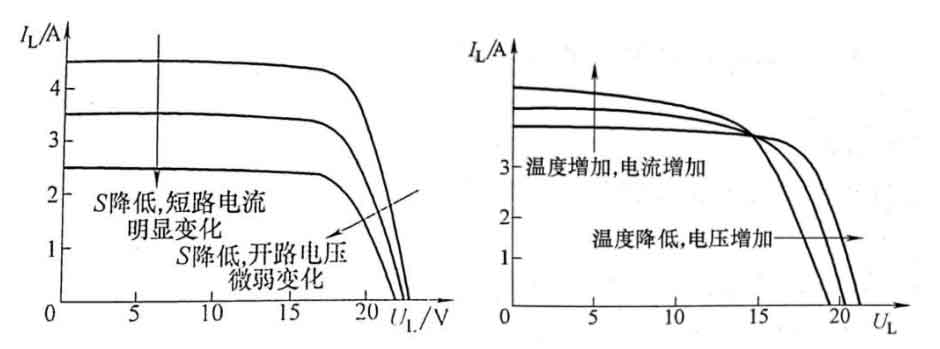
Therefore, it can be inferred that UL=UOC when RL → ∞; When RL → 0, IL=ISC. The area between the curve and the coordinate axis in Figure 3 is the output power of the solar cell. Therefore, it can be inferred that the P-V curve of the solar cell is shown in Figure 4.
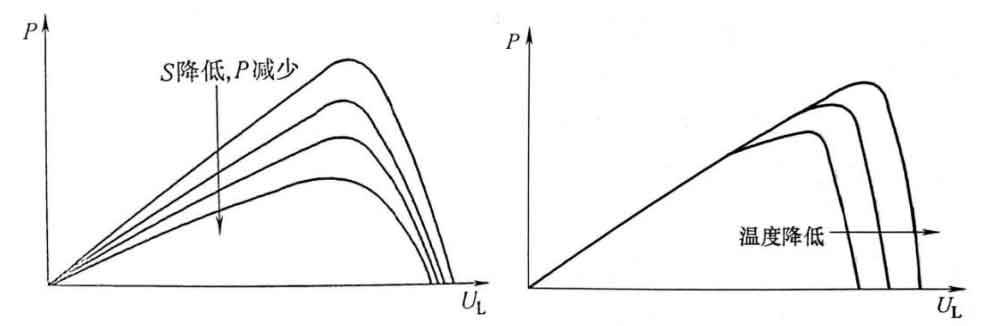
From the graph, it can be inferred that when the temperature remains constant, as the light intensity decreases, the solar cell UOC decreases slowly, while ISC and PM decrease rapidly; When the light intensity remains constant, the solar cell UOC increases linearly with temperature, the ISC increases slowly with temperature, and the PM increases rapidly with temperature. On the left side of Pm, it is approximately a constant current source characteristic, while on the right side of Pm, it is approximately a constant voltage source characteristic. From this, it can be concluded that solar cells are typical nonlinear components that differ significantly from constant current sources, constant voltage sources, and controlled sources. Therefore, the establishment of mathematical models for solar cells is of great significance for solar power generation systems.
The actual solar power generation system is mostly connected to the solar system in the form of photovoltaic arrays. Multiple low voltage, small capacity solar cells are connected in series or parallel according to the load requirements and packaged in a unified photovoltaic array rack to form a unified whole. Its output characteristics meet the requirements shown in the formula.
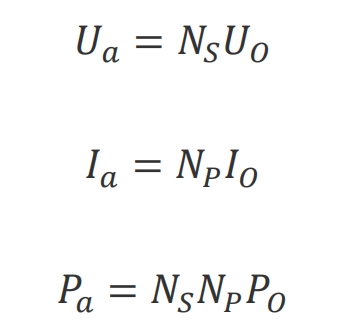
Satisfy the ideal power supply series parallel relationship.
2. Establishment and analysis of solar cell simulation model
2.1 Establishment of solar cell simulation model
Due to the fact that in practical applications, only the Isc, Uoc, Um, and Im parameters of solar cell modules in standard environments can be obtained, and solar cells are nonlinear components, conventional behavior models use a fitting model for the basic output characteristics of solar cells, which can be fitted to obtain the basic output characteristics of solar cells in standard environments, However, due to the fact that the environment in which solar cells are used is not a laboratory standard environment, they need to have output characteristics under non-specific conditions. Therefore, current, voltage, and temperature correction variables DI and DV are introduced to simulate the impact of environmental changes on the output characteristics of solar cells, and a behavioral model is established to correct the output characteristics based on the environment.
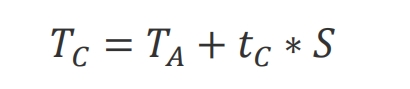
Through analysis, it can be concluded that solar cells are greatly affected by temperature T and light intensity S. It can be inferred that 𝐼=𝑓 (𝑈, 𝑆, 𝑇), and the mathematical model of solar cell temperature TC (℃) and light intensity S (w · m ^ -2) and ambient temperature TA (℃) is shown in the formula.
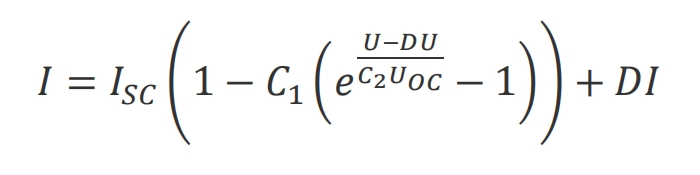
It can be inferred that the I-V relationship under specific conditions is shown in the formula.
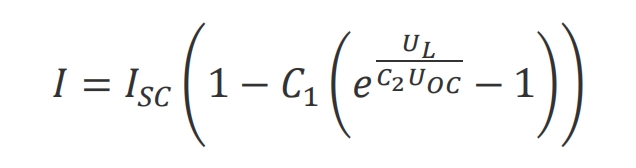
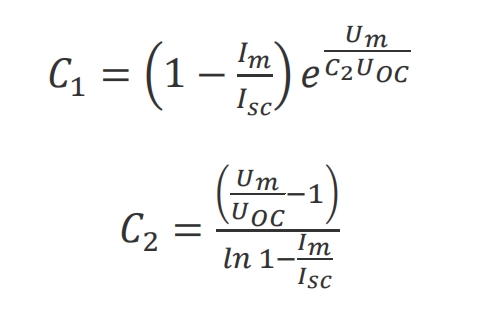
The expressions for C1 and C2 are shown in the formula.
When S and T change, i.e. under non-specific conditions, the mathematical model of solar cells is shown in the formula.
The expressions for DI and DU are shown in the formula.
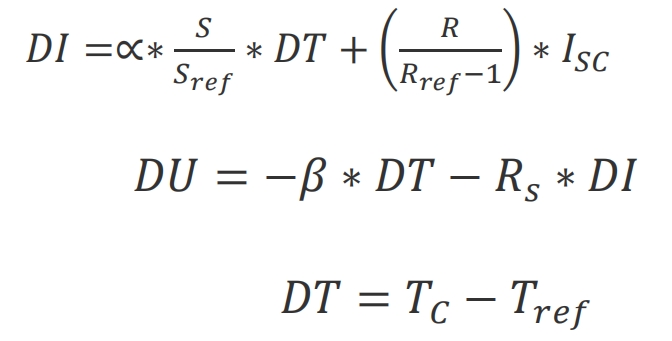
Among them, Sref and T are taken as 1kW/m2 and 25 ℃; α Related to β The temperature variation coefficients A/℃ and V/℃ for current and voltage, respectively; RS is a series resistor for solar cells.
2.2 Analysis of solar cell simulation data
Build a simulation model on the Simulink platform based on the mathematical model, and the simulation system diagram is shown in Figure 5.
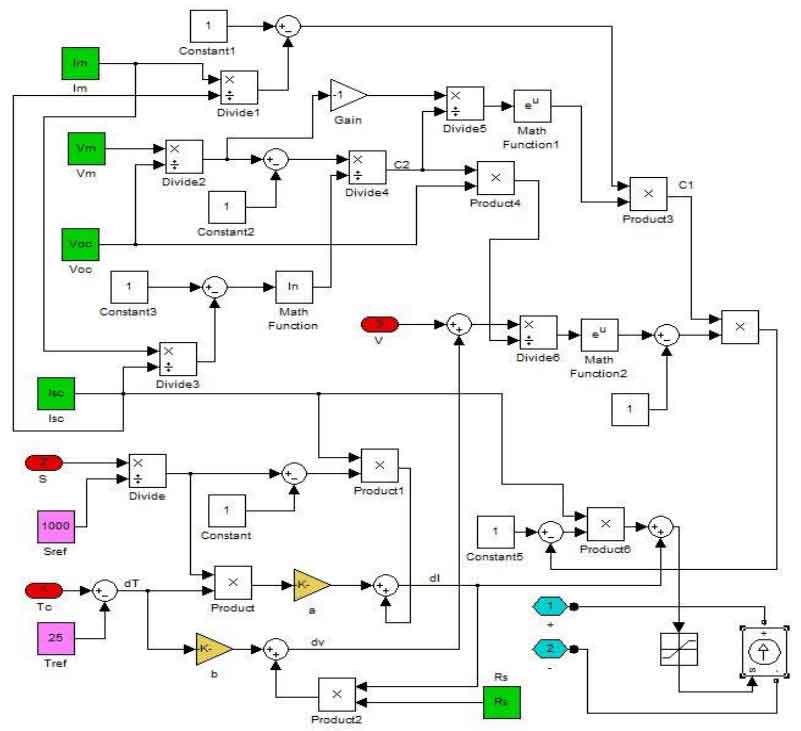
The simulation parameters are designed as Im=4.95A, Isc=5.2A, Vm=35.2V, Voc=44.2V, Tref=25 ℃, Sref=1000W/m ^ 2, Ϊ= 0.00624A/℃, Ϋ= 0.221V/℃, Rs=0.5 Ω.
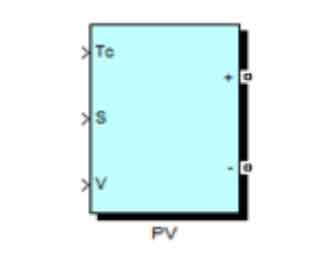
For the convenience of establishing the simulation model of the photovoltaic grid connected system in the future, Figure 5 is packaged, and there is no need to enter the subsystem for editing and reading the data parameters of the solar cell model in the future. The packaging is shown in Figure 6.
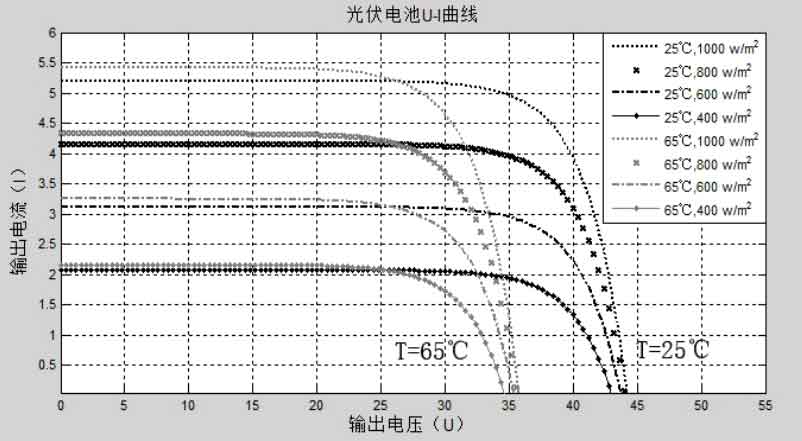
The simulation generates a series of outputs based on the changes in light intensity and ambient temperature. The data on the changes in light intensity of the ambient thermometer are shown in the table.
| Environmental temperature (℃) | Light intensity (w/m2) | |
| Series 1 | 25 | 400 600 800 1000 |
| Series 2 | 65 | 400 600 800 1000 |
The voltage and current simulation result curve of the solar cell is shown in Figure 7.
The voltage and power simulation result curve of solar cells is shown in Figure 8.
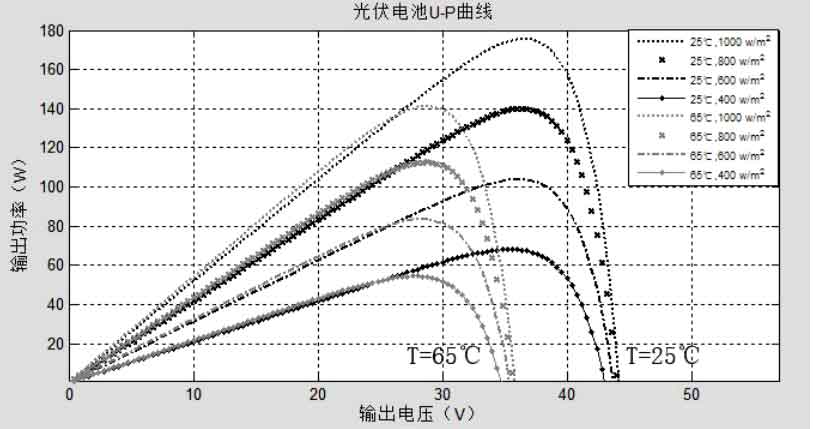
Through the analysis of simulation data from the above two series, data samples of the output characteristics of solar cells in specific environments can be provided, which is convenient for later circuit simulation analysis. Furthermore, the conclusion is further confirmed that when the sunlight intensity is constant, Isc slightly increases with the increase of environmental temperature, while Uoc rapidly decreases with the increase of temperature. The maximum power point Pm corresponds to a decrease in the voltage at Um point as the temperature rises, The reduction amplitude is equivalent to the frequency of Uoc decrease. When the temperature is constant, the increase in light intensity Uoc is very small, while Isc has a significant increase. The change in Um voltage corresponding to its Pm point is not significant, but there is a significant increase in Pm value.
3. Summary
(1) Analyzed the basic principle of solar cell power generation, established an equivalent circuit based on controlled sources according to its physical characteristics, and analyzed the mathematical model of solar cell output characteristics.
(2) Using Simulink simulation, the mathematical model of solar cells is modified using environmental correction method. The output curve characteristic curves under different conditions are obtained through simulation, and a fixed package is established to enhance the flexibility of the simulation model, preparing for maximum power point tracking simulation in the early stage.