
Under the goal of achieving carbon peak and carbon neutrality, the installed capacity of renewable energy generation in the power system is constantly increasing. In the context of a high proportion of renewable energy grid connection, how to maintain frequency stability in the power system has become a current research hotspot. The battery energy storage system has the characteristics of high automation level and flexible control, which can quickly respond to random and short-term changes in load, ensure active power balance in the power system, and thus play a role in frequency regulation. The scientific and reasonable allocation of energy storage capacity is an important part of energy storage application planning and the foundation for promoting its entry into the frequency modulation market.
At present, the participation of energy storage systems in the allocation of power grid frequency regulation capacity usually takes the economic optimization as the objective function and technical indicators as constraints. Reference [7] used empirical mode decomposition method to decompose Area Control Error (ACE) signals, assigning high-frequency and low-frequency signals to energy storage units and traditional frequency modulation power sources respectively. A capacity optimization configuration model was established with the goal of maximizing net benefits. Finally, genetic algorithm was used to assist in solving the established net benefit model. Utilizing set empirical mode decomposition to decompose ACE signals, by continuously optimizing the filtering order of set empirical mode decomposition, a capacity optimization model with the objective function of maximizing net benefit is established and solved. The variational modal decomposition method is used to decompose the initial frequency modulation command. The established optimization model comprehensively considers the limitations of the unit’s climbing rate and the energy storage system SOC. The cost benefit model is used as the goal, and particle swarm optimization algorithm is used to solve the optimal capacity allocation result. The established economic model takes into account the indirect benefits brought by the fatigue loss of the unit rotor, and establishes a cost model for the energy storage system by considering investment costs, operation and maintenance costs, fault loss costs, etc., and optimizes the solution. The economic indicators take into account the health level and battery capacity degradation of the energy storage system. By establishing a degradation model of the energy storage battery capacity, the health level of the energy storage system is predicted, and the economic model of the energy storage system participating in power grid frequency regulation is optimized and solved. Based on the above research, the capacity optimization configuration of energy storage systems participating in power grid frequency regulation mainly involves two aspects: firstly, the decomposition, reorganization, and allocation of power grid frequency regulation instructions; The second is to establish and optimize the economic model for the energy storage system to participate in power grid frequency regulation.
For the research on capacity allocation of energy storage participating in secondary frequency regulation of the power grid, this article first uses wavelet transform to decompose, reorganize, and redistribute the initial ACE signal. According to the characteristics of the energy storage system and conventional units, the initial frequency regulation instructions of the energy storage battery and units are allocated. A cost-benefit model of energy storage participating in power grid frequency regulation is established, and the frequency regulation performance indicators and net benefits under different recombination points are analyzed to obtain the final capacity allocation result. Finally, simulation verification was conducted based on the measured ACE signal.
1.Decomposition, recombination, and redistribution of ACE signals
When the electrochemical energy storage system participates in auxiliary frequency modulation, ACE can be divided into four regulatory regions based on different thresholds. Set the thresholds for each interval as AACE1, AACE2, and AACE3, and set the real-time ACE value as AACE.
The traditional frequency modulation unit has a long response time delay and fails to timely and accurately follow the changes in system frequency to change its output during the frequency modulation process. The energy storage system can compensate for this deficiency of the traditional frequency modulation unit. Therefore, it is necessary to perform high-frequency and low-frequency decomposition of the frequency modulation signal emitted by the power grid center. This article adopts discrete wavelet transform, whose expression is:
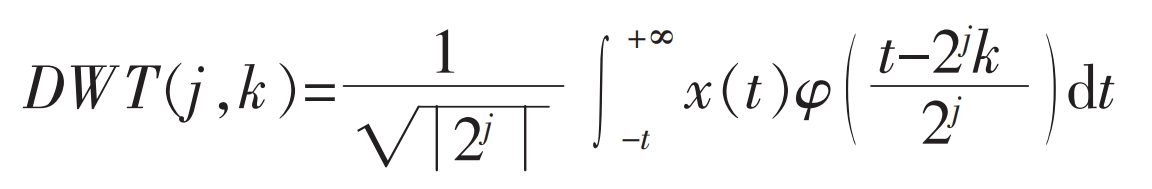
In the formula: x (t) is the EEG signal, which is a highly non-stationary signal; φ Is the wavelet basis function, abbreviated as wavelet basis; J and k represent the scaling and translation of scale and wavelet basis in the frequency domain and time domain, respectively.
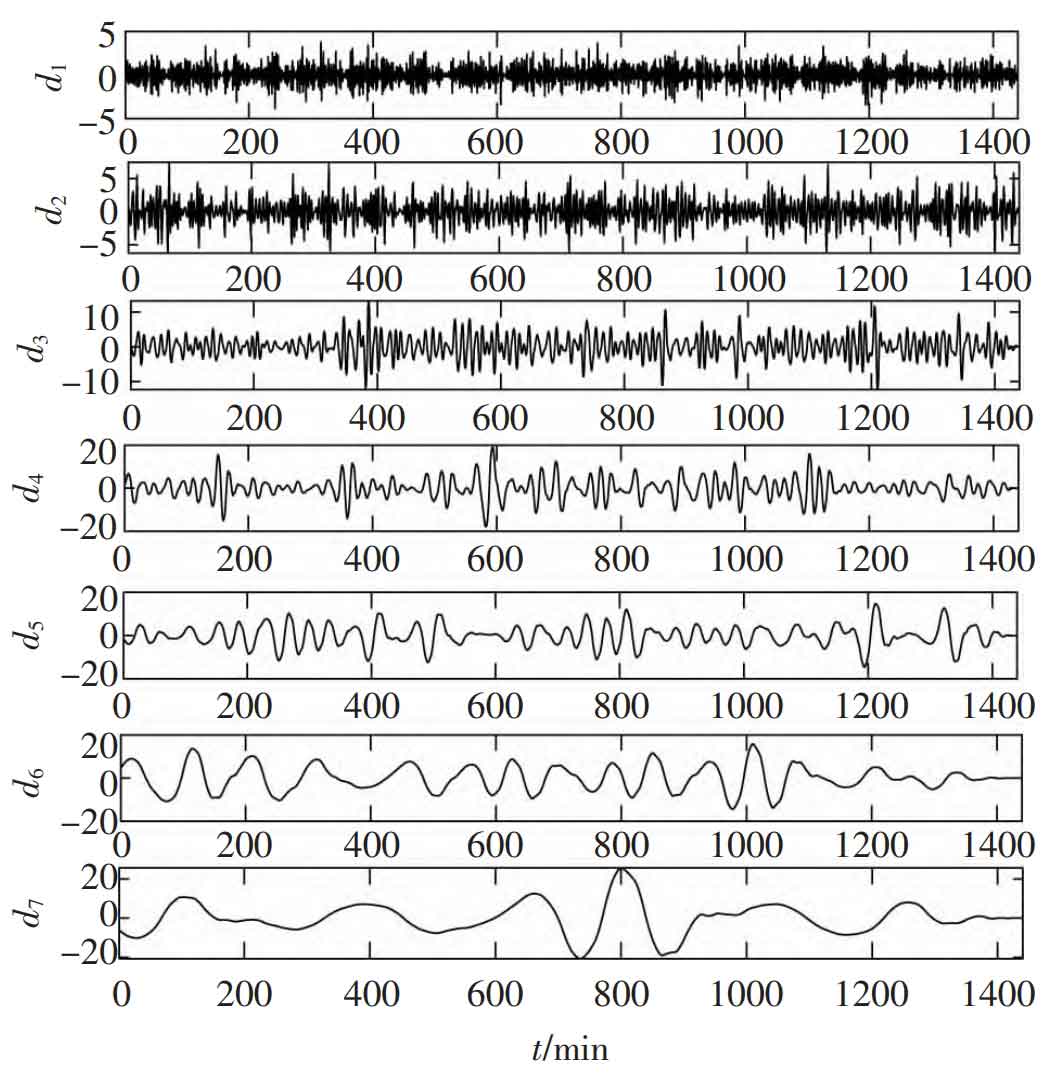
The number of decomposition layers of wavelet decomposition is determined by the main frequency component of the signal. Based on the characteristics of traditional units and energy storage systems participating in grid frequency regulation, the ACE signal is decomposed into d1~d7 components with frequencies ranging from low to high through wavelet transform. The decomposed high-frequency components are recombined as the frequency regulation instruction PE (t) of the energy storage system, and the decomposed low-frequency components are recombined as the frequency regulation instruction PG (t) of the thermal power unit.
The expressions for PE (t) and PG (t) are:
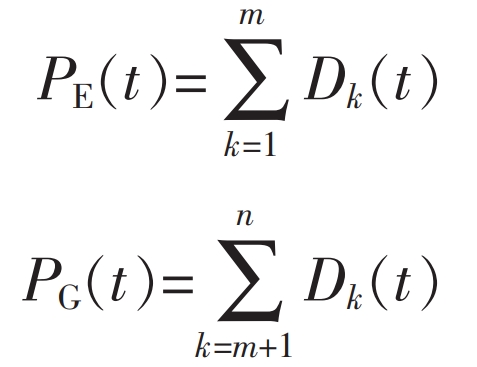
In the formula: m=1, 2,…, 6; Dk (t) represents each discrete wavelet of the wavelet transform.
2.Establishment of a cost-benefit model for optimizing the configuration of energy storage frequency regulation capacity
2.1 Cost Model for Energy Storage Frequency Modulation
When establishing a capacity optimization configuration model for energy storage participating in secondary frequency regulation of the power grid, the cost mainly considers the initial investment cost, operation and maintenance cost, replacement cost of energy storage related equipment, scrap disposal cost, and frequency regulation cost of the energy storage system.
① Initial investment costs
The initial investment cost of the energy storage system Sini is mainly related to the scale of system construction, and the specific relationship is as follows:
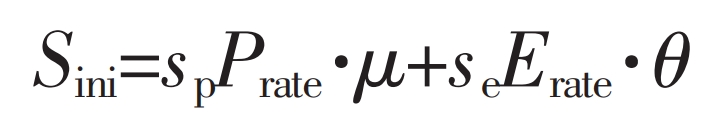
In the formula, Prate and Erate are the rated power and rated capacity of the energy storage system, respectively; Sp and se are the initial investment costs per unit power and per unit capacity of the energy storage system, respectively; μ And θ The utilization rates of energy storage converters and energy storage units, respectively.
② Operation and maintenance costs
In order to maintain the energy storage plant in good operating condition throughout its entire life cycle, it is necessary to regularly maintain the various equipment of the energy storage system. The specific relationship is as follows:
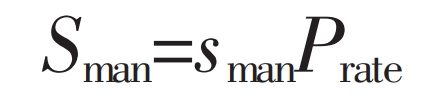
In the formula, sman represents the operating and maintenance cost per unit power of the energy storage system.
③ Costs of replacing energy storage related equipment
During the entire life cycle of energy storage participating in frequency modulation, relevant equipment needs to be replaced, and the replacement cost Sre is:
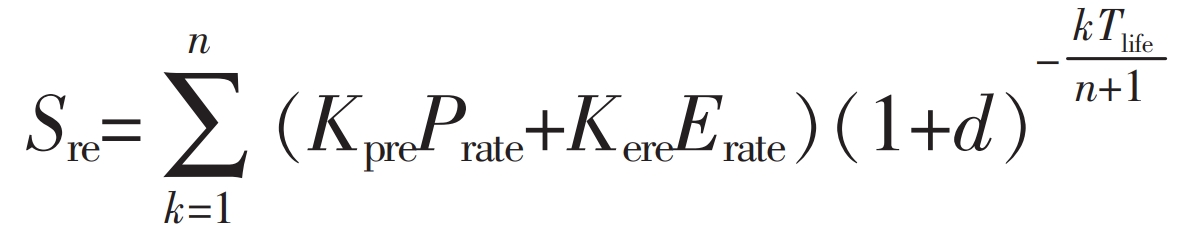
In the formula, Kpre and Kere are the replacement costs per unit power and per unit capacity of energy storage related equipment, respectively; D is the discount rate; N is the number of times related equipment is replaced throughout the entire life cycle of Tlife.
④ Costs of scrapping energy storage related equipment
After the full life cycle of the energy storage system reaches, the energy storage related equipment needs to be scrapped, and the cost Sd is:
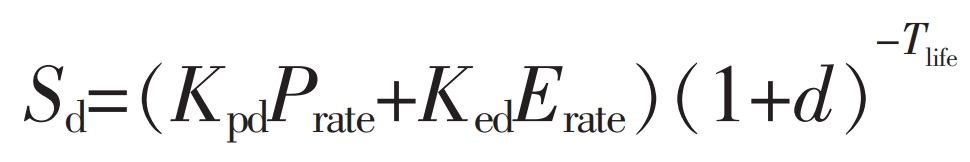
In the formula, Kpd and Ked are the scrapping costs per unit power and per unit capacity of energy storage related equipment, respectively.
⑤ Frequency modulation cost
In the process of energy storage assisting conventional unit frequency modulation, the frequency modulation cost mainly includes two parts: one part is the wear cost Sabr caused by conventional unit changing the output direction due to following instructions; The other part is the penalty cost of the unit deviating from economic dispatch due to its participation in frequency regulation, Fine. The specific relationship is as follows:
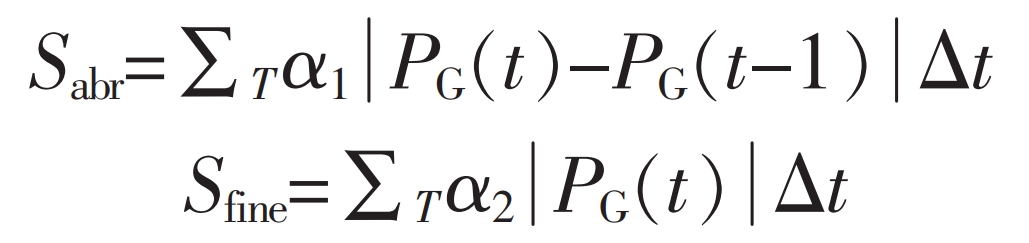
In the equation: α 1 and α 2 refers to the penalty cost per unit of electrical energy caused by frequent changes in output during the participation of thermal power units in frequency regulation, as well as the deviation from economic dispatch due to participation in frequency regulation.
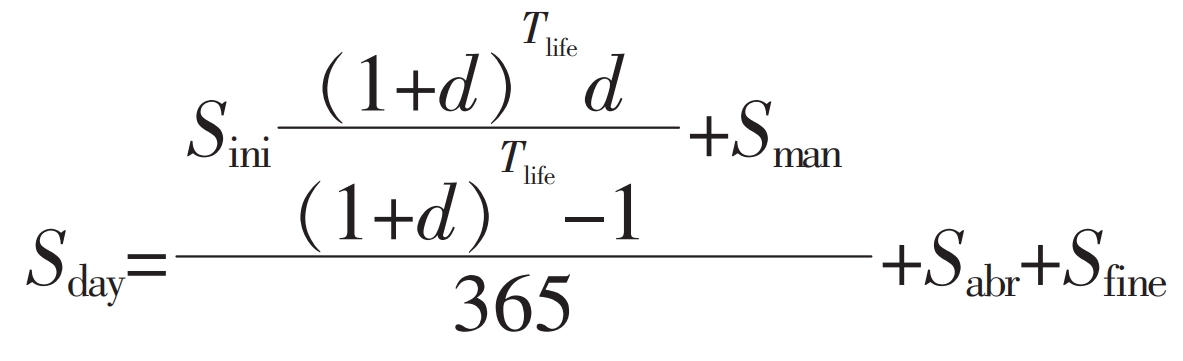
Based on the actual operating years of the energy storage system, the initial investment cost, operation and maintenance cost, and frequency modulation cost are decomposed throughout the entire life cycle, and the daily frequency modulation cost Sday can be obtained as:
2.2 Benefit Model of Energy Storage Frequency Modulation
When establishing a capacity optimization configuration model for energy storage participating in the secondary frequency regulation of the power grid, the benefits mainly consider the environmental benefits of the energy storage system, adjustable power benefits, equivalent reduction of unit reserve capacity benefits, and real-time electricity benefits.
① Environmental benefits
After participating in frequency regulation, energy storage can share the pressure of thermal power units, reduce the active output of thermal power units, thereby reducing coal consumption and reducing the emission costs of harmful gases such as nitrogen and sulfur. The environmental benefits of energy storage participating in frequency modulation are:
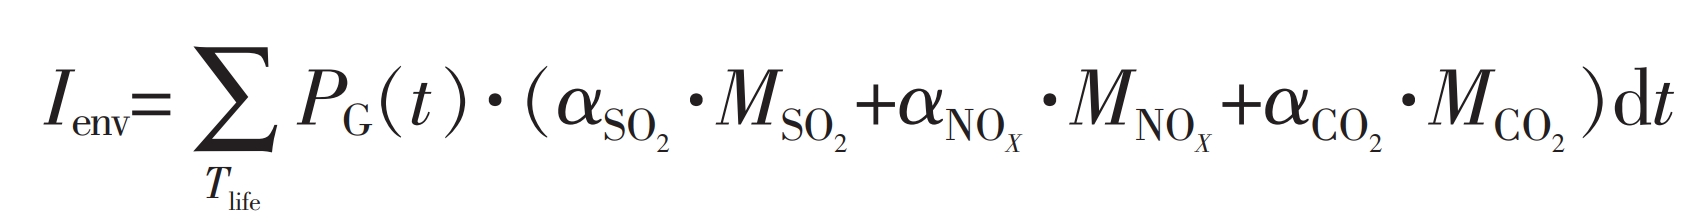
In the equation: α SO2, α NOX, α The emission cost of CO2 as a unit of pollutant gas; MSO2, MNOX, and MCO2 represent the total mass of each pollutant gas generated during the energy storage frequency modulation cycle.
② Adjusting power benefits
During the entire frequency regulation cycle of the energy storage system, the actual power of the energy storage system is generally less than the rated power of the energy storage system, with a certain adjustment margin, which can be equivalent to the reserve power capacity of conventional thermal power units, thus having certain benefits. The benefits of increasing the power of the energy storage system, IUp, and decreasing the power of the energy storage system, Idown, are:
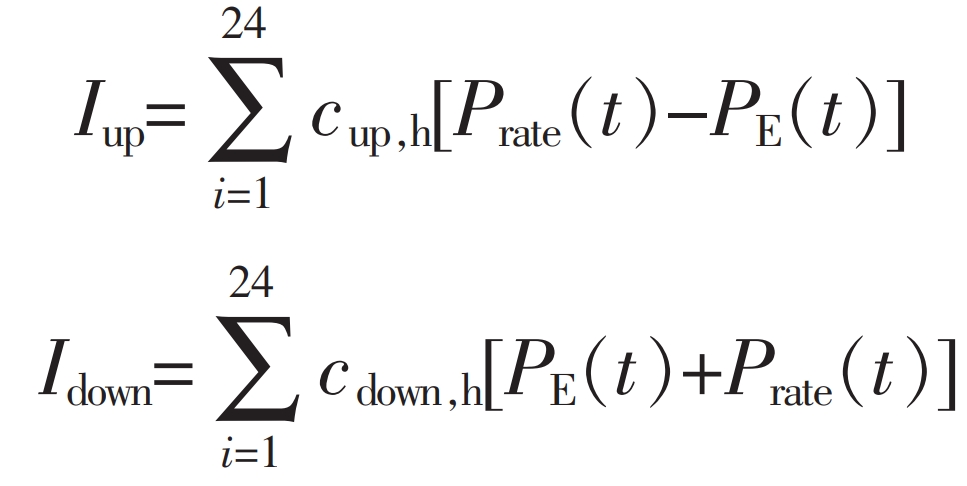
In the formula, cup, h, and cdown, h respectively represent the unit power prices for the energy storage system.
③ Equivalent reduction of unit reserve capacity benefits
Due to the participation of the energy storage system in frequency regulation and sharing of a portion of the power of traditional units, the frequency regulation reserve capacity of traditional units is reduced. The reduced reserve capacity can be used for electricity market transactions, and its return Isell is:
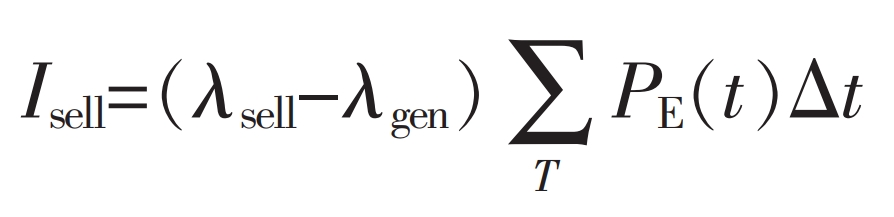
In the equation: λ Sell and λ Gen refers to the selling price of electricity and the cost of generating electricity.
④ Real time electricity efficiency
The real-time electricity efficiency of energy storage, Irea, refers to the benefits generated during the entire process of charging and discharging energy storage participating in power grid frequency regulation.
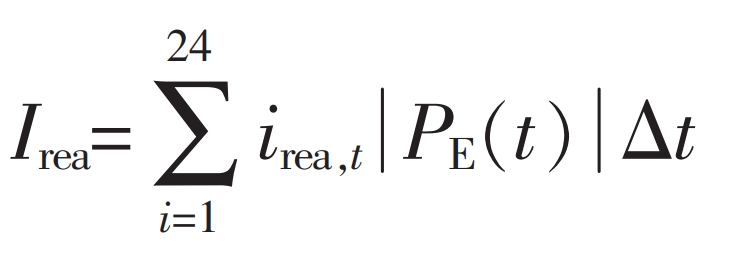
In the formula: irea, t is the hourly electricity price for energy storage.
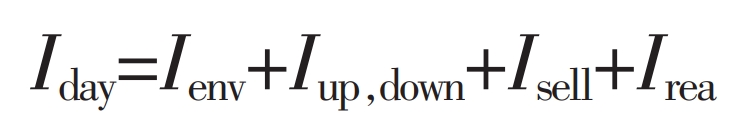
The income Iday of energy storage participating in frequency modulation is:
In summary, the cost-benefit model of energy storage participating in secondary frequency regulation of the power grid, Cd ay, is:

The capacity optimization model with the objective function of maximizing net benefits is as follows:
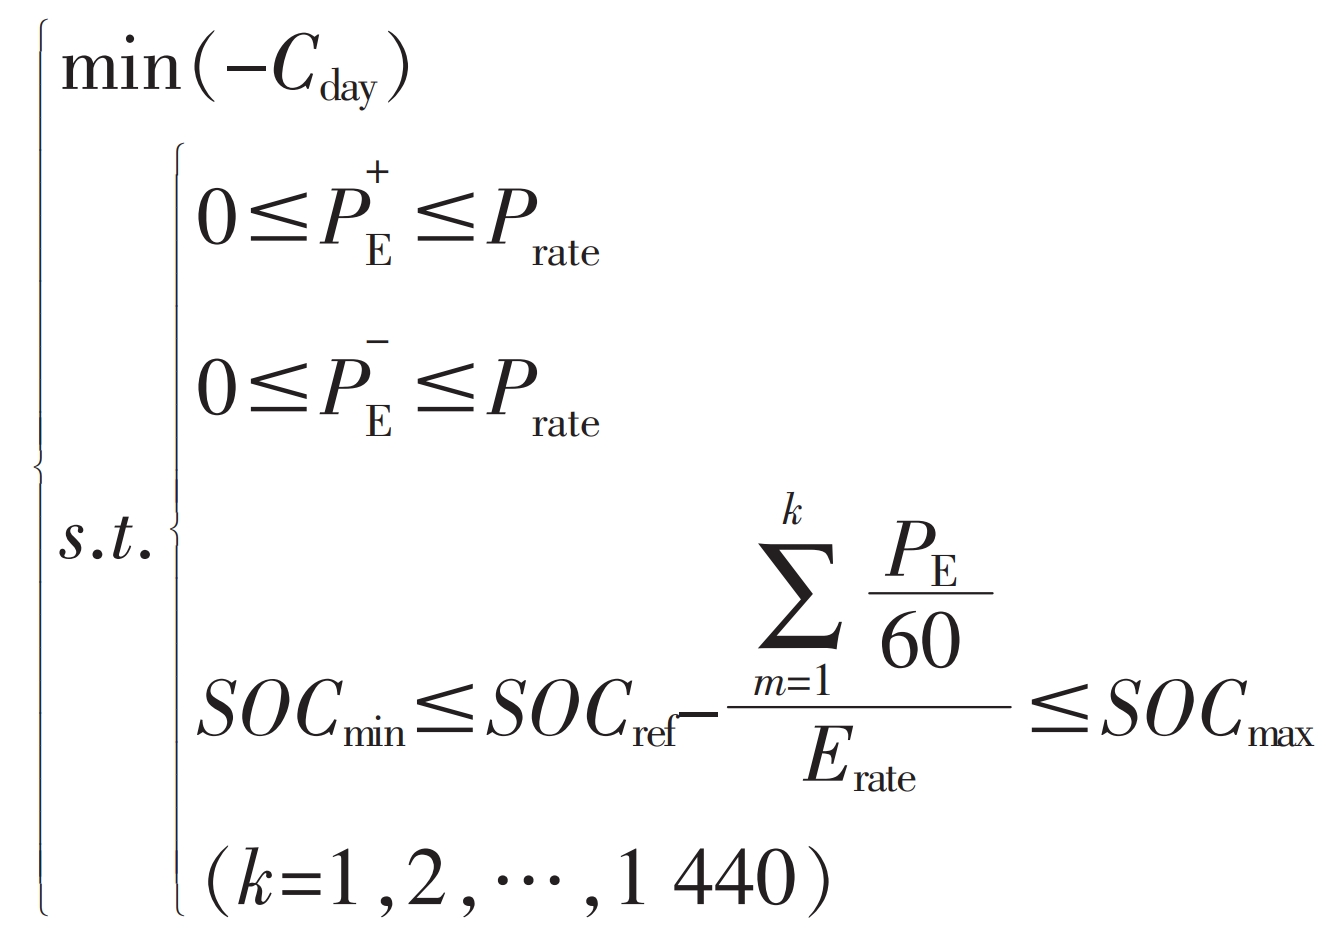
In the formula, SOCmax, SOCmin, and SOCrof are the maximum, minimum, and initial values of the state of charge of the energy storage battery, respectively.
The model mainly considers the charging and discharging power constraints of the energy storage system and the SOC constraints of the energy storage battery.
3.Solution of capacity optimization configuration model
In the model established by equation (18), the variables to be solved include Prate, Erate, and 1440 pairs of [P+E (t)] and [P-E (t)], all of which are nonlinear constraints. The solution idea of this article first determines the range of initial power based on the power after wavelet decomposition and reconstruction, and gives an initial estimated value. The nonlinear constraints in the model are transformed into linear constraints, and a linear optimization model containing only variables [P+E (t)] and [P-E (t)] is solved; Based on the obtained [P+E (t)], [P-E (t)], and net benefit values, an improved sparrow search algorithm is used to assist in solving the optimization model with variables Prate and Erate to improve the solving efficiency. The main steps are as follows.
① Divide all sparrows into two categories based on their fitness values: discoverers and joiners. The discoverer’s responsibility is to forage for the entire population, while the joiner’s responsibility is to follow the discoverer’s search direction to obtain food. In addition, a certain proportion (usually 20%) of sparrows are randomly selected as the early warning. When the early warning detects predators around them, an alarm signal will be issued. When the alarm signal exceeds the threshold, the finder will change their search direction.
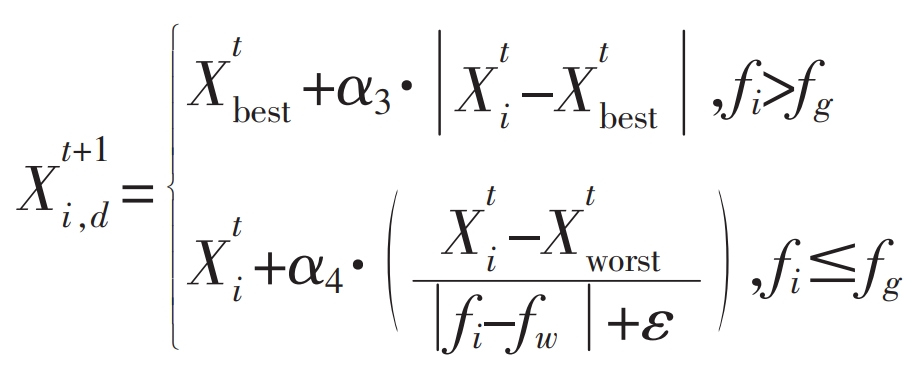
② The formula for updating the discoverer’s position is shown in equation (19).
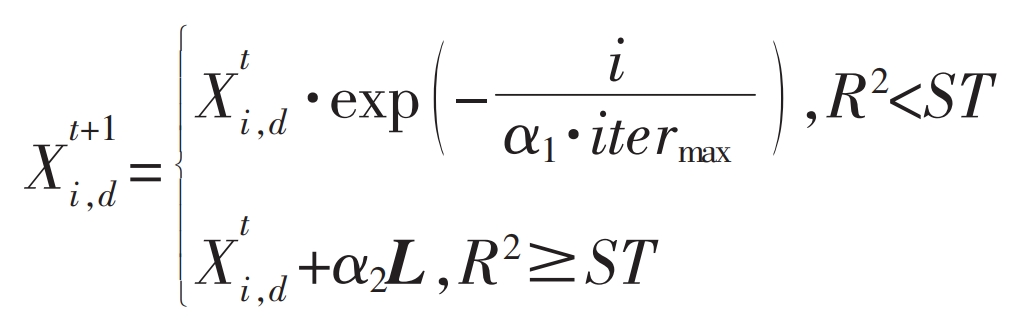
In the formula: Xt+1i, d is the d-dimensional position of the i-th sparrow individual after the t+1st iteration; Itermax is the maximum number of iterations; α The values of 1 and R2 are (0,1) and [0,1], respectively; α 2 is a normally distributed random number that satisfies a normal distribution; The safety threshold of ST is [0.5, 1.0]; L is a matrix with all 1-dimensional elements in a row.
In equation (19), when R2<ST, the discoverer randomly moves to the next position according to a normal distribution and searches for areas with higher fitness values; When R2 ≥ ST, there may be predators around, so narrow the search range and move towards a safe area.
③ The formula for updating the position of the enrollee is shown in equation (20).
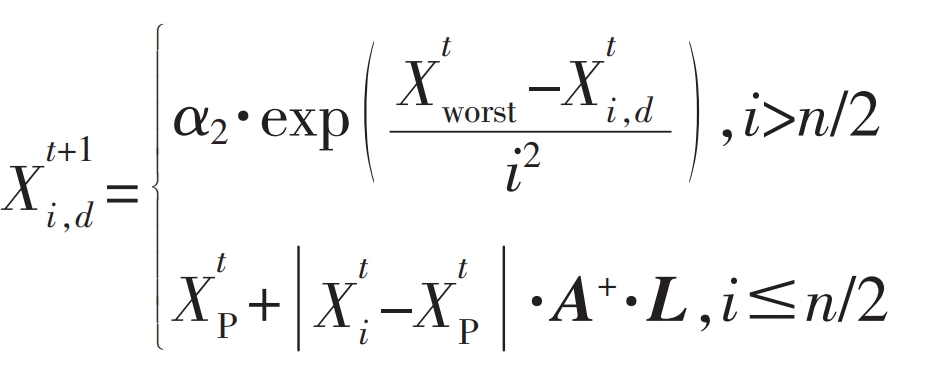
In the formula, Xtworst and XtP are the worst and best positions of the t-th iteration, respectively; Set A to 1 × A matrix with all elements being 1 or -1, then A+=AT (AAT) -1; N is the total number of sparrows.
In equation (20), when i>n/2, the fitness value of the i-th sparrow individual is low and needs to go to other areas to search for food; When i ≤ n/2, the i-th sparrow individual will search for food near the optimal location of the discoverer individual.
④ The formula for updating the position of the warning person is shown in equation (21).
In the formula: Xtbest is the global optimal position of the sparrow individual after the t-th iteration; α 3 and α All 4 are random numbers, where, α 3 follows a normal distribution, α The value of 4 is [-1, 1]; ε Is the minimum value; Fi, fg, and fw are real-time fitness values, global best fitness values, and global worst fitness values, respectively.
In equation (21), when the early warning person is in the current optimal position, it will randomly move to a position near the current position; When the alerter is not in the current optimal position, it will move to the vicinity of the optimal position. The sparrow search algorithm has obvious advantages in solving problems where the optimal solution is closer to the origin. When the optimal solution is farther from the origin, the solving speed and accuracy of the results will significantly decrease. Therefore, this article makes corresponding improvements to the algorithm by changing its gradual convergence towards the origin.
At the same time, in order to solve the problem that the sparrow search algorithm may fall into local optima due to jumping towards the optimal solution during the iteration process, the position formula is changed to move it towards the optimal solution.
The formula for updating the location of the discoverer after improvement is:
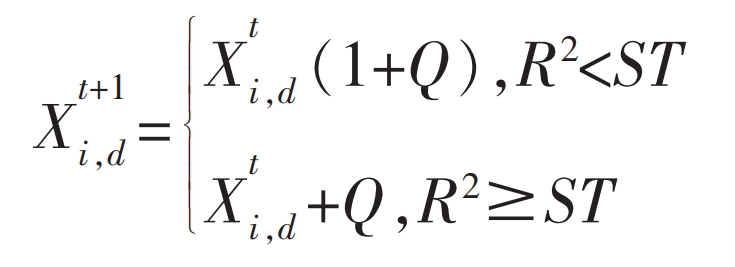
In the equation, Q is a standard normal distribution random number.
The formula for updating the location of the improved early warning system is:
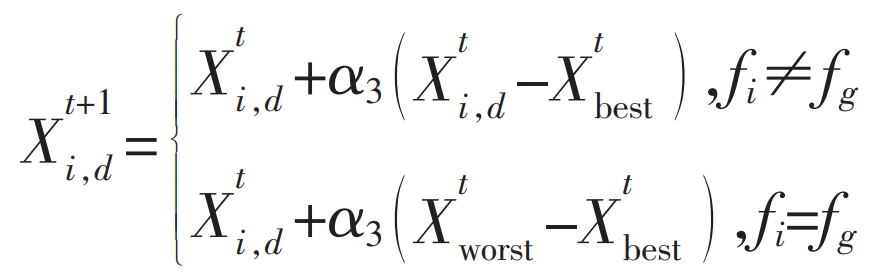
When the alerter in equation (23) is a sparrow individual in the optimal position, it will move to a random position between the optimal and worst positions; When the alerter is not in the optimal position, it will move to a random position between the current position and the optimal position.
When solving the capacity optimization configuration model, this article first uses wavelet decomposition to decompose, reassemble, and redistribute the initial ACE signal, and then integrates the sparrow search algorithm to assist in solving the cost-benefit model.
4.Simulation verification and analysis
4.1 Selection of simulation parameters
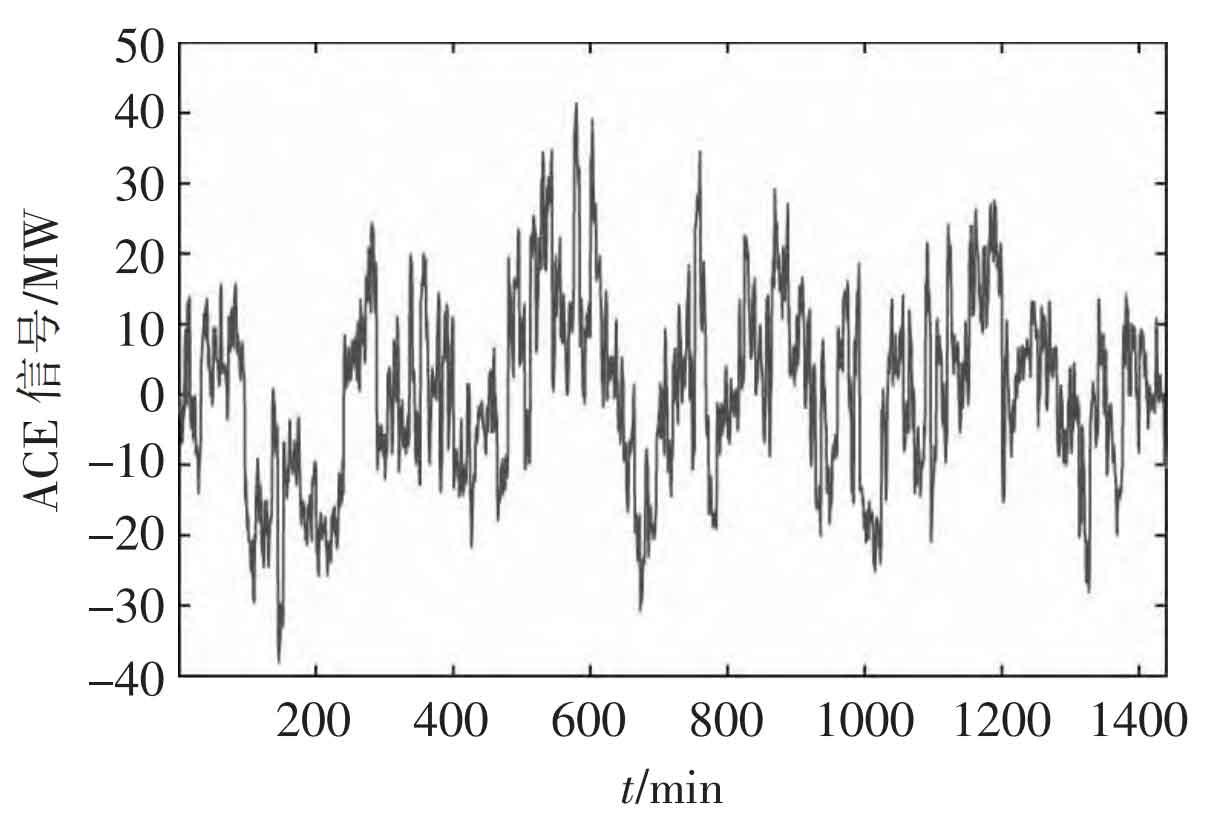
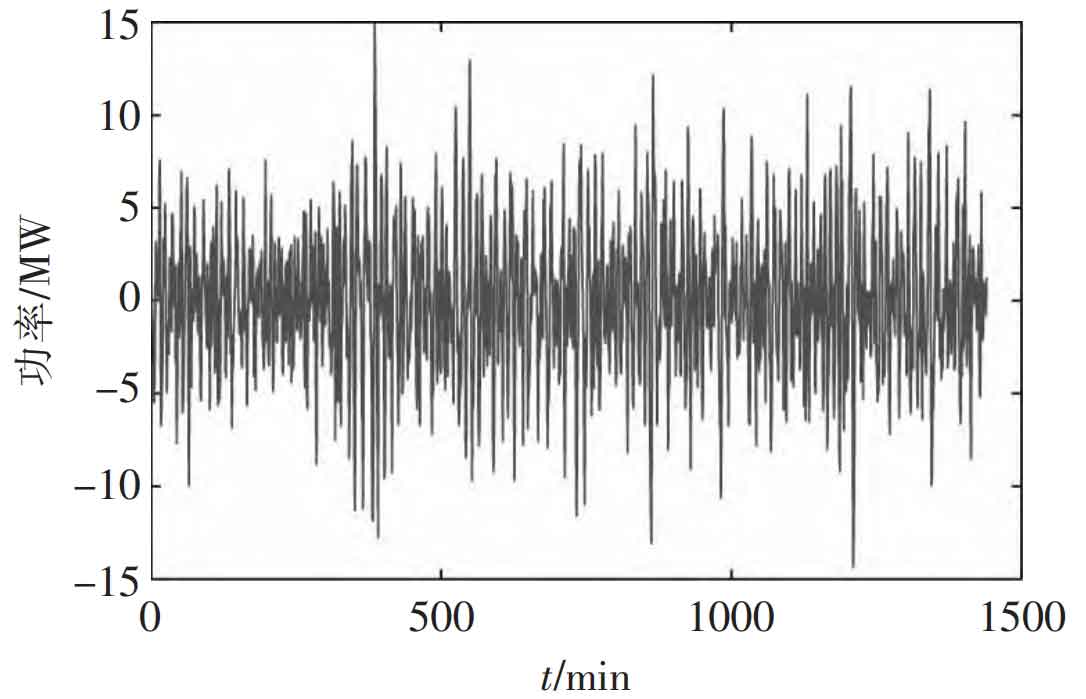
This article selects the ACE signal of a domestic power supply company on a certain day in 2020 as simulation data, with a sampling interval of 1 minute from 00:00 to 23:59 on that day. A total of 1440 data are selected, as shown in Figure 1.
The simulation parameters related to the cost benefit model of energy storage participation in frequency modulation are shown in Table 1.
| Parameter | Numerical value |
| Sp, Se/yuan · kW^-1 | 1300 3000 |
| Sman/10000 yuan · (MW · a)^ -1 | 6 |
| D/% | 6 |
| T/a | 20 |
| Kpre, Kere/10000 yuan · MW^-1 | 140 46 |
| Kpd, Ked/yuan · kW^-1 | 465,0 |
| λ Sell/yuan · (kW · h)^ -1 | 0.391 |
| λ Gen/yuan · (kW · h)^ -1 | 0.355 |
| α 1, α 2/yuan · (MW · h) ^-1 | 63.5,30 |
| Ncycle/time | 6000 |
At present, China mainly adopts the comprehensive frequency regulation performance index Kp in the Implementation Rules for Auxiliary Service Management of Grid Connected Power Plants in the North China Region and the Implementation Rules for Grid Connected Operation Management of Power Plants in the North China Region (referred to as the “Two Rules”) for evaluation, namely:
In the formula, K1 is the adjustment rate indicator; K2 is the adjustment accuracy index; K3 is the adjustment time indicator.
4.2 Analysis of simulation results
① Decomposition of initial ACE signal
The core issue of energy storage participating in the optimization and configuration of power grid frequency regulation capacity is how to allocate frequency regulation commands issued by the power grid dispatch center to fully leverage the advantages of energy storage system and thermal power unit frequency regulation. Energy storage is suitable for frequency regulation commands with fast changing frequency and small amplitude, while thermal power units are suitable for frequency regulation commands with slow changing frequency and large amplitude. The traditional power allocation strategy adopts a proportional allocation method, which does not fully leverage the technical characteristics of both. Therefore, this article first uses wavelet transform to decompose the initial ACE signal based on its frequency characteristics, and the decomposition results are shown in Figure 2. The initial ACE signal is decomposed into 7 components d1~d7 based on its frequency characteristics. From the graph, it can be observed that the frequency of d1~d7 gradually decreases, while d1 and d7 are the highest and lowest frequency components of the initial signal, respectively. On the contrary, the amplitude of d1~d7 gradually increases.
The detailed signals of each layer decomposed by wavelet transform from the initial ACE signal in Figure 2 were analyzed using Fast Fourier Transform for spectrum analysis. The spectral characteristics of the detailed signals of each layer are shown in Figure 3.
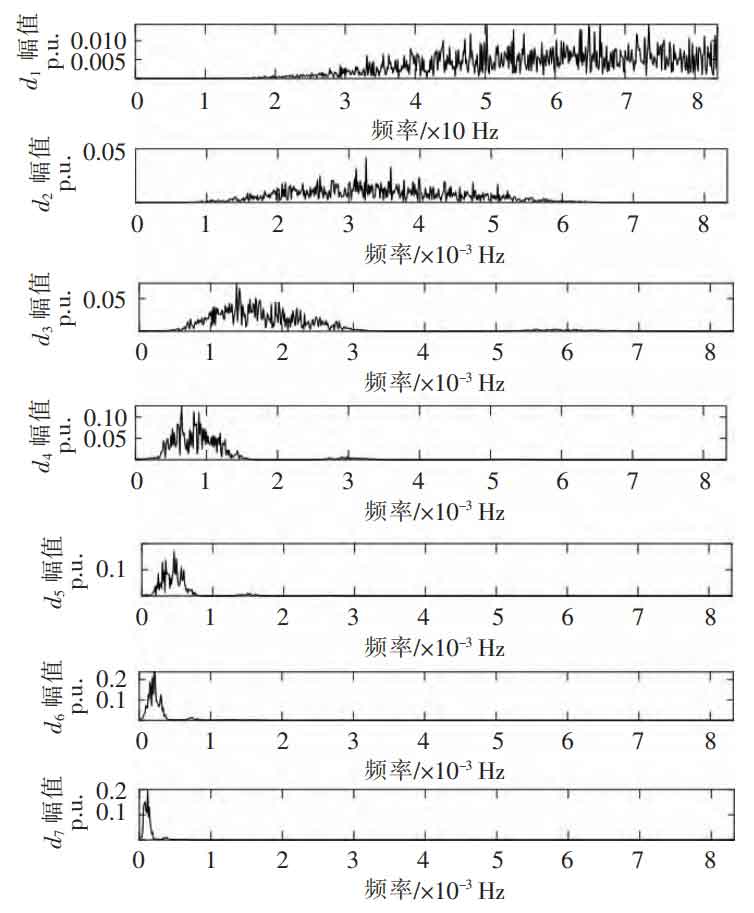
From Figure 3, it can be seen that the frequency range of components contained in the detail signals of layers d1 to d7 gradually decreases, with d1 containing the most high-frequency components and d7 containing the least high-frequency components. With d5 as the boundary, its fluctuation frequency is concentrated at 0.5 × 10⁻³ Hz, then the frequencies of d1 to d5 are 0.5 × 10⁻³-8 × The frequency of 10-3 Hz, d6, d7 is 0-0.5 × 10⁻³ Hz. Based on the frequency regulation characteristics of the energy storage system and traditional units, if the recombination point is set to m, d1~dm will be reorganized and allocated to the energy storage system, and dm+1~d7 will be reorganized and allocated to the thermal power units.
② Analysis of Capacity Allocation Results under Different Reorganization Points
In the capacity allocation method proposed in this article, the energy storage system bears the d1~dm components after the initial signal decomposition, while the thermal power unit bears the dm+1~d7 components, where m is the boundary point for the recombination after the initial signal decomposition. Using the improved sparrow algorithm to assist in solving the capacity allocation optimization model of equation (18), the power, cost, net benefit value, and net benefit growth value configured under different recombination points are shown in Table 2. Figure 4 shows the net benefit value and net benefit growth value under different restructuring points.
| m | Prate /MW | Erate /MW·h | Net benefit/yuan | Net benefit growth value/yuan |
| 1 | 3.287 | 0.151 | -15 021 | – |
| 2 | 5.012 | 0.269 | -3 043 | 11 978 |
| 3 | 9.511 | 0.425 | 10 689 | 13 732 |
| 4 | 12.698 | 0.746 | 25 126 | 14 437 |
| 5 | 14.956 | 1.102 | 40 624 | 15 498 |
| 6 | 17.007 | 1.255 | 53 331 | 12 707 |
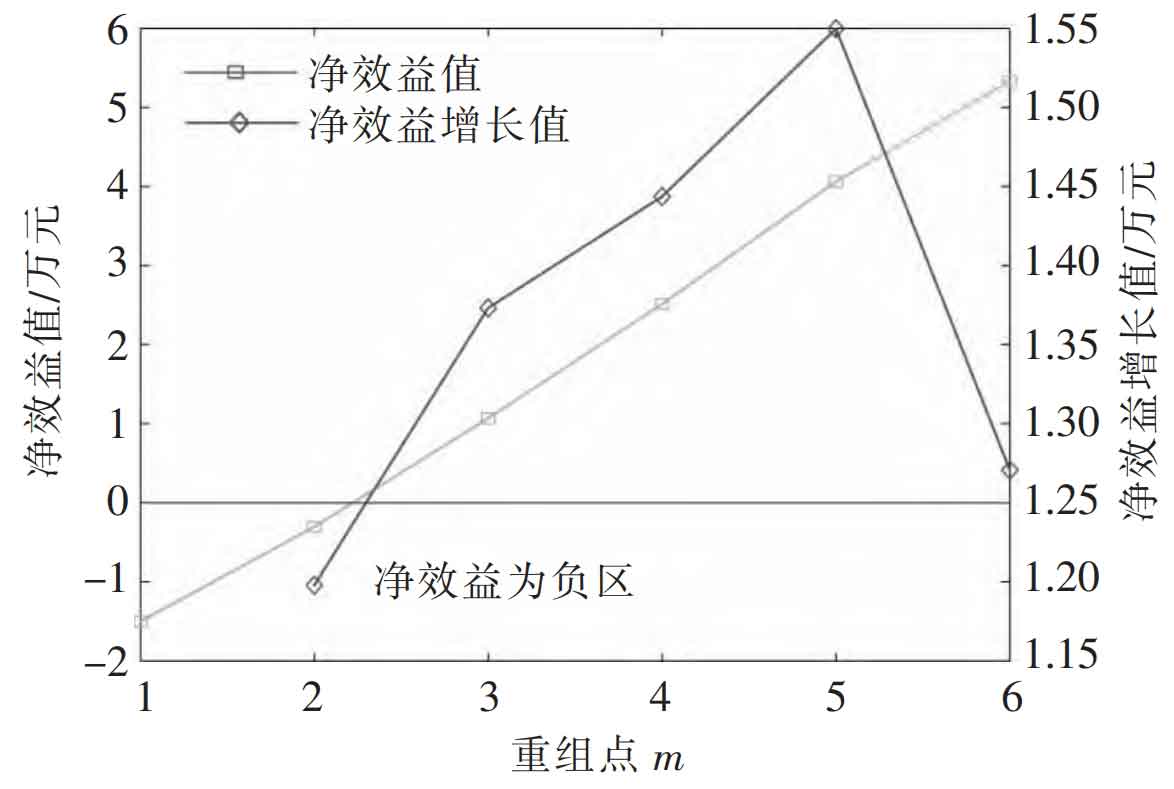
From Table 2, it can be seen that as the value of m increases, the more frequency modulation component instructions are allocated to the energy storage system, and the more power and capacity it requires to be configured. From Figure 4, it can be seen that when the m value is small (m=1 or 2), the overall net benefit of energy storage combined with thermal power units participating in frequency regulation is negative. This is because the initial investment cost of energy storage is high, and the various benefits of energy storage participating in frequency regulation are related to the power configured for energy storage; When the m value is small, that is, there are fewer frequency modulation instructions assigned to the energy storage system, the benefits obtained from energy storage participating in frequency modulation cannot offset the high investment cost of the energy storage system, so the net benefit is negative. As m increases, the net benefits obtained from energy storage participating in frequency modulation gradually increase. However, when m reaches 5, the growth value of net benefits begins to decrease. This is because the initial investment cost of energy storage also increases with m, which restricts the growth of net benefits and leads to a gradual slowdown in the growth value of net benefits and a decreasing trend.
③ Analysis of frequency modulation performance indicators under different recombination points
This article calculates the values of frequency modulation performance indicators under different recombination points, and the specific results are shown in Table 3. The trend of change is shown in Figure 5.
| m | K1 | K2 | K3 | K4 |
| 1 | 1.42 | 1.35 | 1.31 | 2.51 |
| 2 | 1.67 | 1.44 | 1.42 | 3.41 |
| 3 | 1.90 | 1.70 | 1.65 | 5.33 |
| 4 | 1.92 | 1.73 | 1.69 | 5.61 |
| 5 | 1.95 | 1.74 | 1.74 | 5.90 |
| 6 | 1.95 | 1.74 | 1.74 | 5.90 |
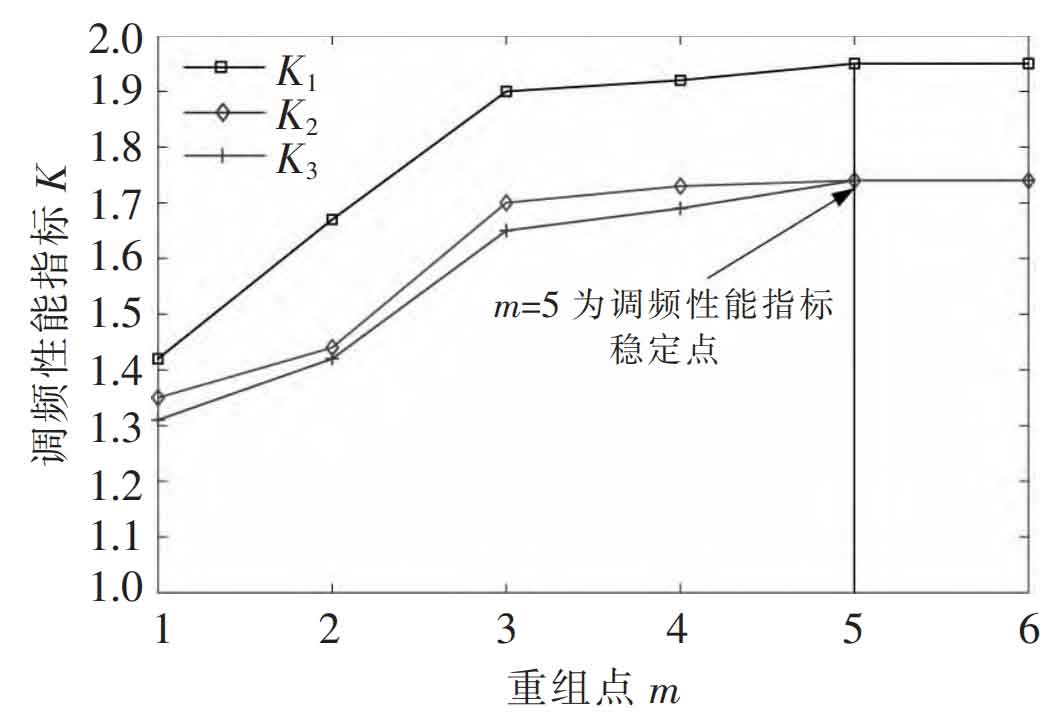
From Figure 5, it can be seen that the energy storage system can effectively improve the frequency modulation performance indicators of the system. As the recombination point m increases, the energy storage power gradually increases, and the corresponding frequency modulation performance indicators also increase. When the recombination point m reaches 5, the frequency modulation performance indicators K1, K2, and K3 of the system are basically maintained at a stable level. This is because at the beginning, as the input energy storage power increases, it can compensate for the shortcomings of frequency regulation in thermal power units and improve the overall frequency regulation effect of the joint frequency regulation system; When m reaches 5, the frequency modulation performance of the entire system has basically reached its limit. At this point, even if the input energy storage capacity continues to increase, it will not significantly improve the frequency modulation effect, but will only increase the frequency modulation cost of energy storage. The impact on K1 is more significant than K2 and K3, because the energy storage system has a fast response speed. After receiving the frequency modulation command from the power grid dispatch center, it can quickly change the output of the unit to track the frequency modulation command demand through charging and discharging. Generally, the adjustment time is in the second level, which is much higher than the adjustment time of thermal power units. In the actual adjustment process, in order to ensure the stable operation of the power grid, a limit value is set for the short-term output power of the energy storage system; At the same time, due to the addition of energy storage, the adjustment speed of the entire system will increase, and the frequency adjustment process will end prematurely, leading to an earlier time for calculating the adjustment accuracy, which in turn makes the adjustment accuracy index not as significantly improved as the adjustment speed index.
Based on the above analysis, when m=5, the frequency modulation performance index Kp of the entire joint frequency modulation system is the best; When m>5, the net benefit growth value of the joint frequency modulation system gradually decreases and the frequency modulation performance index Kp remains unchanged. Therefore, this article selects m=5 as the dividing point for the initial instruction decomposition and reorganization, that is, the sum of d1~d5 reorganization is allocated to the energy storage system, and the sum of d6 and d7 reorganization is allocated to the thermal power unit. This not only meets the requirements of frequency regulation performance, but also has relatively superior economic efficiency. Figures 6 and 7 show the output of the energy storage system and thermal power unit in response to ACE commands when m=5, respectively.
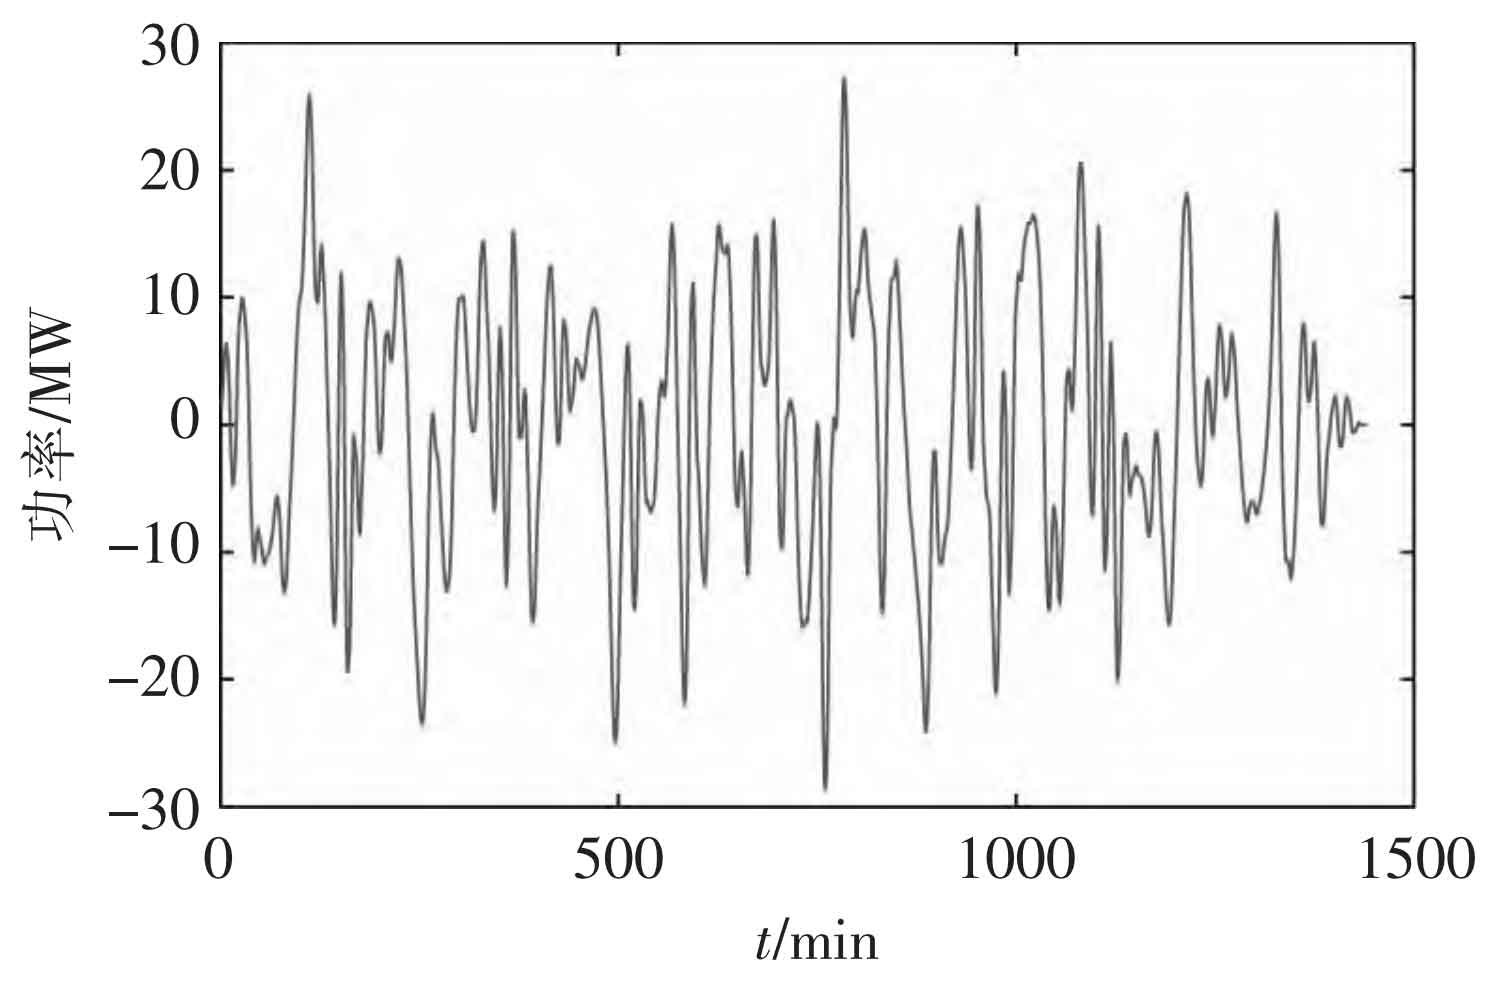
From Figures 6 and 7, it can be seen that the output fluctuation frequency of the energy storage system is fast and the amplitude is small, fully leveraging its characteristics of fast response speed and flexible adjustment; The output fluctuation frequency and amplitude of thermal power units are slow and large, fully leveraging their large frequency regulation capacity. Therefore, the configuration method proposed in this article fully utilizes the frequency modulation technology characteristics of both, improves the frequency modulation effect of the entire system, and proves that the configuration results in this article are reasonable and effective.
5.Conclusion
This article proposes a capacity allocation method for energy storage participating in secondary frequency regulation of the power grid based on wavelet transform with the goal of maximizing net benefits. Firstly, the initial ACE signal is decomposed using wavelet transform, and the spectral characteristics of each decomposed signal are analyzed using the Fast Fourier Transform method; Then, a daily frequency regulation cost model is established by comprehensively considering the initial investment cost, operation and maintenance cost, and frequency regulation cost of the energy storage system. The daily revenue model is established by taking into account environmental benefits, increased power generation benefits of the unit, and adjusted power benefits. A model for energy storage participation in frequency regulation capacity allocation is established with the objective function of maximizing net benefits; Finally, based on the measured ACE signal, simulation verification was conducted, and the frequency modulation performance indicators from the current “two detailed rules” were introduced as the technical indicators of the configuration results in this paper. The economic and technical aspects of the configuration results at different recombination points were analyzed. The simulation results show that the configuration method proposed in this article can maximize the net benefit of frequency modulation of the entire system while ensuring the optimal frequency modulation effect.