
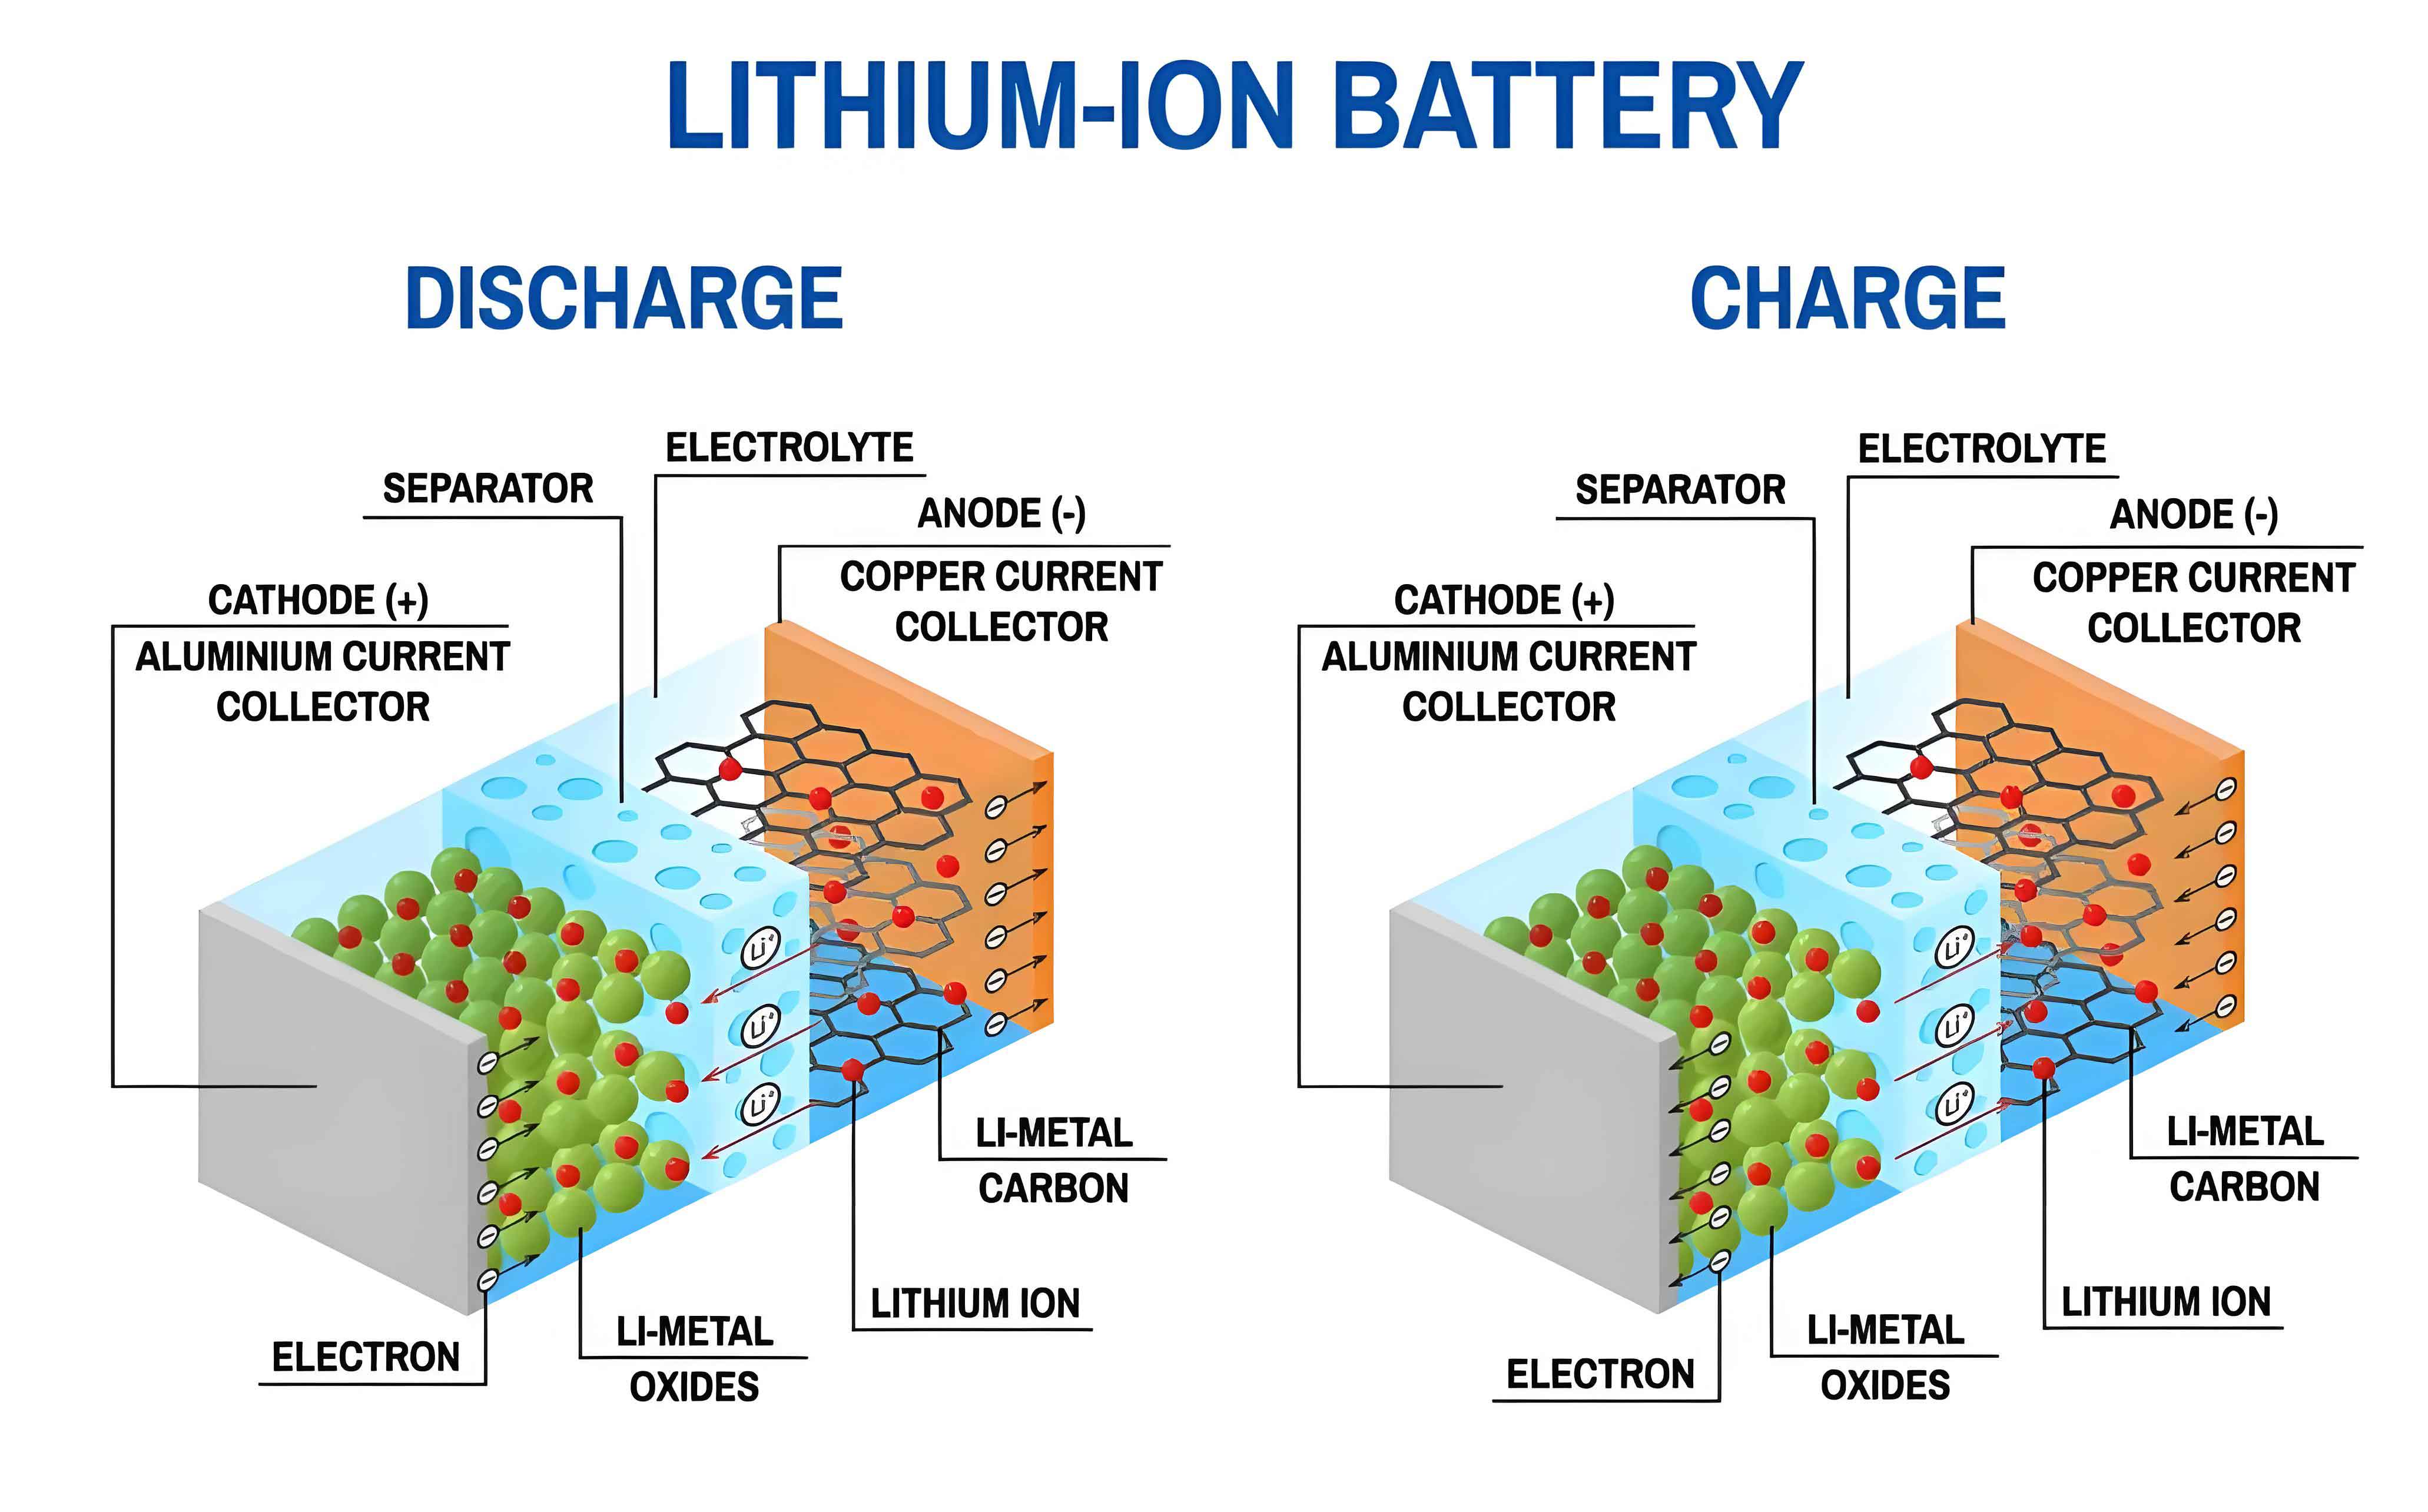
The global transition towards renewable energy systems is fundamentally constrained by the intermittent and variable nature of primary sources like solar and wind. The ability to store and dispatch energy on demand is therefore the critical technological linchpin. Among various storage solutions, lithium-ion battery-based Energy Storage Power Plants (ESPPs) have emerged as a leading candidate due to their high energy density, decreasing cost, and modular scalability. However, the widespread deployment of large-scale lithium-ion battery energy storage systems introduces significant safety and reliability challenges. The organic electrolytes and electrode materials within lithium-ion batteries are inherently flammable and can undergo exothermic reactions. Over long-term operation, degradation mechanisms such as lithium plating, solid electrolyte interphase (SEI) growth, internal short circuits, and thermal runaway can lead to catastrophic failures, including fires and explosions. Consequently, the development of advanced, intelligent, and holistic monitoring and evaluation frameworks is not merely beneficial but essential for ensuring the safe, efficient, and long-lasting operation of lithium-ion battery energy storage infrastructure.
Traditional monitoring methods for lithium-ion battery energy storage stations often rely on threshold-based alarms for individual parameters like voltage, current, or temperature. These approaches struggle with several intrinsic limitations: (1) difficulty in fusing heterogeneous, multi-source data (voltage, current, temperature, gas) that are often temporally and spatially misaligned; (2) inability to effectively capture the complex, nonlinear degradation trajectories of lithium-ion batteries; and (3) lack of predictive capability for early-stage fault identification. To address these gaps, we propose a comprehensive, five-layer AI-driven monitoring and evaluation framework. This framework systematically integrates machine learning and deep learning techniques to establish a multi-level feature extraction and fusion mechanism, enabling precise state assessment and proactive safety management for lithium-ion battery energy storage power plants.
1. Multimodal Data Feature Extraction Layer
The foundation of our framework is the meticulous extraction of discriminative features from four primary data modalities: voltage, current, temperature, and gas. Each modality reveals different aspects of the lithium-ion battery’s state, and their synergistic analysis is key.
1.1 Voltage Time-Series Feature Extraction
Voltage profiles during charge/discharge cycles contain rich information about the electrochemical state and degradation of a lithium-ion battery. Traditional methods, like using Savitzky-Golay filters for Incremental Capacity Analysis (ICA), suffer from time-lag and an inability to model long-term temporal dependencies. To overcome this, we employ a Bidirectional Long Short-Term Memory (BiLSTM) network.
The BiLSTM processes the raw voltage sequence $$V = \{v_1, v_2, …, v_T\}$$. Its forward and backward layers concurrently learn dependencies from past and future contexts within a sequence, crucial for analyzing relaxation phases. The core LSTM cell operations are defined by:
$$
\begin{aligned}
f_t &= \sigma(W_f \cdot [h_{t-1}, x_t] + b_f) \\
i_t &= \sigma(W_i \cdot [h_{t-1}, x_t] + b_i) \\
\tilde{C}_t &= \tanh(W_C \cdot [h_{t-1}, x_t] + b_C) \\
C_t &= f_t * C_{t-1} + i_t * \tilde{C}_t \\
o_t &= \sigma(W_o \cdot [h_{t-1}, x_t] + b_o) \\
h_t &= o_t * \tanh(C_t)
\end{aligned}
$$
where $$f_t, i_t, o_t$$ are the forget, input, and output gates; $$C_t$$ is the cell state; $$h_t$$ is the hidden state; and $$x_t$$ is the input at time $$t$$. The BiLSTM’s final hidden states are concatenated to form a comprehensive 128-dimensional temporal encoding vector $$F_V$$ that captures nuanced degradation features like voltage relaxation time variance and incremental capacity peak shifts, which are highly correlated with the capacity fade of the lithium-ion battery.
1.2 Current Dynamic Feature Extraction
Current profiles reflect the operational load and internal kinetics. Simple statistical features (mean, RMS) fail to capture morphological differences under varying C-rates. We utilize a hybrid approach combining Dynamic Time Warping (DTW) and Random Forest (RF).
DTW finds the optimal alignment path between two current sequences $$I_{ref}$$ and $$I_{test}$$ by minimizing the cumulative distance:
$$
DTW(I_{ref}, I_{test}) = \min_{\pi} \sqrt{\sum_{(i, j) \in \pi} (I_{ref}(i) – I_{test}(j))^2}
$$
where $$\pi$$ is the warping path. This allows for phase-invariant comparison. Multiple DTW-derived distances against healthy baseline profiles at different C-rates form an initial feature set. An RF regressor, which builds an ensemble of decision trees, is then trained to predict state-of-health (SOH) using these and other statistical features. The Gini importance from the RF is used to select the top 5 most relevant features (e.g., DTW distance at 1C, charge curve kurtosis), which are then encoded into a 5-dimensional vector $$F_I$$.
1.3 Temperature Spatial Feature Extraction
Temperature is a critical safety indicator for lithium-ion battery packs. Point-sensor thresholds are inadequate for detecting localized hot spots or evolving thermal gradients. We implement a lightweight Depthwise Separable Convolutional Neural Network (DS-CNN) enhanced with Squeeze-and-Excitation (SE) attention blocks.
The DS-CNN takes a 2D spatial temperature map $$T_{map} \in \mathbb{R}^{H \times W}$$ from a sensor array as input. Depthwise separable convolution factorizes a standard convolution into a depthwise convolution (applying a single filter per input channel) and a pointwise convolution (1×1 convolution), drastically reducing parameters:
$$
\text{Standard Conv Output: } G_{k, i, j} = \sum_{c, m, n} K_{k, c, m, n} \cdot F_{c, i+m, j+n}
$$
$$
\text{DS-Conv: } \hat{F}_{c, i, j} = \sum_{m, n} \hat{K}_{c, m, n} \cdot F_{c, i+m, j+n}; \quad G_{k, i, j} = \sum_{c} P_{k, c} \cdot \hat{F}_{c, i, j}
$$
The SE block performs channel-wise feature recalibration. It first squeezes global spatial information via global average pooling to produce a channel descriptor $$z_c$$, then uses a simple gating mechanism with sigmoid activation to generate channel-wise weights $$s_c$$:
$$
z_c = \frac{1}{H \times W} \sum_{i=1}^{H} \sum_{j=1}^{W} u_c(i, j), \quad s = \sigma(W_2 \cdot \delta(W_1 \cdot z))
$$
The network outputs key thermal metrics such as maximum temperature differential ($$\Delta T_{max}$$), hotspot diffusion rate, and thermal imbalance index, forming a 6-dimensional thermal feature vector $$F_T$$. This approach enables 3D thermal field reconstruction and adaptive sensitivity to aging-related thermal changes in the lithium-ion battery module.
1.4 Gas Sensor Data Feature Extraction
Electrolyte decomposition and failure events in a lithium-ion battery release characteristic gases (e.g., CO, H2, CH4, C2H4). We perform a multi-dimensional joint analysis in time and frequency domains.
- Time-domain: Features include concentration rate-of-change ($$d[Gas]/dt$$), release duration, and time-to-threshold for multiple gases. A dual-threshold system is used for fast-evolving gases like H2.
- Frequency-domain: Short-Time Fourier Transform (STFT) is applied to detect periodic release patterns associated with specific failure modes (e.g., 3-5 Hz oscillations in CO linked to intermittent lithium plating):
$$
STFT\{x(t)\}(\tau, \omega) = \int_{-\infty}^{\infty} x(t) w(t-\tau) e^{-j\omega t} dt
$$
These extracted features (e.g., H2 spike magnitude, CO oscillation frequency) are encoded into a 12-dimensional vector $$F_G$$, providing a unique chemical signature of the lithium-ion battery’s internal state.
| Data Modality | Traditional Method Limitation | Proposed AI Method | Key Extracted Features (Vector Dimension) |
|---|---|---|---|
| Voltage | Time-lag, misses long-term dependencies | Bidirectional LSTM (BiLSTM) | Temporal encoding of relaxation, IC curve shifts (128D) |
| Current | Misses morphological shape under varying loads | DTW alignment + Random Forest feature selection | Phase-invariant shape distance, key statistical moments (5D) |
| Temperature | Low spatial resolution, static thresholds | Lightweight DS-CNN with SE attention | ΔT_max, hotspot diffusion rate, thermal imbalance (6D) |
| Gas | Single gas concentration thresholding | Time-frequency joint analysis (STFT, derivative analysis) | Gas release rate, duration, oscillation frequency (12D) |
2. Multimodal Data Feature Fusion Layer
The extracted feature vectors ($$F_V, F_I, F_T, F_G$$) are heterogeneous in dimension and physical meaning. Simple concatenation is suboptimal as it ignores the dynamic interplay and relative importance between modalities under different operational contexts (e.g., low-temperature charging vs. high-temperature discharging). We propose a Cross-Modal Multi-Head Attention Fusion Network.
First, each modality’s feature vector is projected into a common latent space of dimension $$d_k=32$$ using learnable linear transformations to obtain Queries (Q), Keys (K), and Values (V):
$$
Q_m = F_m W^Q_m, \quad K_m = F_m W^K_m, \quad V_m = F_m W^V_m, \quad \text{for } m \in \{V, I, T, G\}
$$
For four modalities, we have 16 attention heads, each computing the interaction between one modality as query and another as key/value. The scaled dot-product attention for head $$h_{ij}$$ (query from modality $$i$$, key from modality $$j$$) is:
$$
\text{Attention}(Q_i, K_j, V_j) = \text{softmax}\left(\frac{Q_i K_j^T}{\sqrt{d_k}}\right) V_j
$$
The outputs from all heads are concatenated and linearly projected to produce a refined feature vector for each modality. Finally, these refined vectors are concatenated to form the ultimate 576-dimensional fused feature vector $$F_{fused}$$:
$$
F_{fused} = \text{Concat}(\tilde{F}_V, \tilde{F}_I, \tilde{F}_T, \tilde{F}_G)
$$
This mechanism allows dynamic, context-aware weighting. For instance, if a sudden H2 spike is detected ($$F_G$$ anomaly), the attention weights from the gas modality to the temperature modality ($$G \rightarrow T$$) will automatically increase, enhancing the model’s focus on thermal response and enabling early, synergistic warning for the lithium-ion battery system.
| Query Modality | Key/Value Modality | Interaction Purpose | Example Dynamic Weight Change |
|---|---|---|---|
| Gas (G) | Temperature (T) | Correlate gas release with thermal response | Weight ↑ from 0.18 to 0.51 on H2 spike |
| Current (I) | Voltage (V) | Assess internal impedance/polarization | Weight ↓ to 0.07 during steady low-ripple operation |
| Temperature (T) | Voltage (V) | Link temperature rise to voltage relaxation kinetics | Weight ↑ during fast charge to monitor for lithium plating |
| Voltage (V) | Current (I) | Validate capacity estimation under load | Consistently high weight during discharge capacity check |
3. Battery Capacity Attenuation Prediction Layer
This layer focuses on predicting the medium-to-long-term degradation trajectory of the lithium-ion battery, specifically its State-of-Health (SOH), and its instantaneous power delivery capability, or State-of-Power (SOP).
SOH Estimation: We use a Gated Recurrent Unit (GRU) network to model the temporal evolution of degradation. The GRU, a simpler variant of LSTM, processes a sequence of the fused feature vectors $$\{F_{fused}^{(t-L)}, …, F_{fused}^{(t)}\}$$ from the last L cycles. Its update and reset gates control the flow of information:
$$
\begin{aligned}
z_t &= \sigma(W_z \cdot [h_{t-1}, x_t]) \\
r_t &= \sigma(W_r \cdot [h_{t-1}, x_t]) \\
\tilde{h}_t &= \tanh(W \cdot [r_t * h_{t-1}, x_t]) \\
h_t &= (1 – z_t) * h_{t-1} + z_t * \tilde{h}_t
\end{aligned}
$$
The final hidden state $$h_t$$ is passed through a fully connected layer to regress the current capacity retention (SOH), defined as $$SOH(\%) = \frac{C_{actual}}{C_{rated}} \times 100$$.
SOP Evaluation: The maximum allowable charge/discharge power is estimated in real-time using an equivalent circuit model whose parameters (especially internal resistance $$R_{int}$$) are dynamically calibrated. The calibration depends on both the predicted SOH from the GRU and the real-time thermal features ($$F_T$$, specifically $$\Delta T$$):
$$
R_{int}(SOH, \Delta T) = R_{int,0} \cdot f_{aging}(SOH) \cdot f_{thermal}(\Delta T)
$$
$$
SOP_{discharge}(t) = \min\left( \frac{V_{min} – V_{OCV}(t)}{R_{int}(t)}, I_{max} \cdot V(t) \right)
$$
This dual-prediction approach ensures the lithium-ion battery energy storage system operates within safe limits while maximizing its available utility.
4. Implicit Degradation Feature Capture Layer
Some critical failure precursors, like the early-stage growth of lithium dendrites or subtle, non-uniform SEI layer thickening, may not be directly apparent in the fused feature vector $$F_{fused}$$. To capture these latent patterns, we employ a Variational Autoencoder (VAE).
The VAE consists of an encoder that compresses $$F_{fused}$$ into a lower-dimensional latent vector $$z$$, and a decoder that reconstructs the input from $$z$$. The encoder outputs parameters for a probability distribution (typically Gaussian): $$q_{\phi}(z | F_{fused}) = \mathcal{N}(z; \mu_{\phi}, \sigma_{\phi}^2)$$. The decoder is defined by $$p_{\theta}(F_{fused} | z)$$. The VAE is trained by minimizing the loss function, which is the sum of a reconstruction loss and a Kullback-Leibler (KL) divergence regularization term:
$$
\mathcal{L}_{VAE} = \mathbb{E}_{q_{\phi}(z|F_{fused})}[\log p_{\theta}(F_{fused}|z)] – \beta \cdot D_{KL}(q_{\phi}(z|F_{fused}) || p(z))
$$
where $$p(z)$$ is a standard normal prior, and $$\beta$$ is a weighting factor. During operation, the 16-dimensional latent vector $$z$$ for a healthy lithium-ion battery will reside in a compact region of the latent space. Anomalous conditions cause a shift in $$z$$. We compute the Mahalanobis distance $$D_M$$ between the current latent vector $$z_t$$ and the distribution of healthy historical latent vectors:
$$
D_M(z_t) = \sqrt{(z_t – \bar{z}_{healthy})^T S_{healthy}^{-1} (z_t – \bar{z}_{healthy})}
$$
where $$\bar{z}_{healthy}$$ and $$S_{healthy}$$ are the mean and covariance matrix of the healthy latent space. A $$D_M$$ exceeding a threshold (e.g., 3 standard deviations) triggers an alert for an implicit degradation process, enabling very early intervention before the fault becomes apparent in direct measurements.
5. Hierarchical Early Warning and Decision Layer
The final layer translates the insights from all previous layers into actionable intelligence through a three-tiered, color-coded warning system. This hierarchical approach prevents alarm fatigue and guides operators through appropriate, escalating responses.
| Warning Level | Color | Trigger Condition (Examples) | Automatic & Recommended Actions | Objective |
|---|---|---|---|---|
| Observation | Yellow | • Latent vector $$D_M$$ > 2σ but < 3σ • Minor deviation in BiLSTM voltage encoding • SOH prediction shows accelerated fade trend |
• Increase data sampling rate. • Flag cell for enhanced monitoring. • Initiate historical data comparison. • Notify operator for awareness. |
Identify potential risk and increase scrutiny. |
| Intervention | Orange | • $$D_M$$ > 3σ (implicit fault detected). • Gas sensor shows specific pattern (e.g., CO oscillation). • Thermal CNN detects growing, localized hotspot. • SOH falls below a pre-set maintenance threshold. |
• Initiate dynamic derating (e.g., reduce max C-rate by 50%). • Tighten thermal limits (ΔT_max from 5°C to 3°C). • Prepare redundant cell/module for switching. • Schedule immediate offline inspection. |
Mitigate identified fault to prevent progression. |
| Emergency | Red | • Gas release rate exceeds critical threshold (e.g., d[H2]/dt > 500 ppm/s). • Temperature rise rate > 1°C/s (thermal runaway precursor). • Voltage plunge indicating severe internal short circuit. |
• Immediately open the main circuit breaker. • Activate fire suppression system (e.g., C3F7H). • Isolate the affected module via contactors. • Issue site-wide evacuation alert if necessary. |
Prevent catastrophic failure and ensure personnel safety. |
The entire framework operates as a cohesive, closed-loop intelligent system. Data flows from the sensor level through the sophisticated AI feature extraction and fusion pipelines, culminating in clear, hierarchical operational guidance. This enables a shift from reactive, threshold-based monitoring to a proactive, predictive, and health-aware management paradigm for lithium-ion battery energy storage power plants.
Conclusion
The safe and reliable integration of large-scale lithium-ion battery energy storage into the power grid demands a paradigm shift in monitoring technology. The proposed five-layer AI-driven framework addresses the core challenges of multi-source data fusion and nonlinear degradation modeling inherent to complex lithium-ion battery systems. By systematically employing BiLSTM for temporal dynamics, DTW-RF for load-invariant shape analysis, DS-CNN for spatial thermal profiling, and time-frequency analysis for gas evolution, it creates a rich, multi-faceted digital representation of each battery unit. The cross-modal attention fusion mechanism intelligently synthesizes this information, allowing the subsequent GRU and VAE models to accurately predict explicit state-of-health and capture implicit failure precursors. Finally, the tiered warning system translates these sophisticated analytics into clear, actionable protocols for operators. This holistic approach provides a robust and scalable solution, significantly enhancing the safety, longevity, and operational efficiency of lithium-ion battery energy storage power plants, thereby underpinning a more sustainable and resilient energy future.