
Based on the design of a 5 kW household solar off grid energy storage inverter integrated machine, positioned as a household user in Guangzhou, a set of 5 kW household solar off grid energy storage inverter system is designed. Use PVsyst design software to simulate and optimize the feasibility of the project, system design scheme, etc. The goal is to verify whether the system designed in this paper can meet the basic electricity needs of the target household through this scheme.
1. Meteorological data collection
Based on the geographical location of Guangzhou and consulting the database of the National Space Administration of the United States, the average meteorological data of the Guangzhou area in previous years are shown in Table 1. Combined with the analysis of solar radiation data in the Guangzhou area, the average solar panel can generate 3.24 kWh of electricity per kilowatt per day.
| Time | Horizontal average daily radiation (kWh/m2/day) | Average temperature (℃) | Average wind speed (m/s) |
| January | 2.46 | 15.1 | 2.5 |
| February | 2.34 | 16.3 | 2.2 |
| March | 2.31 | 19.0 | 2.2 |
| April | 2.70 | 22.9 | 2.2 |
| May | 3.53 | 26.5 | 2.1 |
| June | 3.64 | 27.9 | 2.2 |
| July | 4.31 | 29.4 | 2.3 |
| August | 3.98 | 29.4 | 2.0 |
| September | 3.91 | 27.4 | 2.3 |
| October | 3.80 | 25.1 | 2.2 |
| November | 3.18 | 20.0 | 2.5 |
| December | 2.70 | 15.4 | 2.3 |
| Annual average | 3.24 | 22.9 | 2.2 |
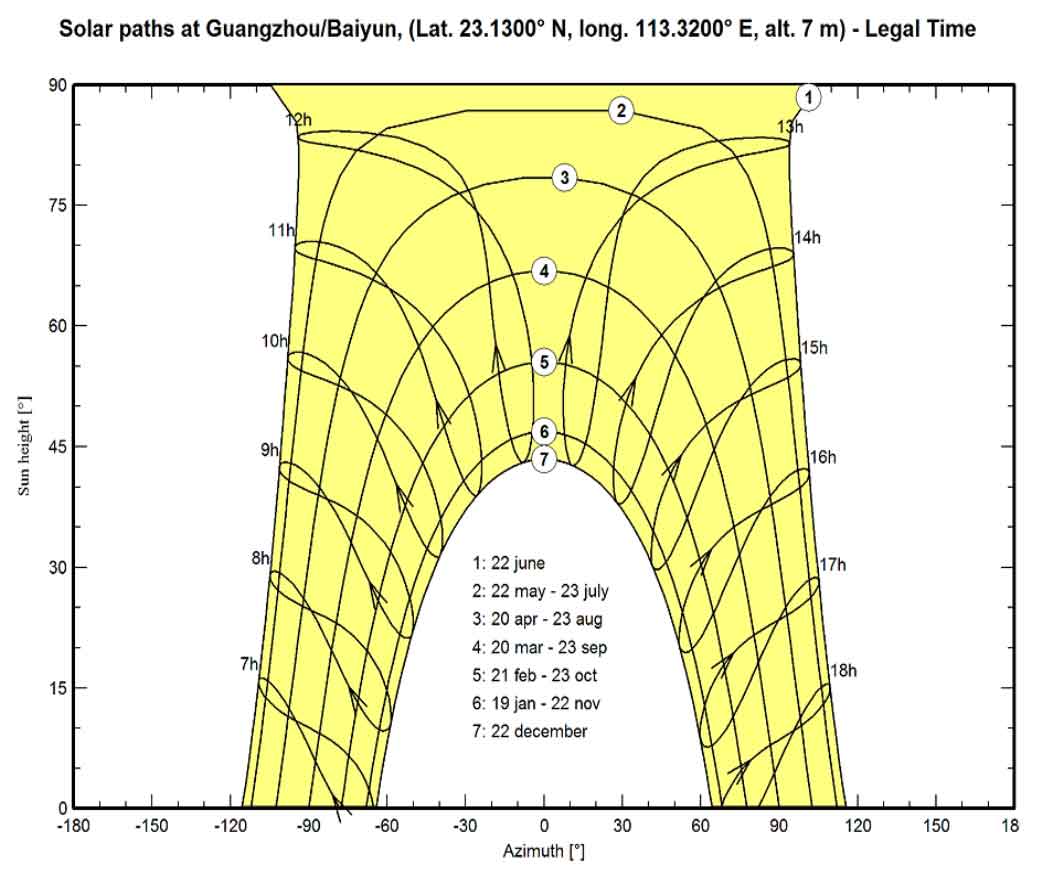
In the Guangzhou area, the sun’s azimuth angle is compared with the sun’s altitude for one year, as shown in Figure 1. The data shown in the chart shows that when the solar panels are installed at a fixed angle on the ground, in order to better obtain solar radiation, the Guangzhou area generally chooses to design the tilt angle of the solar panels to 30 ° and the azimuth angle to 0 °, which is more suitable.
2. Analysis of daily household electricity consumption
For ordinary households, conduct statistics on the daily electricity consumption of electrical equipment, analyze the total usage and electricity usage time, design reasonable solar panel power, inverter power, and energy storage battery capacity.
2.1 Household electricity consumption statistics
The household electrical equipment includes lighting, computers, televisions, refrigerators, washing machines, etc. Based on the daily electricity consumption of the household, the average daily electricity consumption in a year is calculated. By calculating the daily average electricity demand of users through the statistics of the daily average electricity consumption in the project, the capacity of the solar power generation system is designed based on the daily average electricity consumption of users. In engineering, it is a compromise consideration that ensures the basic electricity demand of users while balancing cost factors. According to Table 2, the average daily electricity consumption of households is 12 kWh.
| Electrical equipment | Quantity | Power (W) | Average daily electricity consumption time (H/d) | Average daily electricity consumption (Wh/d) |
| Lighting lamp | 5 | 10 | 6 | 300 |
| TV/Computer | 1 | 550 | 2 | 1100 |
| Refrigerator | 1 | 50 | 24 | 1200 |
| Air conditioning | 1 | 1100 | 4 | 4400 |
| Washing machine | 1 | 750 | 2 | 1500 |
| Other | 1 | 700 | 5 | 3500 |
| Total daily electricity consumption | 12000 |
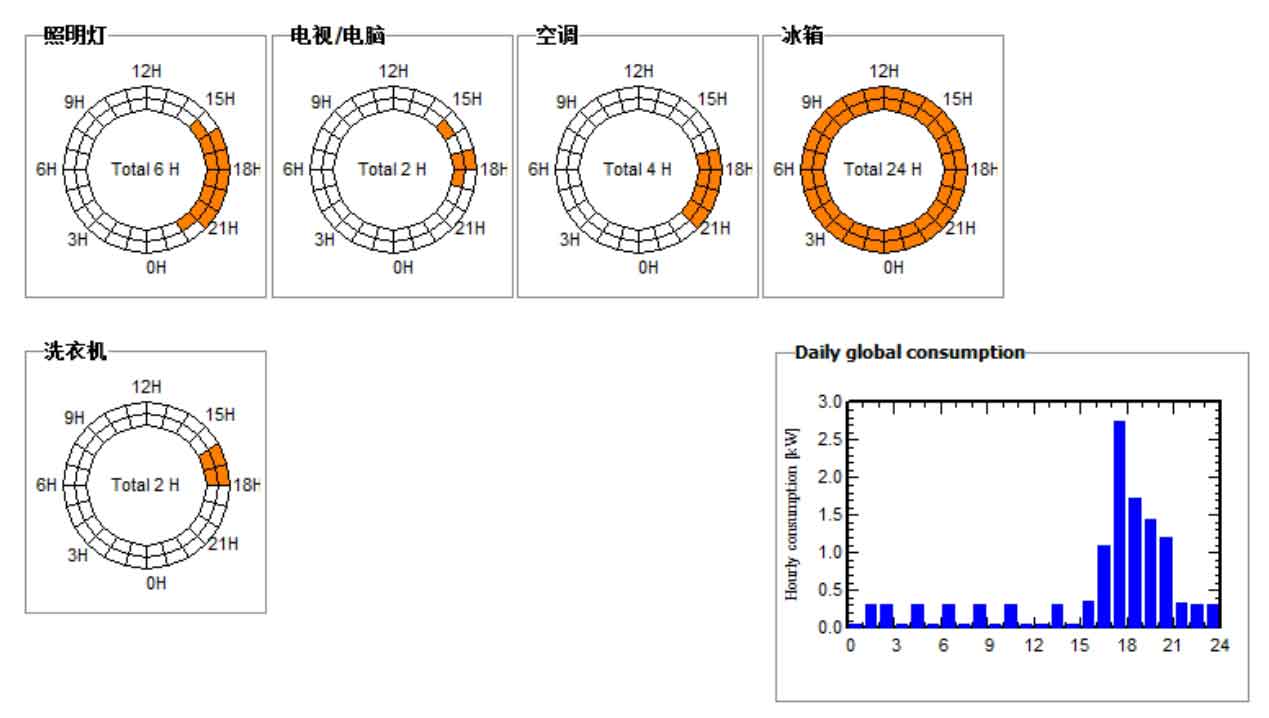
Conduct statistical analysis on the distribution of daily electricity consumption time periods in households. As analyzed in Figure 2, most household electricity consumption is concentrated around 6 o’clock, with a maximum instantaneous power of around 3000 W.
2.2 Composition of computing system
(1) Calculate solar module demand
Assuming the average daily electricity demand is W, the average peak daily sunshine hours are H, and the solar module power is P, the correction factor is:
In the formula
K1- attenuation coefficient of long-term operation of the component, taken as 0.8;
K2- inverter efficiency, taken as 0.9 or based on manufacturer data;
K3- Correction coefficient for the orientation and tilt angle of the photovoltaic array, taken as around 0.9.
According to the formula, the component power is calculated as:

The average daily electricity demand calculated in the previous text is 12 kWh, and the average daily peak sunshine duration H is 3.24 hours. The calculated solar module power demand is:
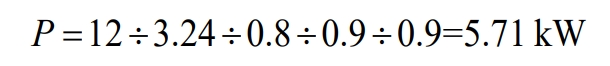
The system requires a 5.71 kW component.
(2) Calculate the demand for energy storage batteries
Assuming the battery discharge depth L, system voltage V, backup time D, and battery capacity Q, the average daily electricity demand is:
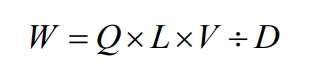
According to the formula, the expression for battery capacity can be obtained, as shown in the formula.

If the average daily household electricity demand is 12 kWh, taking a battery discharge depth of 0.9, a system voltage of 48 V, and a standby time of 2 days, the calculated battery capacity demand is:

In summary, choosing a 556 Ah/48 V battery pack can meet the system requirements.
2.3 Simulation results
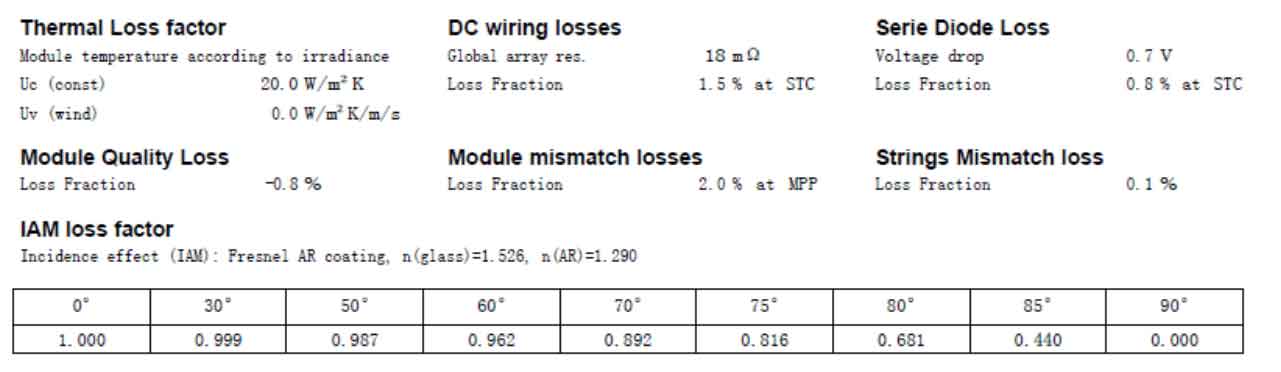
Set the tilt angle of the solar panel to 30 ° and the azimuth angle to 0 °. During the process of generating electricity from solar panels to providing it to the all-in-one machine for charging and storage, there will be a series of losses, as shown in Figure 3, including environmental temperature factors, internal resistance consumption of wires, conduction loss of anti backoff diodes, quality deviation of modules, and differences in controller MPPT accuracy, all of which need to be considered in system design.
The composition of the power generation system is configured according to Figure 4:
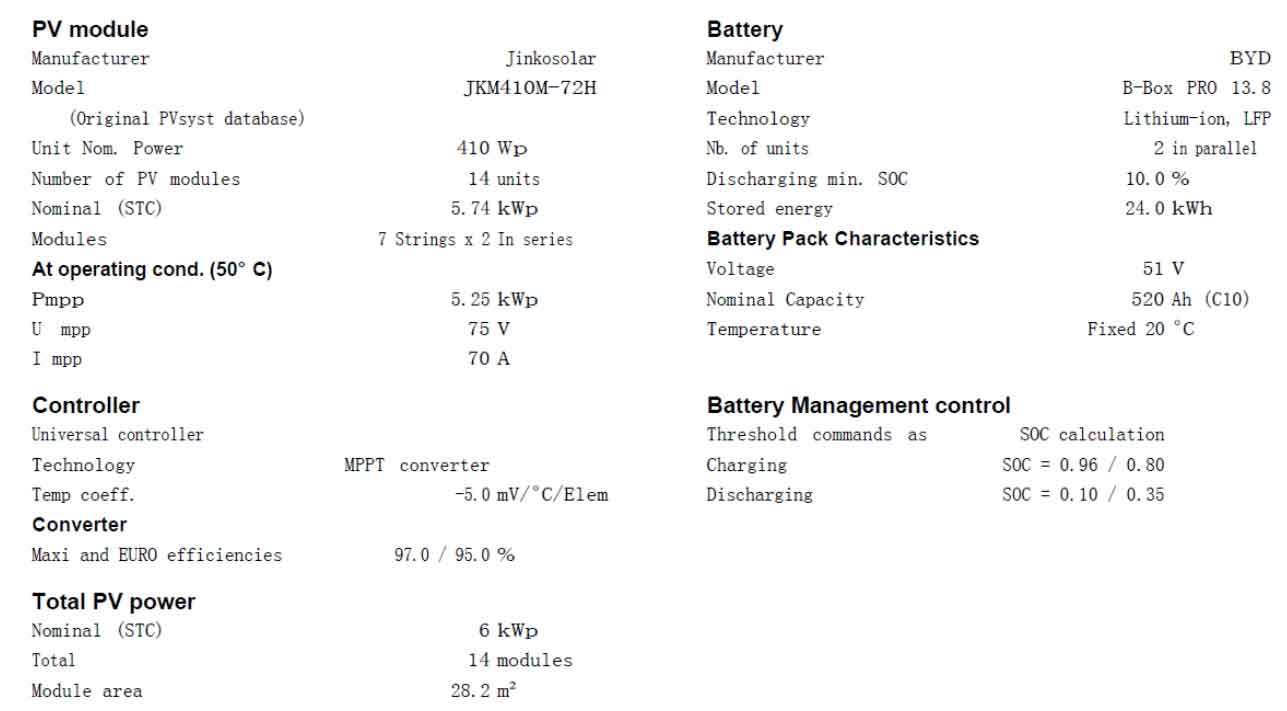
(1) According to the calculation results, this system requires a total of 5.71 kWp of solar cell modules. Choose Jinkosolar’s JKM410M-72H series 410 Wp components, with a total of 14 pieces and a total power of 5.74 kWp.
(2) According to the formula calculation, a battery pack of 556 Ah/48 V needs to be selected. Choose the BYD B-BOX PRO 13.8 series lithium battery, with a single 260 Ah/51 V battery and two parallel batteries.
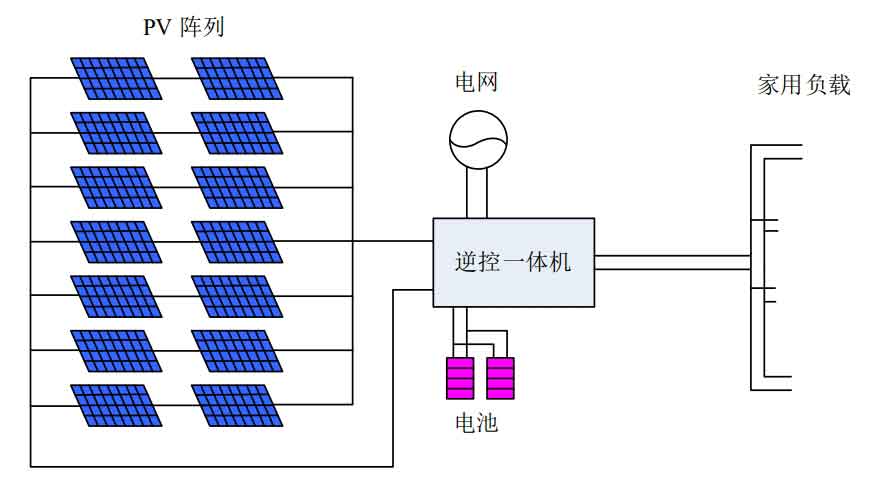
According to the configuration calculation, the energy storage power supply system is shown in Figure 5, which includes 14 410 Wp solar modules connected in 2 series and 7 parallel, two sets of 51 V/510 Ah energy storage batteries in parallel, and a 5 kW off grid inverter energy storage integrated machine.
3. Analysis of system application situation
Due to seasonal reasons, the amount of electricity generated by solar panel power generation is extremely uneven throughout the year, while also considering cost factors. It is not possible to allocate too much surplus energy storage batteries. Analyze whether the system configuration is reasonable by analyzing the average usage of the system over the past year.
| Time | Average solar power generation (kWh) | Unutilized solar energy (kWh) | Municipal supplementary energy (kWh) | Solar energy provides energy (kWh) | Actual energy consumption by users (kWh) | Solar power generation guarantee rate(η) |
| January | 449.0 | 98.4 | 33.0 | 339.0 | 372.0 | 0.911 |
| February | 334.4 | 14.5 | 34.0 | 302.0 | 336.0 | 0.899 |
| March | 336.2 | 46.7 | 105.8 | 266.2 | 372.0 | 0.716 |
| April | 359.0 | 45.5 | 61.5 | 298.5 | 360.0 | 0.829 |
| May | 452.8 | 103.7 | 33.7 | 338.3 | 372.0 | 0.909 |
| June | 439.6 | 81.4 | 24.0 | 336.0 | 360.0 | 0.933 |
| July | 536.3 | 140.9 | 0.0 | 372.0 | 372.0 | 1.000 |
| August | 543.5 | 163.4 | 3.1 | 368.0 | 372.0 | 0.992 |
| September | 572.1 | 198.6 | 12.9 | 347.1 | 360.0 | 0.964 |
| October | 626.1 | 234.5 | 0.0 | 372.0 | 372.0 | 1.000 |
| November | 571.2 | 191.4 | 0.0 | 360,0 | 360.0 | 1.000 |
| December | 542.4 | 175.3 | 9.8 | 362.2 | 372.0 | 0.974 |
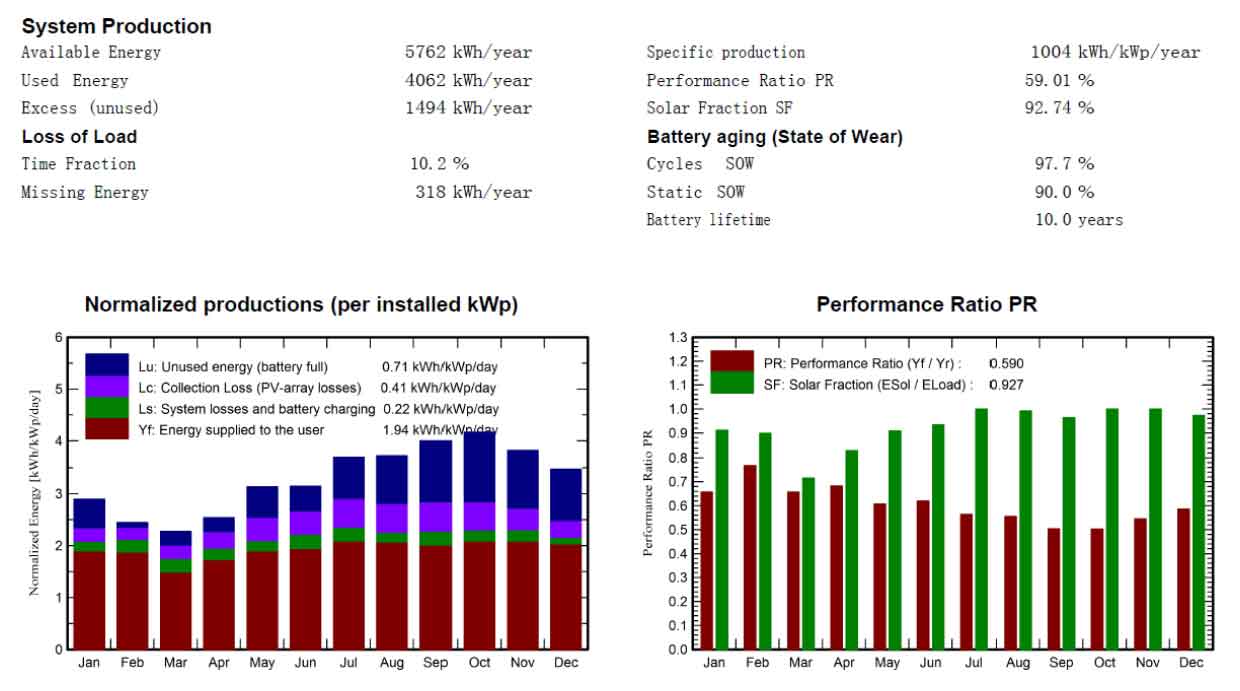
| Year | 5762.5 | 1494.4 | 317.8 | 4062.2 | 4380.0 | 0.927 |
According to the statistical results in Table 3, the annual solar energy guarantee electricity consumption rate is 97.2%, which can basically cover the daily use of users. At the same time, there were cases where the coverage rate was below 90% in February, March, and April. Comparing the meteorological conditions in February, March, and April, it can be found that solar radiation is the weakest throughout the year, with more continuous rainy days, and the energy stored by energy storage batteries cannot guarantee supply. In the future, if funds permit, the battery capacity can be increased to improve the supply guarantee rate. Figures 6 analyze the power consumption of the system, the utilization rate of solar module power generation, and the utilization rate of batteries. The unused solar energy generated 318 kWh throughout the year, with a solar power supply rate of 92.74% and a battery recycling rate of 97.7%.
Solar power generation guarantee rate:
η = Actual energy consumption by users ÷ energy provided by solar power generation
In Figure 7, it can be seen that the unused power generation Lu per kWh of photovoltaic modules per day due to full battery charging is 0.71 kWh, and the component loss Lc per kWh per day due to temperature, dust, component resistance loss, component aging, wire heating, and other factors is 0.41 kWh, Due to battery charging and discharging as well as inverter efficiency, the conversion system loss Ls is 0.22 kWh per kWp per day. The actual average effective power generation per kWp per day is 1.94 kWh. The solar energy utilization rate (PR) of the system is 59%, and the user’s usage achieved a satisfaction rate (SF) of 92.7% through solar power generation.
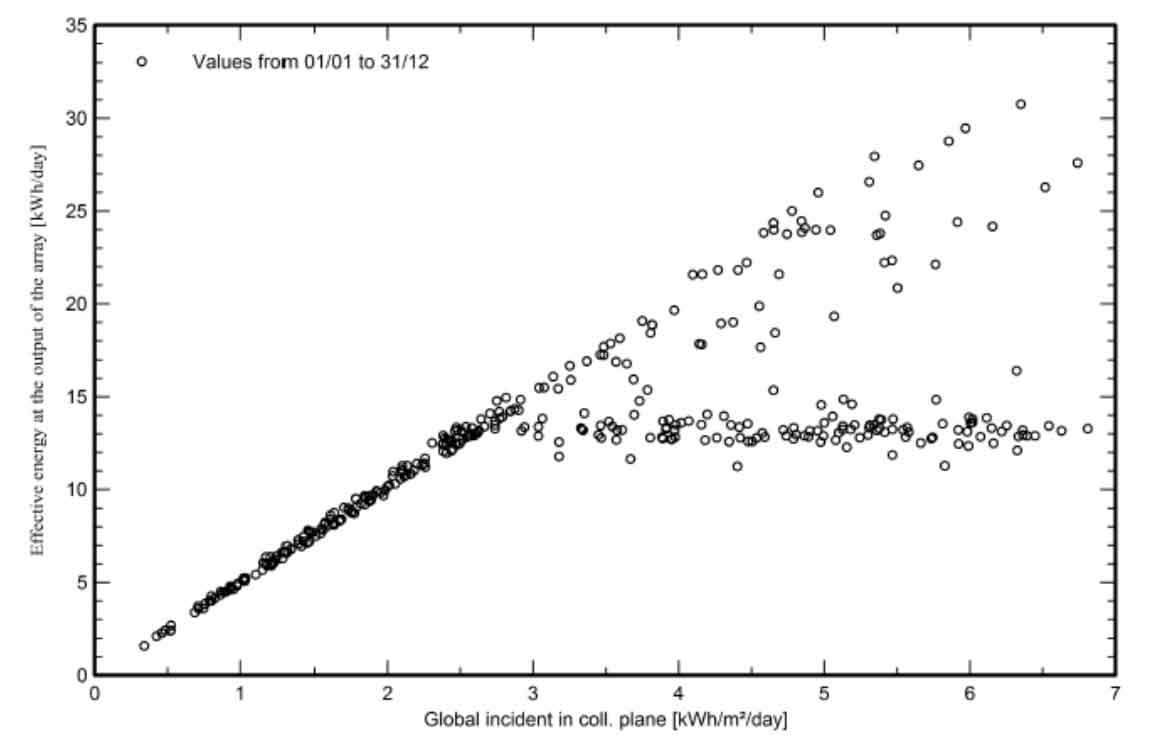
Based on the statistics of the effective energy emitted by solar panels every day, analyze the utilization efficiency of the system’s solar panels, and provide reference basis for improving the utilization efficiency of solar panel power generation.
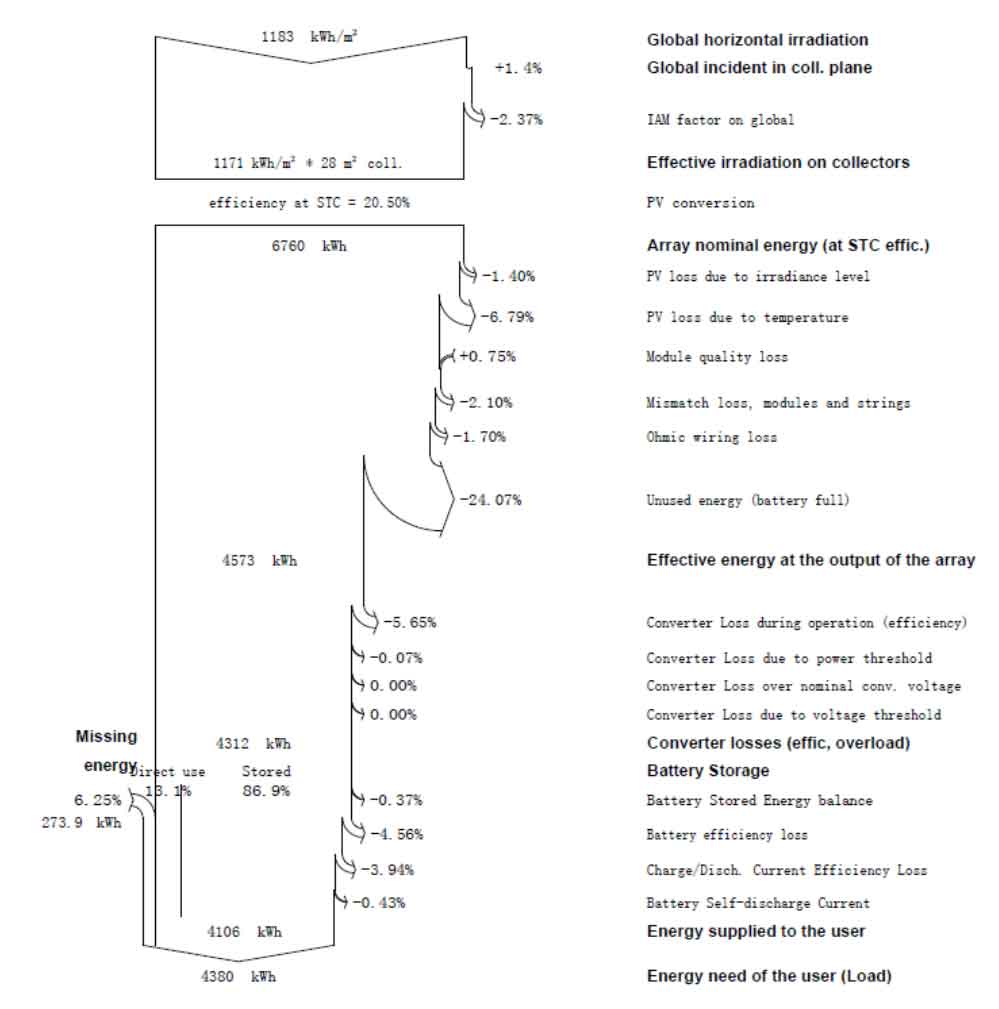
In the daily work of the entire system, various components will generate losses that deviate from the standard value. As shown in Figure 8, analyzing the various losses of the system, it can be found that there are still relatively many power generation losses caused by factors such as environmental temperature, solar radiation, component quality, and unused batteries each year. Among them, the losses caused by environmental temperature are 6.79%, and the losses caused by weak solar radiation are 1.4%, The loss caused by component quality is positive 0.75%, and the loss caused by the battery being fully charged but not utilized is 24.07%.
4. Summary
Using PVsyst design software, with a 5 kW solar off grid inverter energy storage integrated machine as the core, a 5 kW household solar off grid inverter energy storage system was designed based on the analysis of meteorological statistical data in Guangzhou and the actual daily use of household electricity by the target user. By analyzing the average monthly electricity consumption of households, the system designed in this paper can guarantee 92.7% of the target household’s electricity demand throughout the year, achieving the design goal.