
The development of large-scale photovoltaic (PV) bases in the western desert and Gobi regions of China is a crucial initiative under the “Dual Carbon” goals. Given the geographical imbalance between rich solar resources and primary load centers, Voltage Sourced Converter Based High Voltage Direct Current (VSC-HVDC) transmission has become a vital solution for delivering bulk PV power over long distances. These new-generation PV clusters are characterized by a higher penetration of power electronic devices, longer transmission lines, and a weaker local grid compared to existing bases. Particularly on the sending-end side, the wide distribution of PV power stations results in weak electrical connections and long electrical distances. Following a fault, the dynamic response of the sending-end system becomes considerably more complex due to the control interactions of numerous power electronic devices, fundamentally altering system behavior. Therefore, analyzing the evolution of AC and DC voltages in such large-scale PV cluster transmission systems, including phenomena like overvoltage and voltage sag, is essential for building a secure and stable new-type power system.
In systems dominated by power electronic interfaces, post-fault grid voltage characteristics are influenced not only by the properties of electrical components but also significantly by the control strategies and responses of these devices, leading to more intricate dynamic processes. Existing research has extensively covered the fault ride-through (FRT) capabilities and voltage support strategies of renewable energy inverters during nearby AC faults or faults on the receiving-end grid. However, there is a notable gap in understanding the propagation characteristics and dynamic interactions when a fault occurs remotely from the PV plants, such as at the AC bus of the VSC-HVDC converter station on the sending end. Such faults can induce complex voltage perturbations across the long-distance AC collection network due to impedance distribution, multi-timescale dynamic coupling, and the diverse operational states of PV units. The operational status of solar inverters—specifically whether they enter low-voltage ride-through (LVRT) mode—along with AC-DC voltage interaction, power characteristics, and the topology of the sending-end grid are all critical factors affecting the voltage profile, especially the voltage characteristics on both sides of the solar inverter. In renewable energy generation systems, AC voltage issues during faults cannot be analyzed in isolation from DC-side voltage problems. A stable DC-link voltage is a key factor for successful fault ride-through. Conventional LVRT strategies typically use AC voltage as the primary criterion for entering LVRT mode, often overlooking its impact on the DC-link voltage. Upon entering LVRT, the control strategy of a solar inverter switches from constant DC voltage and reactive power control to current control, leaving the DC voltage uncontrolled. Consequently, analyzing the interactive evolution of AC and DC side voltages of solar inverters before and after a fault has emerged as a critical new challenge for modern power systems. Among various fault scenarios, remote faults—those located at a significant electrical distance from the PV plants within the sending-end system—present particularly complex voltage evolution characteristics that warrant in-depth investigation.
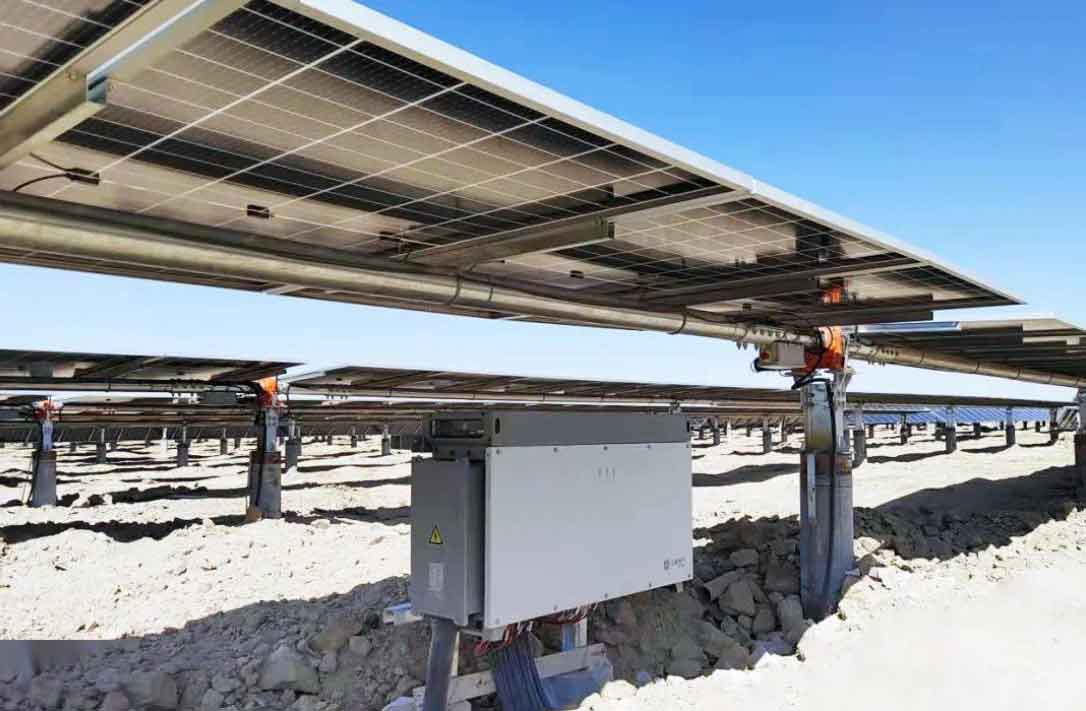
To address this, I first constructed an electromagnetic transient (EMT) simulation model of a large-scale PV base transmitted via VSC-HVDC using PSCAD/EMTDC. The system topology is illustrated conceptually below. The sending-end PV collection system comprises several large PV plants (e.g., PV1-PV5), each with a capacity on the order of gigawatts. These plants are connected to a 500kV AC bus after step-up transformation. Internally, each PV plant consists of multiple PV generation units. A typical centralized PV generation unit, which is cost-effective and grid-friendly for large-scale plants, includes a PV array, a Maximum Power Point Tracking (MPPT) controller, a solar inverter, and associated controls.
The core of the generation unit is the grid-following solar inverter. Its phase angle is provided by a Phase-Locked Loop (PLL). Under normal operation, it employs a dual-loop control strategy with an outer loop for constant DC voltage (reference provided by the MPPT) and an inner loop for current control. When the voltage at the point of common coupling (PCC) drops below a specified threshold (e.g., 0.9 per unit), the solar inverter enters LVRT mode. It switches to a current-controlled strategy, injecting dynamic reactive current into the grid according to the depth of the voltage sag, while the active current is limited to a maximum allowable value.
The reactive current reference $I_{q}^{ref\_LVRT}$ during LVRT is determined by the PCC voltage $U_g$ (in p.u.) as per the grid code requirement:
$$ I_{q}^{ref\_LVRT} \geq \begin{cases}
1.5 \times (0.9 – U_g) I_N & \text{for } 0.2 < U_g \leq 0.9 \\
1.05 \times I_N & \text{for } U_g \leq 0.2
\end{cases} $$
where $I_N$ is the rated current. The maximum allowable active current $I_{d}^{ref\_max}$ is:
$$ I_{d}^{ref\_max} = \sqrt{I_{max}^2 – (I_{q}^{ref\_LVRT})^2} $$
where $I_{max}$ is the solar inverter’s maximum current limit. The active current reference $I_{d}^{ref\_LVRT}$ is then:
$$ I_{d}^{ref\_LVRT} = \min(I_{d}^{ref\_pre-fault}, I_{d}^{ref\_max}) $$
To study the system’s FRT characteristics, I set a three-phase metallic short-circuit fault at the AC bus of the sending-end VSC-HVDC converter station. The fault was initiated at t=10.5s and lasted for 0.1s, simulating a typical protection clearance time. Simulation results revealed that due to the wide-area distribution and varying electrical distances of the PV plants, solar inverters at different spatial locations exhibited significantly divergent voltage dynamic responses to the system disturbance. The dynamic response of the DC-link voltage showed the most pronounced variation.
Based on the simulation outcomes and relevant standards defining voltage sags, I classified the dynamic responses of the solar inverter’s DC-side voltage into three distinct types, as summarized in the table below.
| Classification | Definition | Key Characteristics from Simulation |
|---|---|---|
| Type I: Severe Sag | DC voltage < 0.8 p.u. for duration > 100 ms | Deep sag (e.g., to 0.6 p.u.), long recovery. |
| Type II: Mild Sag | DC voltage < 0.8 p.u. for duration ≤ 100 ms | Moderate sag (e.g., to 0.77 p.u.), fast recovery. |
| Type III: No Sag | DC voltage remains ≥ 0.8 p.u. throughout | DC voltage stays high, may experience overvoltage. |
The subsequent analysis delves into the detailed evolution of AC and DC side voltages for each type, dissecting the process into stages based on the solar inverter’s operational state, the movement of the PV array operating point, and the power balance between the PV array, the inverter output, and the DC-link capacitor.
Type I: Severe DC Voltage Sag
Plants PV1 and PV2, located far from the VSC-HVDC station, exhibited this behavior. Their DC voltage dipped severely to around 0.6 p.u. and 0.53 p.u., respectively, with the sag duration lasting well over 100ms. The evolution can be broken down into six stages.
Stage 1 (Power Blockage): During the fault, the PCC voltage at these remote solar inverters dropped only slightly (to ~0.95 p.u.), not reaching the LVRT threshold. The inverters remained in constant DC voltage control. The PV array output power $P_{PV}$ exceeded the inverter output power $P_{inv}$ because power transfer was hindered. The surplus power charged the DC-link capacitor, causing the DC voltage $u_{dc}$ to rise significantly (~1.26 p.u.). The PV array operating point moved to the right on its P-V curve, reducing $P_{PV}$ until a temporary balance was achieved at a high voltage level.
Stages 2 & 3 (DC Voltage Collapse & Power Recovery): After fault clearance, the solar inverter, still in constant DC voltage mode, attempted to restore power output. The reference $P_{inv}$ increased rapidly due to the integral action in the voltage control loop responding to the error between the high actual $u_{dc}$ and the MPPT-set reference $u_{dc}^{ref}$. The power balance is governed by:
$$ C u_{dc} \frac{du_{dc}}{dt} = P_{PV} – P_{inv} $$
At the high $u_{dc}$ operating point, $P_{PV}$ was lower than the demanded $P_{inv}$. The deficit was supplied by the capacitor discharging, causing $u_{dc}$ to fall. Crucially, the recovery of $P_{inv}$ was slow due to the large accumulated error in the voltage controller’s integrator. By the time $u_{dc}$ fell back to the maximum power point (MPP) voltage, $P_{inv}$ still demanded more power than the PV array could provide at its maximum ($P_{max}$). The capacitor continued to discharge, plunging $u_{dc}$ to a deep sag (e.g., 0.67 p.u.). The falling DC voltage also dragged down the AC voltage at the PCC.
Stages 4 & 5 (AC LVRT and DC Voltage Recovery): The depressed AC voltage eventually fell below the LVRT threshold (~0.9 p.u.), forcing the solar inverter into LVRT mode. At the moment of entry, $P_{PV}$ (at a low $u_{dc}$) was still less than the fixed active current-based $P_{inv}$, so the capacitor kept discharging, causing a further slight dip in $u_{dc}$. However, as the AC voltage continued to drop sharply due to the low $u_{dc}$, $P_{inv}$ decreased proportionally according to $P_{inv} \propto U_{ac}$. Soon, $P_{PV}$ became greater than $P_{inv}$. The surplus power charged the capacitor, initiating the recovery of $u_{dc}$. The combined effect of reactive current injection during LVRT and the rising $u_{dc}$ helped the AC voltage to recover, forming a distinct “V” shape in the AC voltage waveform.
Stage 6 (Stable Recovery): Once the AC voltage recovered above the LVRT threshold, the solar inverter exited LVRT and resumed constant DC voltage control. The controller then adjusted $P_{inv}$ to guide the PV array operating point back to the MPP, re-establishing steady-state power balance.
Type II: Mild DC Voltage Sag
Plant PV3, at a medium electrical distance, showed this characteristic. Its DC voltage sagged mildly to 0.77 p.u. for only about 21ms. The stages are similar to Type I but with key differences in timing and power balance at critical moments.
Stages 1-3: During the fault, PV3’s AC voltage was lower than PV1’s due to its proximity to the fault, but still above the LVRT threshold. The DC voltage rose, but the subsequent recovery of $P_{inv}$ was faster because the voltage controller’s integrator had accumulated less error. Consequently, by the time the solar inverter was about to enter LVRT (triggered by AC voltage depression propagating from PV1/PV2 and its own DC voltage drop), $P_{PV}$ had already become greater than $P_{inv}$. Therefore, when the solar inverter entered LVRT, the capacitor immediately began charging, causing $u_{dc}$ to rise quickly rather than fall further. This resulted in only a brief, mild sag.
Stages 4 & 5: During LVRT, the high and rising $u_{dc}$ at PV3 mitigated the AC voltage drop caused by the propagating disturbance from remote plants. The AC voltage sag was less severe and recovered faster compared to Type I plants. The high $u_{dc}$ also meant the PV array operated to the right of the MPP, with $P_{PV} < P_{max}$.
Stage 6: The solar inverter exited LVRT earlier and the controller steered the operating point back to the MPP.
Type III: No DC Voltage Sag
Plants PV4 and PV5, closest to the VSC-HVDC station, exhibited this behavior. Their DC voltage never fell below 0.8 p.u. and actually experienced overvoltage.
Stage 1: During the fault, the AC voltage at these solar inverters dropped deeply enough to trigger LVRT immediately. The inverter switched to current control, limiting $P_{inv}$. With $P_{PV} > P_{inv}$, the capacitor charged, raising $u_{dc}$ to an elevated level (~1.2 p.u.). The PV operating point moved far to the right on the P-V curve.
Stages 2 & 3 (First LVRT Exit and Overvoltage): After fault clearance, the AC voltage recovered quickly, leading to an exit from LVRT. At this moment, $P_{inv}$ (now under voltage control again) was still less than $P_{PV}$ at the high-voltage operating point. The capacitor continued charging, keeping $u_{dc}$ high. The AC voltage was also influenced by an overvoltage surge from the VSC-HVDC station’s bus.
Stages 4 & 5 (Second LVRT due to Propagated Sag): The severe AC voltage sags from the remote plants (PV1-PV3) propagated through the AC collection network, causing the AC voltage at PV4/PV5 to dip again and trigger a second LVRT event. During this second LVRT, the already high $u_{dc}$ increased slightly further as $P_{PV}$ remained greater than the LVRT-limited $P_{inv}$. The high $u_{dc}$ significantly cushioned the AC voltage dip, resulting in a much shallower sag (e.g., to 0.72 p.u.) and a shorter LVRT duration compared to Type I plants.
Stage 6: After the second LVRT, the system experienced another overvoltage surge before the solar inverter’s control finally adjusted $P_{inv}$ to bring the PV array operating point back to the MPP, lowering $u_{dc}$ to its nominal value.
The analysis reveals that the power balance between the PV array and the solar inverter output, mediated by the DC-link capacitor, is the fundamental driver of DC voltage dynamics. The defining condition for a DC voltage sag is the solar inverter demanding more power than the PV array can supply at its current operating point, forcing capacitor discharge. Whether a solar inverter enters LVRT during the fault determines the initial conditions for recovery. Inverters that do not enter LVRT (like Type I) have their voltage controller integrators wound up, leading to a large power overshoot during recovery that causes deep sag. Inverters that enter LVRT immediately (Type III) have no such integrator wind-up, so post-fault power demand is modest, and no sag occurs.
The severity of the sag (Type I vs. Type II) is determined by the speed at which the solar inverter’s output power overshoot recovers before entering LVRT. Faster recovery (influenced by the degree of initial AC voltage dip) leads to a milder sag.
Furthermore, the post-fault depression of AC voltage leading to LVRT in multiple plants has a propagation mechanism. The severe DC and consequent AC voltage sag at remote plants (Type I) acts as a source of disturbance. This low voltage propagates through the impedance of the AC collection grid, affecting other solar inverters and potentially triggering their LVRT. The magnitude and recovery rate of a solar inverter’s AC voltage are strongly coupled to its own DC voltage level; a higher DC voltage provides a stabilizing effect, reducing the AC voltage dip depth and accelerating recovery.
| Type | Key Mechanism for DC Sag | AC LVRT Trigger Cause | Critical Power Balance at LVRT Entry |
|---|---|---|---|
| Severe Sag (I) | Slow $P_{inv}$ recovery after fault (no initial LVRT). Large controller overshoot. | Induced by its own deep DC/AC voltage collapse. | $P_{PV} < P_{inv}$ (Capacitor discharges further) |
| Mild Sag (II) | Faster $P_{inv}$ recovery. Moderate controller overshoot. | Caused by propagated voltage sag from remote plants. | $P_{PV} > P_{inv}$ (Capacitor charges, recovery starts) |
| No Sag (III) | Immediate LVRT during fault prevents controller wind-up. No $P_{inv}$ overshoot. | Initial: Direct fault impact. Secondary: Propagated sag. | LVRT active during fault. Post-fault: $P_{PV} > P_{inv}$. |
In conclusion, for large-scale PV clusters connected via VSC-HVDC, the voltage dynamics following a remote fault are highly heterogeneous and depend critically on the electrical distance and the resulting sequence of control actions in the solar inverters. The interaction between AC and DC side voltages of the solar inverter is bidirectional and central to the system’s transient behavior. The DC voltage sag originates from a mismatch between PV power availability and inverter power demand, with the pre-LVRT recovery speed of the solar inverter being the key factor determining sag severity. Furthermore, AC voltage sags can propagate through the network, with the local DC voltage level of a solar inverter playing a crucial role in mitigating these propagated disturbances. These insights provide a theoretical foundation for refining fault ride-through strategies, optimizing voltage stability control, and enhancing the resilience of future renewable-energy-dominated power systems.