
The quest for sustainable and resilient energy systems has led to significant research and development in integrating renewable energy sources into the core infrastructure of modern society. Among the most promising approaches is the complementary combination of wind and solar photovoltaic (PV) power generation. This synergy effectively mitigates the inherent intermittency of each source—solar insolation is highest during the day and in summer, while wind resources can be more substantial at night and during other seasons. This article, from my perspective as a researcher and practitioner in the field, delves into two critical and interconnected aspects: the analytical methodology for assessing the maximum power supply capability of interconnected grid substations, and the innovative architectural integration of wind-solar hybrid systems into low-rise residential buildings. The fusion of these concepts represents a holistic path toward a robust, decentralized, and low-carbon energy future.
1. Analytical Framework for Maximum Power Supply Capability (PSC)
Enhancing the power supply capacity and reliability of distribution networks is a paramount objective for utilities. A pivotal strategy involves the parallel operation of main transformers (main-tfs) across different substations, as opposed to traditional split operation. The parallel operation allows for load sharing and redundant backup, effectively increasing the overall system’s ability to deliver power under both normal and contingency (N-1) conditions. The core of planning such an enhancement lies in accurately calculating the Maximum Power Supply Capability (PSC).
The PSC of a distribution network under N-1 security criterion is defined as the maximum total load it can supply without overloading any component following the outage of any single main transformer or feeder. The calculation model can be formulated as an optimization problem. Let us define the following key variables:
- Let \( S_{total} \) represent the total maximum supply capability to be maximized.
- Let \( L_{i,j} \) denote the load supplied by the j-th feeder connected to the i-th main transformer.
- Let \( C_i \) be the rated capacity of the i-th main transformer.
- Let \( F_{k} \) be the thermal capacity limit of the k-th feeder or tie-line.
The objective function is to maximize the sum of all loads:
$$ \text{Maximize } S_{total} = \sum_{i} \sum_{j} L_{i,j} $$
This maximization is subject to a set of stringent constraints that ensure system security:
1. Normal Operation Constraints: Under normal conditions, the load on any main transformer must not exceed its capacity, and feeder currents must remain within limits.
$$ \sum_{j} L_{i,j} \le C_i \quad \forall i $$
$$ L_{i,j} \le F_{k(i,j)} \quad \forall i,j $$
2. N-1 Contingency Constraints: This is the crux of the calculation. For the outage of any single main transformer \( m \), the network must be able to redistribute its original load \( \sum_{j} L_{m,j} \) to other healthy transformers via existing network ties and interconnection paths. The load transfer must not cause overloads elsewhere.
For a contingency on transformer \( m \), for every other healthy transformer \( n \), the new total load it carries must respect its capacity:
$$ \sum_{j} L_{n,j} + \Delta L_{n,m} \le C_n \quad \forall n \neq m $$
Where \( \Delta L_{n,m} \) is the portion of the lost load from transformer \( m \) that is successfully transferred to transformer \( n \). This transfer is limited by the available transfer capacity of the interconnection paths (ties) between their respective substations.
3. Power Flow and Topology Constraints: The \( \Delta L_{n,m} \) values are not independent; they are governed by the radial or mesh structure of the medium-voltage (MV) network and the specific location and capacity of tie-lines (station interconnections). The power flow equations and switching logic must be embedded within the constraint set to ensure a feasible post-contingency network configuration.
Solving this optimization problem, typically using linear programming or specialized heuristic algorithms, yields the numerical value of \( S_{total} \) and reveals the critical bottlenecks in the network.
2. Impact of Transformer Parallel Operation on PSC: A Case Study
To illustrate the practical implications, consider a distribution network comprising 3 medium-voltage substations (S1, S2, S3), each initially equipped with 2 main transformers operating in a split-bus configuration. The total installed transformer capacity is 143 MVA. We analyze eight distinct operational modes, ranging from fully split operation to various degrees of parallel operation within and across substations.
The following table summarizes the key parameters and the calculated PSC for each mode. The modes are defined by which substations have their internal main transformers operated in parallel.
| Mode | Parallel Substation Configuration | Total PSC (MVA) | Percentage Increase vs. Mode 0 | Number of External Ties for Parallel Transformers | Average Capacity per Parallel Transformer (MVA) |
|---|---|---|---|---|---|
| 0 | Fully Split (Baseline) | 100.62 | 0% | – | – |
| 1 | S1 only | 114.12 | +14% | 2 | 20.0 |
| 2 | S2 only | 106.95 | +6% | 5 | 20.0 |
| 3 | S3 only | 110.53 | +10% | 5 | 31.5 |
| 4 | S1 & S2 | 114.78 | +14% | 7 | 20.0 |
| 5 | S1 & S3 | 120.95 | +20% | 7 | 25.75 |
| 6 | S2 & S3 | 110.53 | +10% | 10 | 25.75 |
| 7 | Fully Parallel (S1, S2, S3) | 120.95 | +20% | 12 | 23.83 |
Analysis of Results:
- Targeted Enhancement: Parallel operation has the most significant impact on substations with fewer external interconnections (ties). In Mode 1, paralleling transformers in S1 (which had only 2 external ties) provided a 14% PSC boost. The parallel connection internally creates a larger, single capacity pool that can better utilize the limited external paths for load transfer during a contingency.
- Capacity Effect: Comparing modes with similar tie counts but different average transformer capacities (e.g., Mode 2 vs. Mode 3), a higher individual transformer capacity can lead to a higher PSC, as a larger unit can shoulder more transferred load during a fault.
- Network Effect: The most profound gains are observed when parallel operation is implemented across multiple substations, effectively creating a larger, interconnected capacity zone. Modes 5 and 7, which involve parallel groups in multiple substations, achieve the highest PSC (120.95 MVA, a 20% increase). This is because a fault in one transformer’s load can be shared and supported by a greater number of healthy transformers across the network. This distributed sharing reduces the required individual “spare capacity” or backup margin on each transformer, allowing them to operate at a higher utilization rate under normal conditions without compromising N-1 security. The PSC increases with both the number of transformers operated in parallel and the number of substations interconnected in this manner.
In conclusion, transformer parallel operation is a highly effective, cost-efficient method to enhance distribution network capacity without adding physical complexity (new lines or substations). It improves stability and leverages existing assets more intelligently.
3. Wind-Solar Hybrid Power System: Architecture and Components
Transitioning from grid-side analysis to localized generation, we explore the wind-solar photovoltaic hybrid system. This system is designed to operate either in an off-grid (standalone) mode or in a grid-assisted mode for low-rise residential applications. Its core principle is complementarity: the solar system produces power predominantly during sunny daylight hours, while the wind system can generate during the night, storms, or cloudy days, leading to a more stable and reliable combined output.
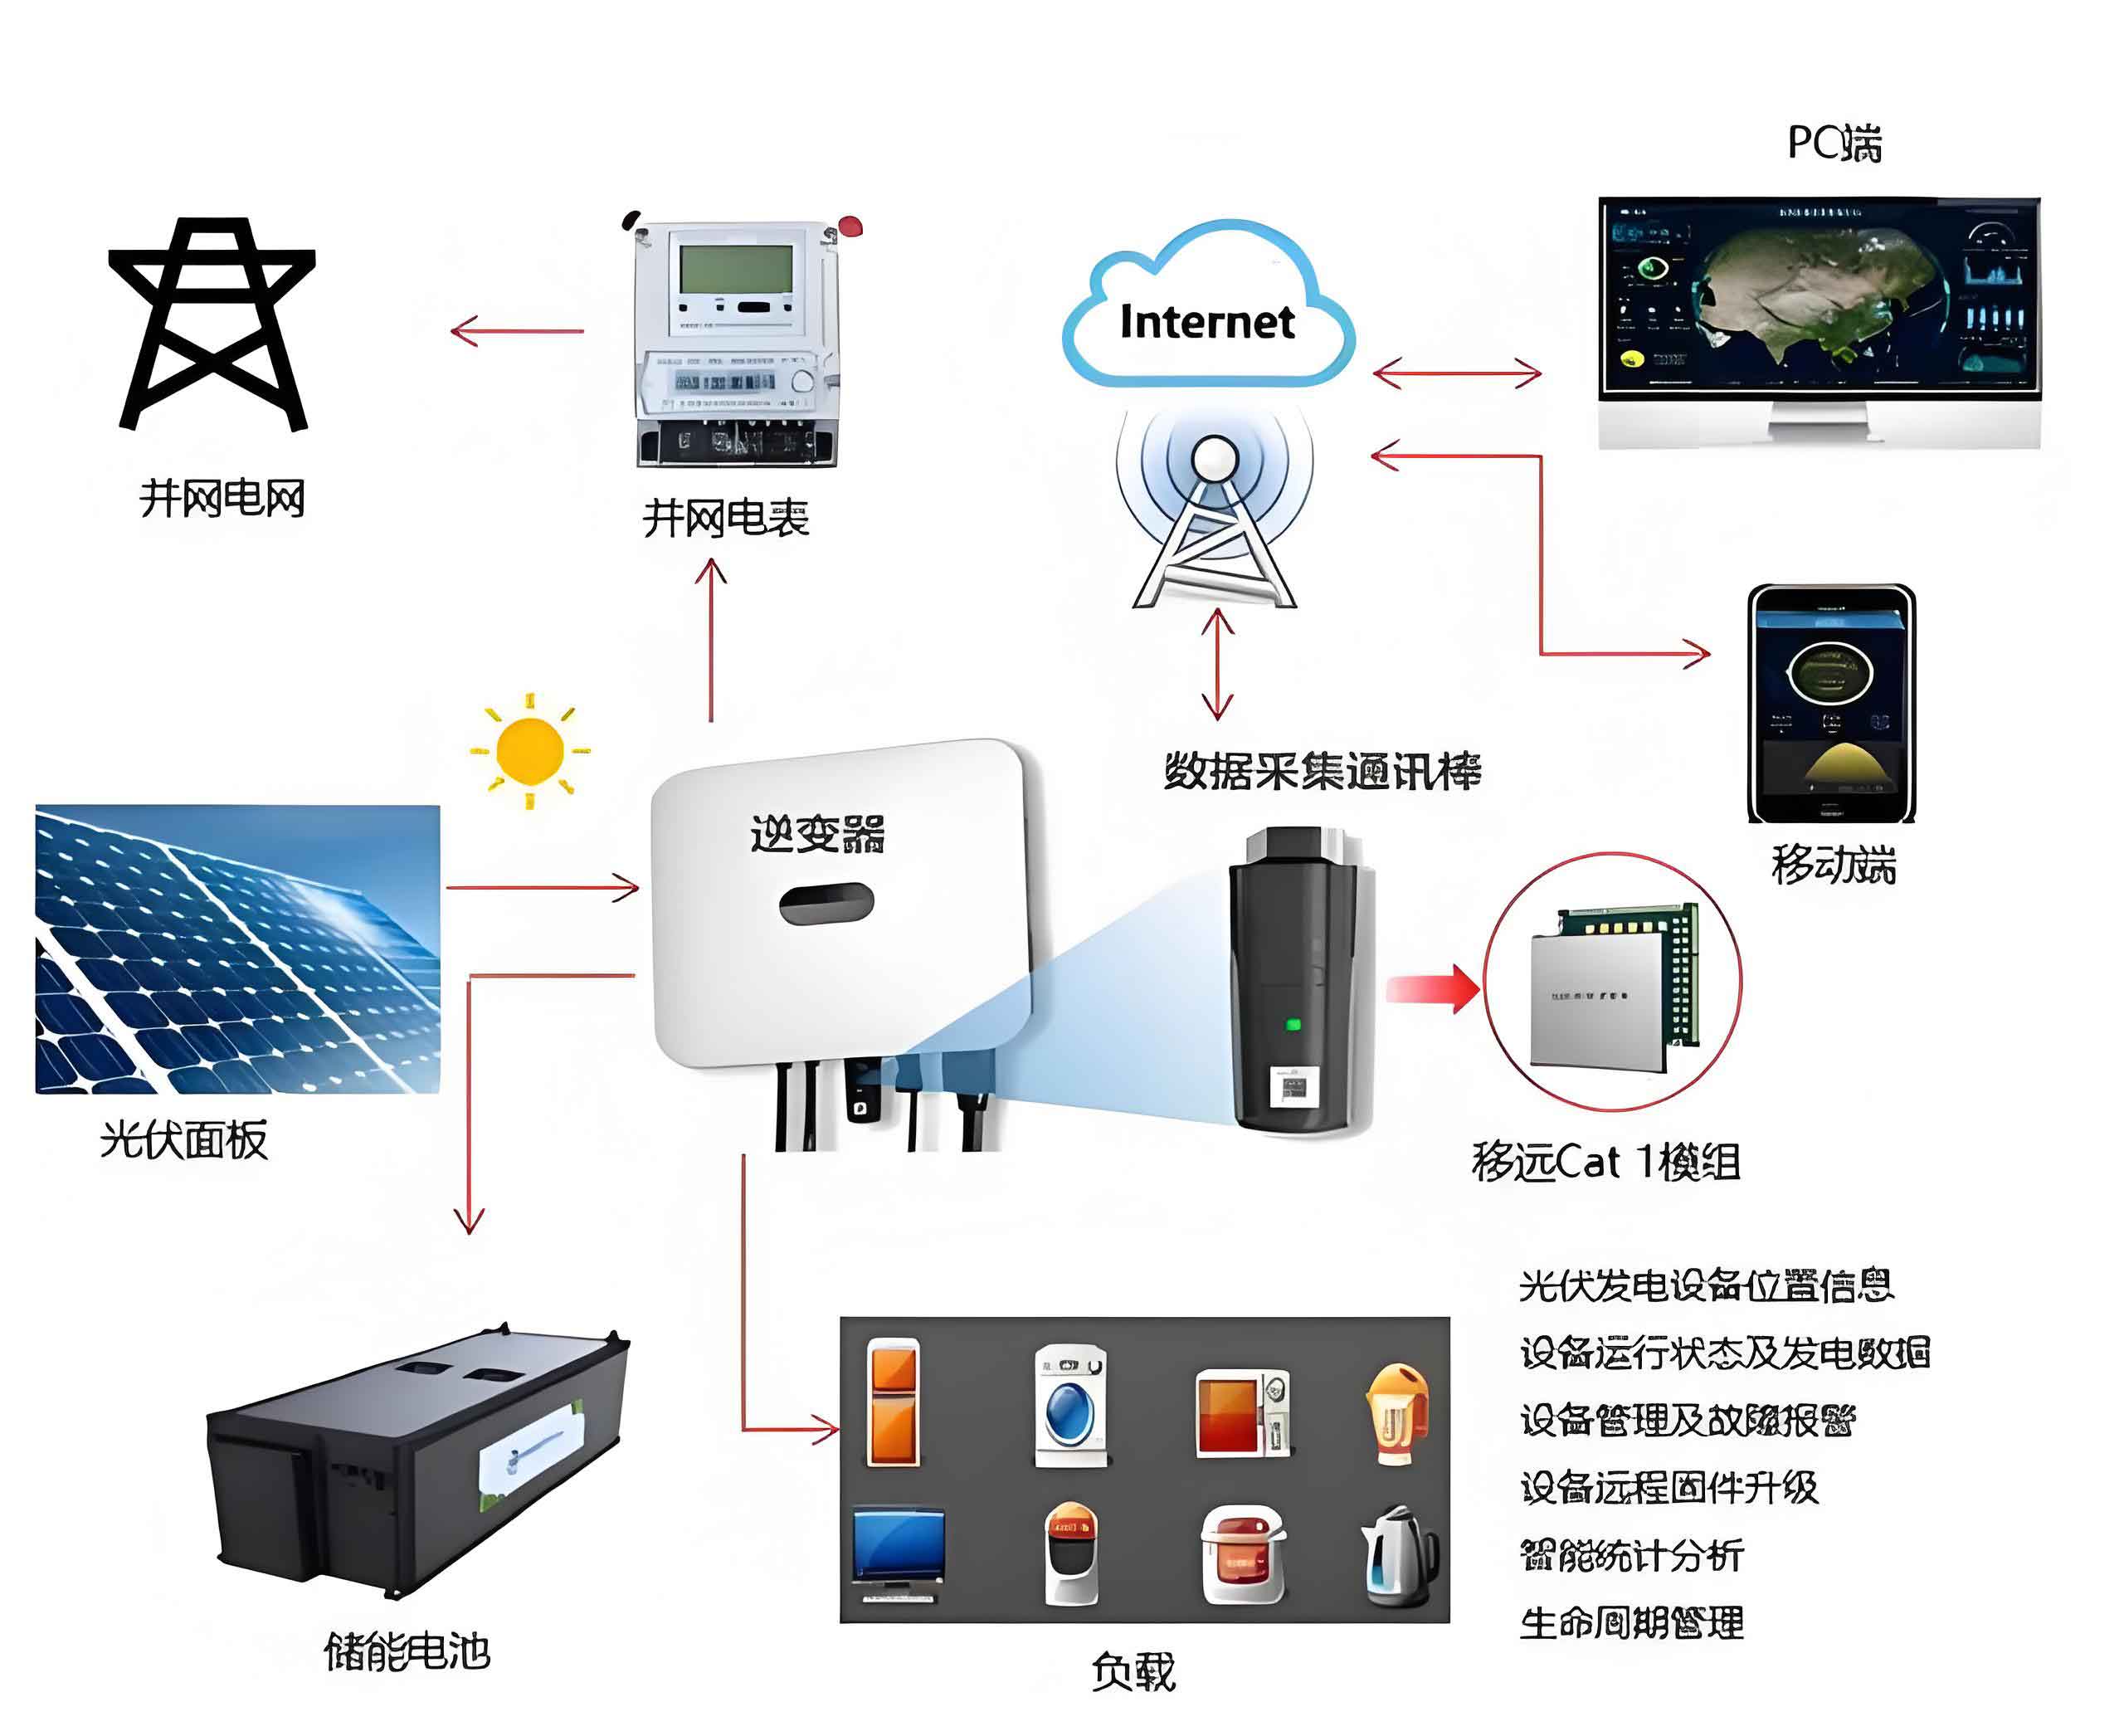
A standard standalone hybrid system comprises the following key components, with their technical relationships defined below:
| Component | Primary Function | Key Technical Specifications & Mathematical Representation |
|---|---|---|
| Wind Turbine | Converts kinetic wind energy into AC electrical energy. | Rated Power: \( P_{w,rated} \) (e.g., 150W – 1kW). Output voltage: AC (e.g., 24V/36V). Cut-in wind speed \( v_{ci} \) (~3 m/s), Rated wind speed \( v_r \), Cut-out speed \( v_{co} \) (~25 m/s). The output power \( P_w(v) \) as a function of wind speed \( v \) is typically modeled as: $$ P_w(v) = \begin{cases} 0 & v < v_{ci} \\ \frac{1}{2} C_p \rho A v^3 & v_{ci} \le v < v_r \\ P_{w,rated} & v_r \le v < v_{co} \\ 0 & v \ge v_{co} \end{cases} $$ Where \( C_p \) is the power coefficient, \( \rho \) is air density, and \( A \) is the swept area of the rotor. |
| Solar PV Array | Converts solar irradiance into DC electrical energy. | Rated Power: \( P_{pv,rated} \) (e.g., 150W – 700W). The output power \( P_{pv}(t) \) at time \( t \) depends on irradiance \( G(t) \), cell temperature \( T_c(t) \), and panel characteristics: $$ P_{pv}(t) = P_{stc} \cdot \frac{G(t)}{G_{stc}} \cdot [1 – \gamma (T_c(t) – T_{stc})] $$ Where \( P_{stc} \) is power at Standard Test Conditions (STC: \( G_{stc}=1000W/m^2, T_{stc}=25^\circ C \)), and \( \gamma \) is the temperature coefficient of power. |
| Charge Controller | Regulates charging of batteries from both sources; prevents overcharge/discharge. | Input: DC from PV and rectified AC from wind turbine. Output: Regulated DC to battery. It implements Maximum Power Point Tracking (MPPT) algorithms to optimize energy harvest, particularly from the solar system. The controller ensures battery voltage \( V_{bat} \) stays within safe limits \( [V_{min}, V_{max}] \). |
| Battery Bank | Stores electrical energy for use when generation is low. | Total Capacity: \( C_{bat} \) (in Ampere-hours, Ah, e.g., 300Ah). System Voltage: \( V_{sys} \) (e.g., 24V DC). State of Charge (SOC) is a critical parameter: $$ SOC(t) = SOC(t_0) + \frac{1}{C_{bat}} \int_{t_0}^{t} (I_{charge}(\tau) – I_{load}(\tau)) d\tau $$ The usable energy is \( E_{bat,usable} = C_{bat} \cdot V_{sys} \cdot DOD_{max} \), where \( DOD_{max} \) is the maximum allowable Depth of Discharge. |
| Inverter | Converts DC from the battery bank to AC for household appliances. | Rated Power: \( P_{inv,rated} \). Input voltage: \( V_{sys} \) (e.g., 24V DC). Output voltage: 110V/220V AC, 50/60 Hz. Efficiency \( \eta_{inv} \) is crucial: $$ P_{ac,out} = \eta_{inv} \cdot P_{dc,in} $$ It contains protection circuits for over-voltage, under-voltage, overload, and short-circuit. |
| AC Distribution Board | Distributes AC power to various household circuits and may manage grid connection if present. | Contains circuit breakers, meters, and potentially a transfer switch for selecting between inverter power and grid power. |
4. Integrated Building Design for Low-Rise Residences
The true potential of renewable energy in the built environment is unlocked through Building-Integrated Design (BID). This philosophy moves beyond merely mounting hardware on a building to seamlessly incorporating energy generation components as functional and aesthetic parts of the building envelope itself.
4.1 Photovoltaic (PV) Building Integration (BIPV)
In a BIPV approach, the solar system ceases to be an add-on and becomes part of the roof, façade, or windows. For low-rise residences, the primary integration points are:
- PV Roof: Solar modules replace conventional roofing materials (e.g., tiles, shingles, metal sheets) on south-facing slopes. They serve as both weatherproof layer and electricity generator. The tilt angle is often fixed to the roof pitch, which should be optimized for the local latitude \( \phi \). A common rule-of-thumb for annual yield is a tilt angle \( \beta \approx \phi \).
- PV Facade/Curtain Wall: Semi-transparent or opaque PV modules can be integrated into south, east, or west-facing walls. They can replace spandrel glass or other cladding materials, providing shade, insulation, and power generation simultaneously.
- PV Shading Devices: PV panels can be configured as awnings, louvers, or balcony railings. These elements reduce solar heat gain while producing electricity, effectively performing double duty for building climate control.
The energy yield from an integrated solar system must account for non-optimal orientation and potential shading from the building’s own features. The effective irradiance \( G_{eff} \) on a surface with azimuth \( \alpha \) and tilt \( \beta \) is calculated using solar geometry models involving solar altitude and azimuth angles.
4.2 Wind Turbine Building Integration
Integrating small-scale wind turbines into residential settings is more challenging due to turbulence, noise, and vibration. However, strategic placement can yield benefits:
- Rooftop Mounting: Elevating the turbine increases access to higher wind speeds. Careful structural analysis is required to handle dynamic loads and avoid resonance with the building’s natural frequency. The power output is highly sensitive to the localized wind resource, which is complex in urban/suburban settings.
- Integration in Open Spaces: For low-rise homes with ample yard space, a freestanding turbine in the garden or on a dedicated mast in an open area is often more effective than a rooftop installation, as it experiences cleaner airflow.
4.3 System Sizing and Synergy Calculation
The design of a hybrid solar system complemented by wind requires a detailed load and resource analysis. The goal is to size each component so that the Loss of Power Supply Probability (LPSP) is acceptably low for the desired level of energy autonomy.
Step 1: Load Profile Analysis. Define the daily or annual energy consumption \( E_{load} \).
Step 2: Resource Assessment. Obtain time-series data for solar irradiance \( G(t) \) and wind speed \( v(t) \) at the site.
Step 3: Component Modeling. Use the equations in Section 3 to simulate the hourly power output from the PV array \( P_{pv}(t) \) and the wind turbine \( P_w(t) \).
Step 4: System Simulation. Run a chronological simulation that tracks the battery State of Charge (SOC):
$$ SOC(t+1) = SOC(t) + \frac{[P_{pv}(t) + P_w(t) – P_{load}(t)/\eta_{inv}] \cdot \Delta t}{C_{bat} \cdot V_{sys}} $$
with the constraint \( SOC_{min} \le SOC(t) \le 1 \). A failure (LPSP event) occurs when \( SOC(t) \) hits \( SOC_{min} \) while \( P_{load}(t) > 0 \).
Step 5: Economic & Technical Optimization. The system cost \( Cost_{total} \) is a function of component sizes:
$$ Cost_{total} = a \cdot P_{pv,rated} + b \cdot P_{w,rated} + c \cdot C_{bat} + d \cdot P_{inv,rated} + \text{Fixed Costs} $$
The design optimization problem is to minimize \( Cost_{total} \) subject to the constraint that LPSP ≤ a target value (e.g., 1%). This often reveals the optimal mix between the solar system and the wind system.
5. Illustrative Case Study: A Standalone Residential System
Consider a low-rise home designed for full off-grid operation using an integrated hybrid system. The design parameters are as follows:
| Parameter | Specification |
|---|---|
| PV System (BIPV Roof) | Total Power: 700 Wp. 6x100W + 2x150W monocrystalline modules. Tilt: 42°, Azimuth: 180° (South). |
| Wind System | 1 kW rated horizontal-axis turbine on a 10m mast in the rear yard. |
| Storage | Battery Bank: 24V, 500 Ah (Usable Energy @ 50% DOD: \( 24V * 500Ah * 0.5 = 6 kWh \)). |
| Inverter | 24V DC to 220V AC, 2 kVA rated, efficiency \( \eta_{inv} \) = 92%. |
| Primary Load | Energy-efficient lighting, refrigerator, electronics. Average daily consumption \( E_{load} \) = 3.5 kWh. |
Annual Performance Estimation:
Using typical meteorological year data, the simulated annual energy production is:
- Solar PV Production \( E_{pv} \): ~850 kWh
- Wind Turbine Production \( E_{w} \): ~450 kWh
- Total Annual Generation \( E_{total} \): ~1300 kWh
The total load demand is \( 3.5 \text{ kWh/day} \times 365 \text{ days} = 1278 \text{ kWh/year} \). The system generates a slight surplus, indicating a well-sized design. The battery simulation would show that the system meets the load demand over 99% of the time (LPSP < 1%), with shortfalls occurring only during prolonged periods of low sun and wind. This case demonstrates that a properly designed integrated solar system with wind backup can viably power a modern, energy-conscious low-rise home.
6. Synthesis and Concluding Perspective
The parallel operation of substation transformers and the building-integrated wind-solar hybrid system are two powerful concepts operating at different scales of the energy landscape. The former enhances the capacity, reliability, and efficiency of the centralized distribution grid—a “top-down” reinforcement. The latter represents a “bottom-up” revolution, transforming passive consumers into active “prosumers,” reducing grid dependency, transmission losses, and carbon footprint.
Their underlying principles are congruent: creating resilience through interconnection and diversity. In the grid, it is the interconnection of transformers; in the home, it is the interconnection of complementary energy sources (the solar system and wind) and their integration with the building structure itself. The analytical rigor applied to calculating the Maximum Power Supply Capability—with its constraints and optimization—is directly analogous to the system sizing and simulation needed for a reliable hybrid renewable system.
The future of sustainable energy infrastructure lies in the intelligent fusion of these approaches. A smart grid can dynamically manage distributed resources from millions of integrated residential solar systems and other renewables, while its own backbone is strengthened through operational strategies like transformer paralleling. This synergy promises not just a low-carbon world, but one with greater energy security, affordability, and architectural innovation, where every building can be both a sanctuary and a subtle, productive power plant.