
Based on the thermal model of a single cell battery, a CFD model for air-cooled heat dissipation of a single-layer battery cabinet was established. The effects of different discharge rates, inlet flow rates, inlet temperatures, battery gaps, and inlet arrangement methods on the air-cooled heat dissipation performance were studied. The discharge rates, inlet temperatures, and battery gaps were comprehensively analyzed, and the critical inlet flow rates under corresponding conditions were provided, providing guidance for cooling strategies and optimization of energy storage systems.
1.Single layer battery cabinet air-cooled heat dissipation model
The battery energy storage system consists of several battery cabinets/clusters, each of which is connected by several battery packs, and each battery pack contains several individual lithium-ion batteries. The air cooling and heat dissipation of battery energy storage systems generally include main components such as air conditioning, air supply ducts, and fans. The cold air blown out by the air conditioner is sent through the air supply duct to the air outlets at each battery cabinet, and then flows downwards at a certain speed. Under the action of the fan of the battery pack module, the cold air flows into the interior of the battery pack, exchanges heat with the battery surface, and flows out of the battery pack module to complete the cooling of the battery. Due to the fact that each battery pack module is equipped with a fan, air cooling and heat dissipation performance research can be conducted on single-layer battery cabinets.
1.1 Physical model of single-layer battery cabinet
In the designed battery cabinet, a battery pack module is placed in the center of each layer. The battery pack is composed of 6 individual batteries connected in series, with an energy of 960Wh. The simplified air-cooled heat dissipation model is shown in Figure 1, which simplifies the actual battery pack module air-cooled system as a velocity inlet and a pressure outlet. The inlet size is 100mm × 250mm, the back of the battery pack module is set as an outlet. The battery gap is d, the distance between the battery pack and the left, right, upper and lower walls is a, the distance between the inlet and outlet walls is c, the distance between the inlet and lower walls is h, and the horizontal distance between the inlet and edge batteries is s.
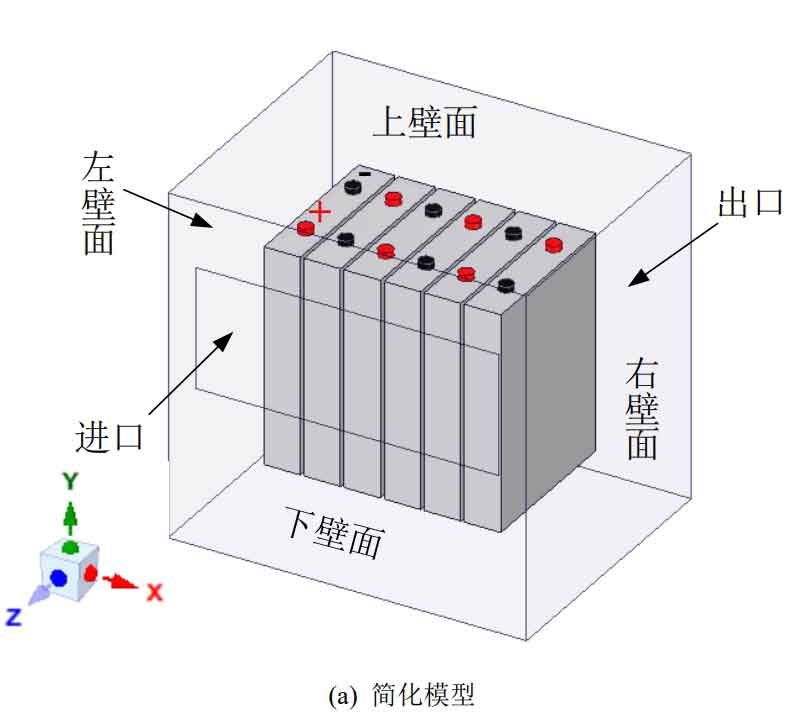
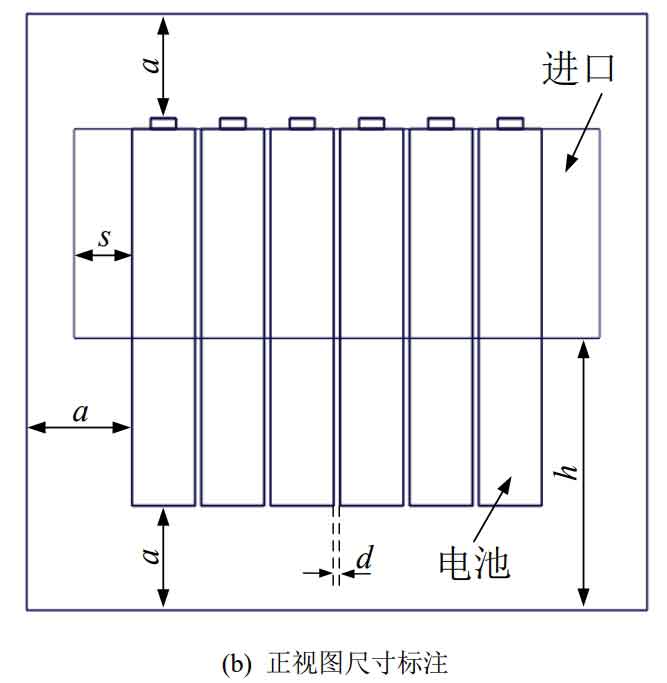
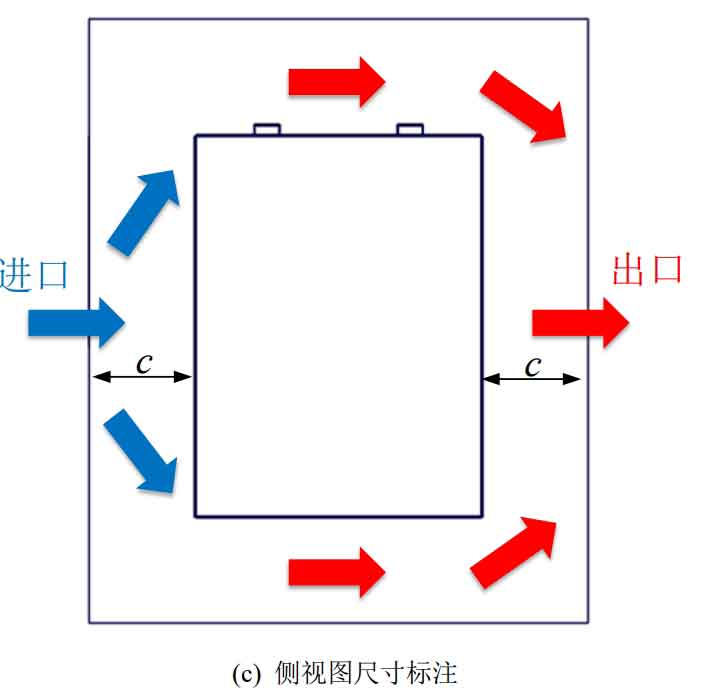
The size of the individual battery has been given, and the specific values of each structural parameter of the initial model are listed in Table 1.
| Parameters | Value/mm |
| d | 3 |
| a | 50 |
| c | 50 |
| h | 130 |
| s | 27.5 |
1.2 Grid partitioning and independence verification
Grid the established three-dimensional geometric model of air cooling and heat dissipation for the battery pack, using a hybrid grid for division. The solid domain is an unstructured grid, and the fluid domain is a structured grid. The grid size has a significant impact on the CFD calculation results. If the grid size is too large, it will affect the accuracy and precision of the calculation results; The small size of the grid results in a large number of grids, which increases the computational load and time. Therefore, grid independence testing is required. This article selects four grid sizes, with generated grids of 798674, 1673757, 2836260, and 4008124, respectively. Under the simulation of different grid numbers, the highest temperature Tmax of the battery pack, the maximum temperature difference Δ Tmax of the battery pack, and the average inlet pressure Pin were selected as the criteria for measuring grid independence. The inlet flow rate is set to 0.1m3/s, the inlet temperature and ambient temperature are set to 25 ℃, the discharge rate of the battery pack is set to 3C, and the simulation time is 1200s. Simulate the initial model, and the simulation results under different grids are listed in Table 2.
| Number of grids | Tmax/℃ | Relative error/% | Δ Tmax/℃ | Relative error/% | Pin/Pa | Relative error/% |
| 798674 | 38.3 | 1.04 | 8.6 | 4.65 | 11.458 | 1.74 |
| 1673757 | 37.9 | 0.79 | 8.2 | 3.67 | 11.259 | 0.77 |
| 2836260 | 37.6 | 0.27 | 7.9 | 1.27 | 11.172 | 0.74 |
| 4008124 | 37.5 | – | 7.8 | – | 11.089 | – |
From Table 2, it can be seen that when the number of grids increases from 798674 to 1673757, the maximum temperature Tmax and the maximum temperature difference of the battery pack Δ The decrease in Tmax and average inlet pressure Pin was significant, with relative errors of 1.04%, 4.65%, and 1.74%, respectively; As the grid increases, the decrease in magnitude decreases. When the number of grids increases from 2836260 to 4008124, Tmax Δ The relative errors of Tmax and Pin decreased to 0.27%, 1.27%, and 0.74%. By balancing the calculation accuracy and time, the CDF simulation calculation will then select the grid size when the number of grids is 2836260 to divide the grid.
1.3 Numerical calculation methods
Air flow follows three fundamental conservation laws, namely mass conservation, momentum conservation, and energy conservation. The control equation is shown in the formula, and the energy conservation equation during the discharge process of lithium batteries is shown in the formula.
The model is based on a pressure solver, with transient solutions. The diffusion term is discretized using a second-order upwind scheme, while the transient term is discretized using a first-order implicit scheme. Considering the influence of gravity on heat dissipation, the gravity magnitude along the y-direction is -9.81m/s2, and the selection standard for turbulent flow is k- ε Model.
| Medium | Density (kg/m3) | Specific heat capacity (J/kg · K) | Thermal conductivity (W/m · K) | Viscosity (kg/m · s) |
| 空气 | 1.225 | 1006.43 | 0.0242 | 1.7894×10^-5 |
The inlet is a velocity inlet boundary condition, the outlet is a pressure outlet boundary condition, and the outlet pressure is a standard atmospheric pressure. The wall surface of the battery pack module is set to be insulated, ignoring heat exchange with the outside world; The wall surface is relatively non slip. The inlet temperature and ambient temperature are both set to 25 ℃, and the entire battery pack module and initial battery temperature are also set to 25 ℃. The thermophysical parameters of air are listed in Table 3, and the Boussinesq hypothesis is used for the air density in natural convection. The battery pack is composed of 6 lithium-ion batteries connected in series, using virtual connections, which can ignore indirect chips and reduce the difficulty of grid division.
2. The impact of different factors on heat dissipation performance
As mentioned above, lithium-ion batteries generate heat during operation, leading to an increase in battery temperature and affecting their performance. Therefore, the maximum temperature of the battery pack should be controlled within a reasonable range. In addition, it is necessary to ensure the temperature uniformity of the battery pack. Different air flow rates and layout methods can lead to changes in the power consumed by the fan and the volume energy density of the battery module, both of which are also considered in measuring heat dissipation performance.
Four key indicators were considered to measure the air cooling and heat dissipation performance of the battery pack, namely the highest temperature Tmax and the highest
Large temperature difference Δ Tmax, fan consumption power Wp, and battery cabinet volume energy density Ev.
Tmax represents the highest temperature of all batteries in the battery pack; Δ Tmax represents the maximum temperature difference of all batteries in the battery pack. Wp is the power consumption of the fan, expressed as follows:
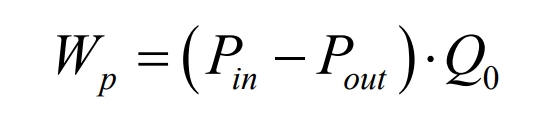
In the formula, Pin and Pout are the average pressures in the inlet and outlet regions, Pa; Q0 is the air flow rate, m ^ 3/s.
Ev is the volume energy density of the battery cabinet, expressed as:
In the formula, E is the energy of the battery pack, Wh; Vc is the volume of the battery cabinet, L.
Tmax and Δ The smaller Tmax, the better the heat dissipation performance; The lower the Wp, the smaller the energy consumption; A larger Ev can save space or arrange more batteries.
2.1 Impact of different discharge rates on heat dissipation performance
Air cooling can be divided into natural convection cooling and forced convection cooling. Natural convection cooling does not rely on external forces such as fans. Due to uneven air temperature, a density difference is formed, which generates buoyancy under gravity and drives air flow.
Due to natural convection, a fan is not required, so the power consumption Wp of the fan is 0. Different discharge rates do not change the arrangement of the battery pack and have no effect on the energy density Ev.
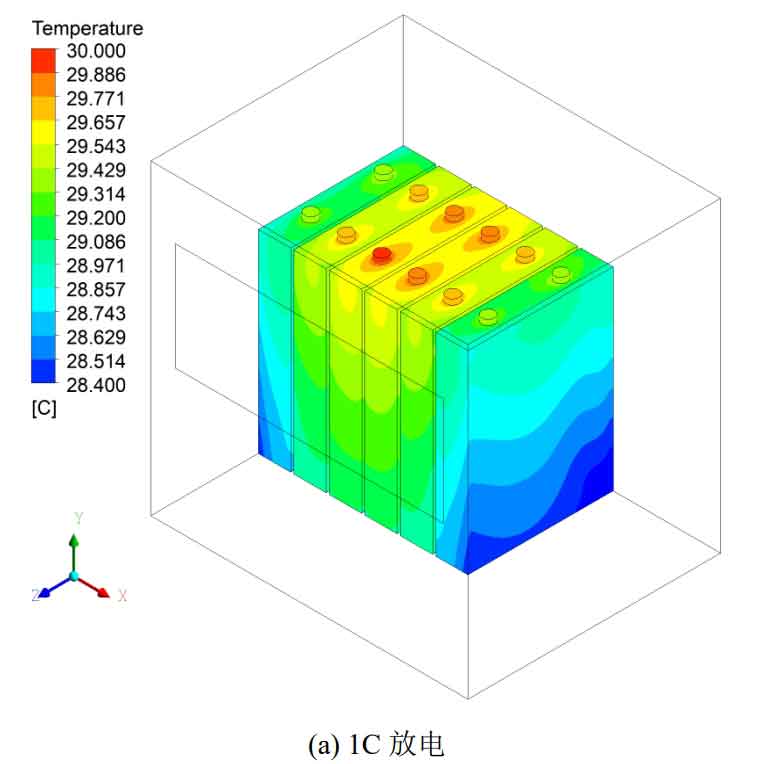
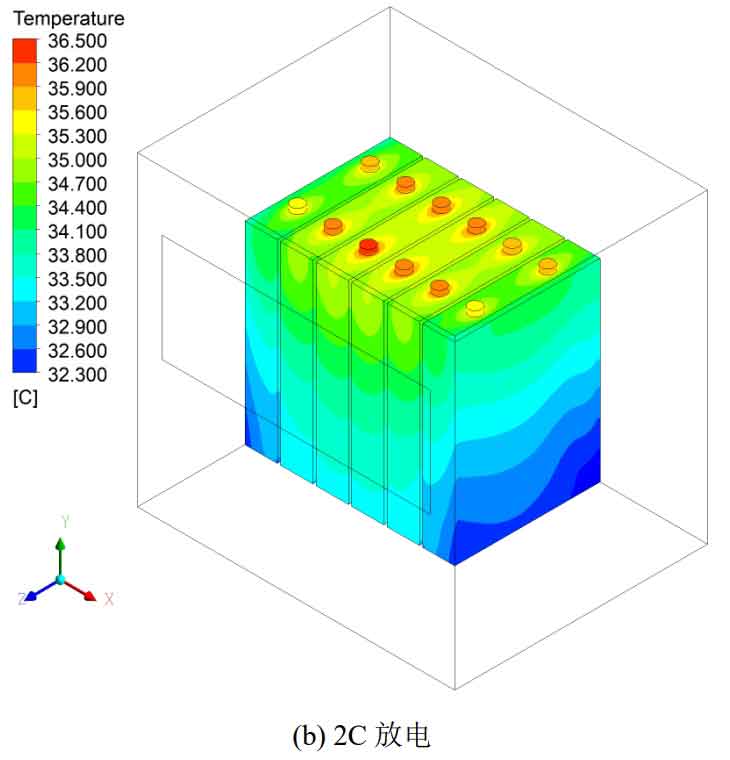
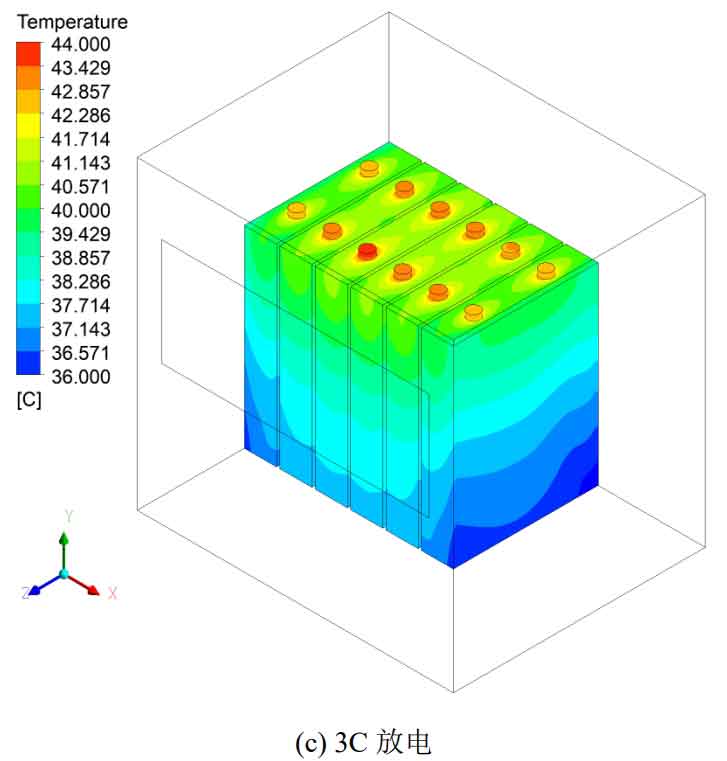
CFD simulation was conducted on the natural convection cooling of battery packs at discharge rates of 1C, 2C, and 3C, with an ambient temperature set at 25 ℃. The temperature distribution cloud diagram of the battery pack under different discharge rates is shown in Figure 2. From the figure, it can be seen that the temperature distribution of the battery pack is the same under different discharge rates, with lower temperatures at the bottom of the battery and the edges near the left and right inner walls of the battery pack module. Similar to the temperature cloud map during the discharge simulation of a single battery, the temperature near the pole column is higher, and the temperature distribution along the negative y-axis shows a downward trend.
| Discharge rate | Tmax/℃ | Δ Tmax/℃ |
| 1C | 30.1 | 1.8 |
| 2C | 36.4 | 4.3 |
| 3C | 43.7 | 7.9 |
The simulation results of natural convection in the battery pack under different discharge rates are listed in Table 4. From Table 4, it can be seen that as the discharge rate increases, the maximum temperature Tmax and maximum temperature difference Δ Tmax also increase. When the battery pack is discharged at a rate of 1C, Tmax and Δ The Tmax values are 30.1 ℃ and 1.2 ℃, respectively, which can meet the heat dissipation requirements under natural convection cooling; When the battery pack is discharged at a rate of 3C, Tmax and Δ Tmax increased by 13.6 ℃ and 6.1 ℃ compared to 1C rate discharge. At this point, natural convection is no longer sufficient to meet the heat dissipation needs of the battery pack, and a forced air cooling strategy needs to be adopted.
2.2 Impact of different inlet flow rates on heat dissipation performance
When natural convection cannot meet the heat dissipation needs, forced air cooling is required. In order to study the effect of inlet flow rate on the air cooling heat dissipation of battery packs, a simulation study was conducted within the range of 0.05m3/s (corresponding to inlet wind speed of 2m/s) to 0.2 m3/s (corresponding to inlet wind speed of 8m/s). The discharge rate of the battery pack is set to 3C, and the inlet temperature and ambient temperature are both 25 ℃.
The Reynolds number Re can be used to determine whether the flow is laminar or turbulent. It is generally believed that when Re ≤ 2300, the flow is laminar; When 2300 ≤ Re ≤ 10000, the flow is in a transitional state; When Re ≥ 10000, the flow is in a turbulent state. The expression for Reynolds number Re is as follows:
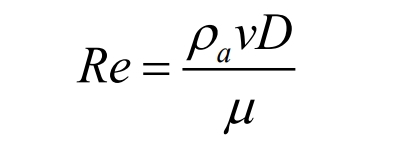
In the equation, ρ A is the air density, kg/m ^ 3; V is the air flow velocity, m/s; D is the feature length, m; μ Is the aerodynamic viscosity coefficient, Pa · s.
When the cross-section is rectangular, D can be calculated using the following formula:
In the formula, A is the rectangular area, m ^ 2; L is the circumference of the rectangle, m. The inlet size is 100mm × 250mm, taken into the formula, D=0.142857m can be obtained.
When the Re number is 10000, substitute the air density ρ a. Air viscosity μ With the characteristic length D, the air flow velocity v value at this time can be obtained to be 0.97m/s. When the air flow rate is greater than 0.97m/s, the flow is in a turbulent state. The minimum inlet flow rate studied is 0.05m/s, and the corresponding inlet wind speed is 2m/s. Therefore, the flow is in a turbulent state.
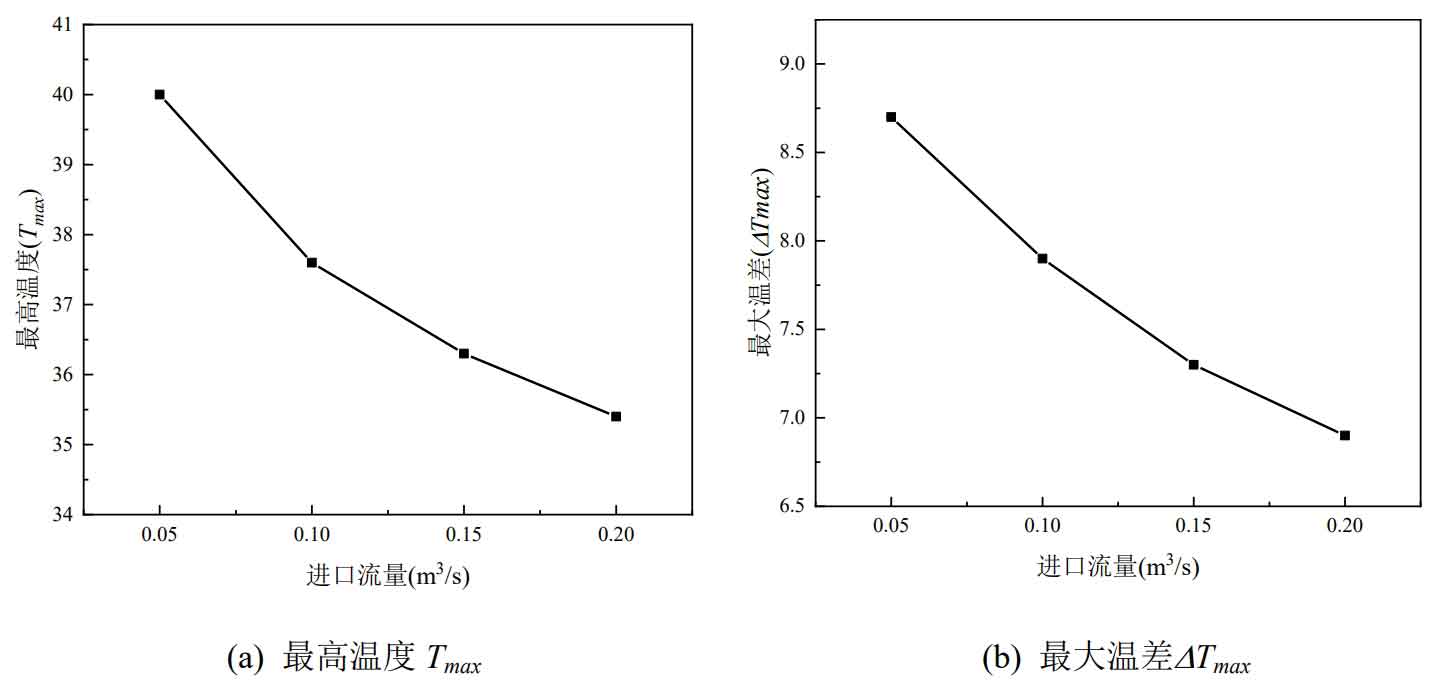
Figure 3 shows the variation of the maximum temperature and maximum temperature difference of the battery pack with the inlet flow rate. It can be clearly seen from the figure that Tmax and Δ Tmax decreases as the inlet flow rate increases. As the inlet flow rate increases, the wind speed passing through the battery surface also increases, the convective heat transfer coefficient increases, and more heat is taken away from the battery surface, resulting in a decrease in battery temperature and better heat dissipation performance. When the inlet flow rate is 0.20 m ^ 3/s, Tmax and Δ The Tmax values were 35.4 ℃ and 6.9 ℃, respectively, which decreased by 4.6 ℃ and 1.8 ℃ compared to the inlet flow rate of 0.05m ^ 3/s.
However, as the inlet flow rate increases, Tmax and Δ The rate of Tmax decrease slows down. When the inlet flow rate increases from 0.05m ^ 3/s to 0.10m ^ 3/s, Tmax and Δ Tmax decreased by 6.0% and 9.2% respectively; When the inlet flow rate increases from 0.15m ^ 3/s to 0.20m ^ 3/s, Tmax and Δ Tmax decreased by 2.5% and 5.5%, respectively.
Increasing the inlet flow rate can effectively improve the heat dissipation performance of the battery pack, which is beneficial for reducing the maximum temperature of the battery pack and improving temperature uniformity. But different inlet flow rates will result in different fans consuming different power Wp. The power consumption of the fan under different inlet flow rates is shown in Figure 4. As the inlet flow rate increases, Wp also continues to increase, and the rate of increase also continues to increase. As the inlet flow rate increases, the pressure difference between the inlet and outlet increases, resulting in an increase in Wp. The Wp value at an inlet flow rate of 0.20m ^ 3/s is nearly 8 times larger than the Wp value at an inlet flow rate of 0.10m ^ 3/s.
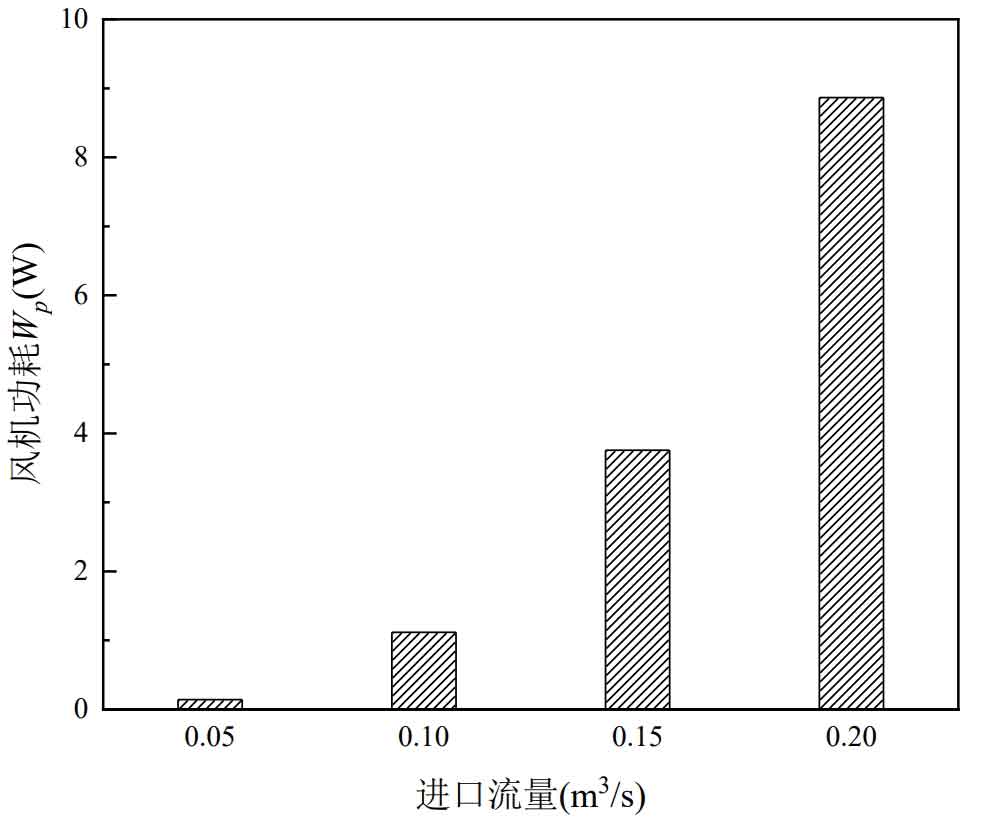
When the inlet flow rate increases from 0.15m ^ 3/s to 0.20m ^ 3/s, Tmax and Δ Tmax decreased by 2.5% and 5.5% respectively, while Wp increased by 135.9%. Increasing inlet flow and improving heat dissipation performance inevitably comes at the cost of rapidly increasing power consumption. Therefore, it is very important to choose an appropriate inlet flow rate based on heat dissipation needs to balance the mutual constraints between heat dissipation performance and power consumption.
2.3 Impact of different battery gaps on heat dissipation performance
In order to analyze the impact of different battery gaps on the air cooling and heat dissipation performance of battery packs, this article conducts simulation research on four arrangement scenarios of battery gaps d=0mm, d=1mm, d=3mm, and d=5mm. To ensure the uniqueness of the variables, the discharge rate of the battery pack under different cell gaps is 3C, and the inlet flow rate is 0.10m ^ 3/s. Maximum temperature Tmax and maximum temperature difference under different battery gaps Δ The size of Tmax is shown in Figure 5.
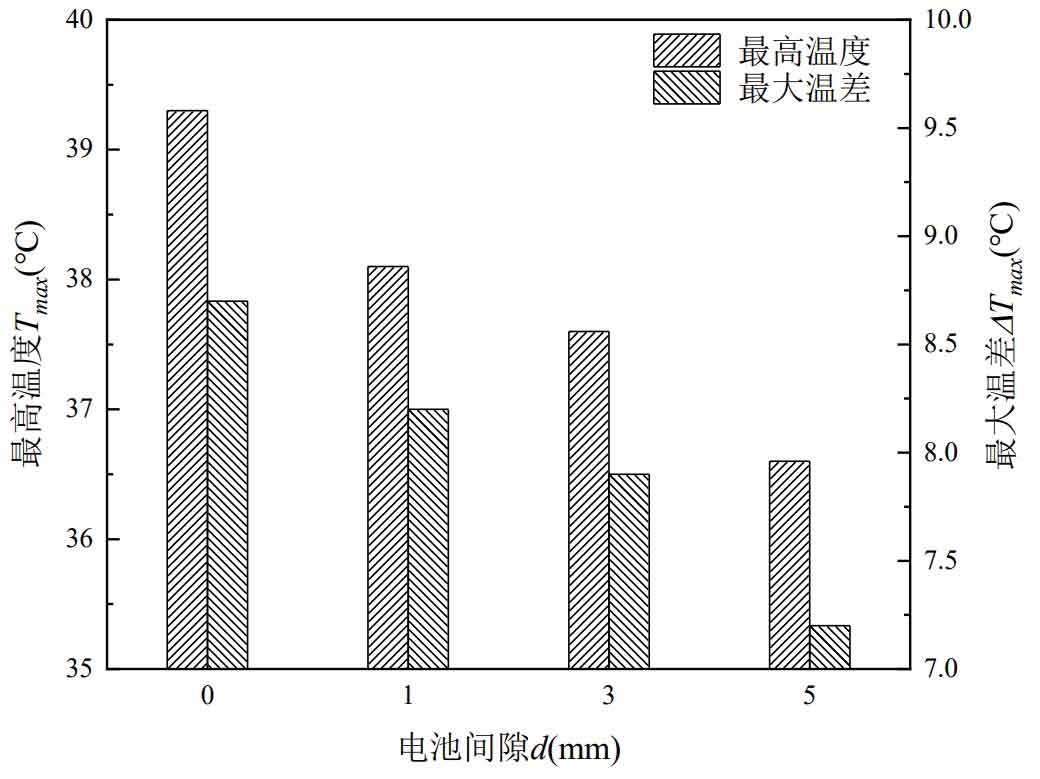
From Figure 5, it can be seen that Tmax and Δ Tmax decreases as the battery gap increases. When the battery gap is 0mm, it means that the single battery and the single battery are closely arranged together, with no gap in the middle, and the heat dissipation effect is the worst. The Tmax values for single cell batteries with gaps of 0mm, 1mm, 3mm, and 5mm are 39.3 ℃, 38.1 ℃, 37.6 ℃, and 36.6 ℃, respectively; Δ Tmax is 8.7 ℃, 8.2 ℃, 7.9 ℃, and 7.2 ℃, respectively. When the battery gap increases from 0mm to 5mm, Tmax and Δ Tmax decreased by 2.7 ℃ and 1.5 ℃, respectively.
The gap between individual batteries directly determines the size of the cooling channel area formed by the two individual batteries. As the battery gap increases, the flow resistance of the cooling channel air decreases, and the amount of air flowing through the cooling channel increases, resulting in an increase in the amount of heat carried away from the battery surface. Therefore, the heat dissipation effect is better. As an example, the temperature distribution cloud map at the end of discharge is shown in Figure 6, with a gap of 0mm and 5mm between individual batteries.
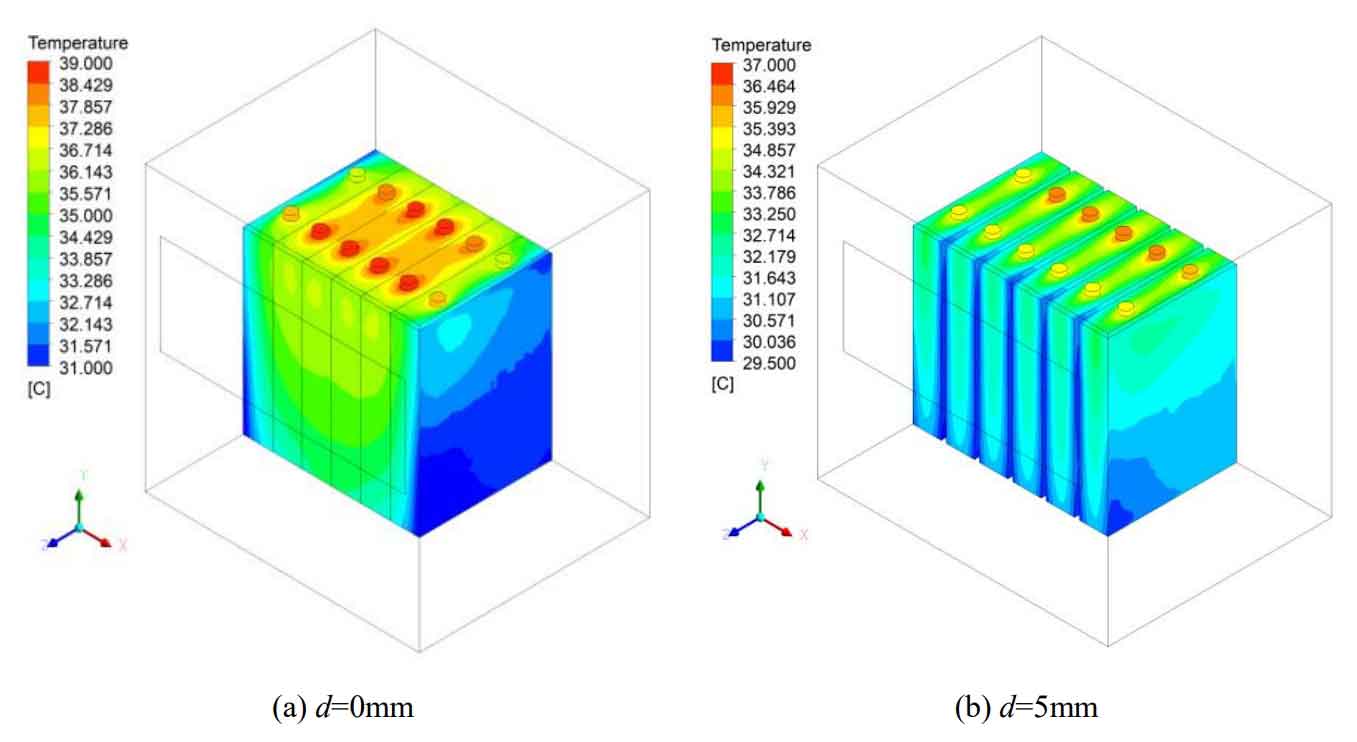
From Figure 6, it can be seen that when the battery gap d=0mm, due to the close proximity of the batteries, air can only flow through the battery surface near the left and right walls of the battery module, and heat exchange with it results in a lower surface temperature of these two batteries. When d=5mm, air flows through the cooling channels sandwiched between each two individual batteries, exchanging heat with each battery surface, resulting in better heat dissipation than when d=0mm.
Different battery gaps not only affect the maximum temperature and temperature difference of the battery pack, but also lead to different power consumption and volume energy density of the fan. The power consumption Wp and volume energy density Ev of the fan under different battery gaps are shown in Figure 7.
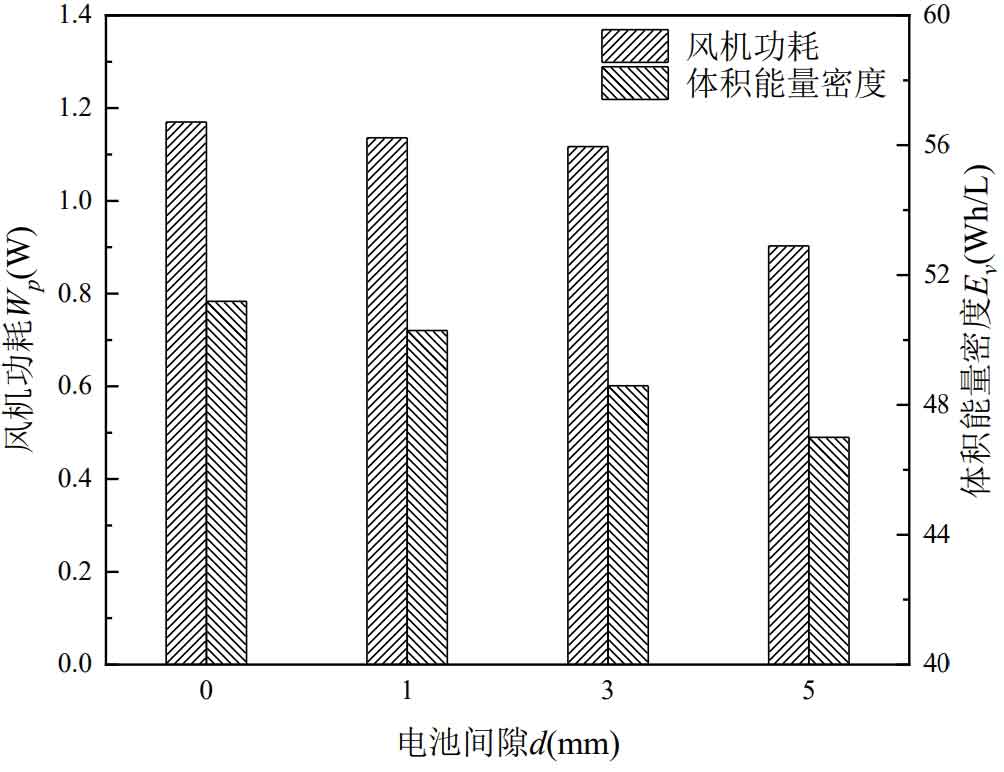
From Figure 7, it can be seen that Wp decreases as the battery gap increases. The Wp of single cell batteries with gaps of 0mm, 1mm, 3mm, and 5mm is 1.170 W, 1.136 W, 1.117 W, and 0.903 W, respectively. The battery gap increased from 0mm to 5mm, and Wp decreased by 22.8%. This is because the smaller the battery gap, the greater the air flow resistance, resulting in a greater pressure difference between the inlet and outlet, and an increase in the power consumption of the fan.
The different gaps between individual batteries, while ensuring that the distance between the battery pack and the module wall remains unchanged, will inevitably change the volume of the battery module. The larger the battery gap, the larger the volume of the battery module, resulting in a smaller volume energy density. The Ev values for single cell batteries with gaps of 0mm, 1mm, 3mm, and 5mm are 51.19Wh/L, 50.29Wh/L, 48.59Wh/L, and 47.00Wh/L, respectively.
In summary, a larger battery gap can improve the heat dissipation effect of the battery pack and reduce the power consumption of the fan, at the cost of increasing the volume energy density. Therefore, comprehensive consideration should be taken when arranging the battery arrangement in practice.
2.4 Impact of inlet layout on heat dissipation
The above discussion discusses the effects of discharge rate, inlet flow rate, and battery gap on the heat dissipation of the battery pack. In addition to these factors, the arrangement of the inlet also has an impact on heat dissipation. This article conducts simulation research on the distance h between different inlet and lower wall surfaces, as well as the horizontal distance s between inlet and edge batteries. Different h values determine the height of the inlet position, with the larger h, the higher the inlet position; The different s values determine the width of the inlet, and the larger the s value, the wider the inlet size. The discharge rate of the battery pack is set to 3C, and the inlet temperature is 25 ℃. When the inlet size is different, ensure that the inlet flow rate is equal, all of which are 0.10m ^ 3/s.
| Inlet height h/mm | Tmax/℃ | Δ Tmax/℃ | Wp/W |
| 50 | 38.0 | 8.7 | 11.183 |
| 90 | 37.7 | 8.3 | 11.831 |
| 130 | 37.6 | 7.9 | 11.172 |
The simulation results for different inlet positions are listed in Table 5. From the table, it can be seen that as the inlet position increases, the maximum temperature Tmax and maximum temperature difference of the battery pack Δ Tmax slightly decreased. When h increases from 50mm to 130mm, Tmax and Δ Tmax decreased by 0.4 ℃ and 0.8 ℃, respectively. The reason for this phenomenon is due to the temperature distribution of lithium-ion batteries. From the previous conclusions, it can be concluded that the temperature near the pole of lithium-ion batteries is relatively high, and the temperature shows an upward trend along the height direction of lithium-ion batteries. When the inlet position is high, the cold air with relatively low temperature directly flows through the area with higher temperature of the lithium-ion battery for heat exchange, so the heat dissipation performance is better than that of the case with lower inlet position. However, this factor has little impact on the heat dissipation performance of the battery pack.
The influence of different inlet heights on the power consumption of the fan is not significant. When the inlet height h is 90mm, Wp is slightly higher, but it is only 0.648W and 0.659W higher than when the inlet height h is 50mm and 130mm.
The width of the inlet is determined by the battery gap d and the horizontal distance s between the inlet and the edge battery. d is 3mm, just like the initial model. The larger the s value, the wider the inlet width. The simulation results of different s values are listed in Table 6, with an initial model inlet size of 100mm × 250mm, at which point the s value is 27.5mm.
| S/mm | Tmax/℃ | Δ Tmax/℃ | Wp/W |
| 5 | 36.9 | 7.5 | 16.316 |
| 10 | 37.2 | 7.7 | 14.704 |
| 15 | 37.3 | 7.7 | 11.831 |
| 27.5 | 37.6 | 7.9 | 11.172 |
From Table 6, it can be seen that as the inlet width increases, the maximum temperature Tmax and maximum temperature difference of the battery pack Δ Tmax also increased, but the change was not significant. When s increases from 5mm to 27.5mm, Tmax and Δ Tmax decreased by 0.8 ℃ and 0.4 ℃, respectively. To ensure uniform variables, the inlet flow rate remains constant. However, when the inlet width decreases and the inlet length remains constant, the area of the inlet decreases. Therefore, the inlet wind speed naturally increases, and the wind speed flowing over the battery surface also increases accordingly, resulting in better heat dissipation effect. In addition, the decrease in inlet width can be understood as an increase in the flow rate through the cooling channel sandwiched between the single battery, resulting in a decrease in the flow rate through the cooling channel sandwiched between the edge battery and the wall of the battery pack module, and a more concentrated flow of cold air through the gaps of the single battery.
However, as the inlet width decreases, the air flow resistance increases, leading to an increase in the power consumption of the fan. When s decreased from 27.5mm to 5mm, Wp increased by 46.1%.
2.5 The impact of battery module volume on heat dissipation
The volume of the battery module directly determines the volume of the battery cabinet and has a direct impact on the volume energy density. The two parameters that determine the volume of the battery module are: the distance between the battery pack and the left, right, upper and lower walls is a, and the distance between the wall where the inlet and outlet are located is c. Simulate and study the effects of different c and a values on the heat dissipation performance of the battery pack.
| C/mm | Tmax/℃ | Δ Tmax/℃ | Wp/W | Ev/Wh · L^-1 |
| 30 | 36.6 | 7.2 | 23.834 | 58.56 |
| 50 | 37.6 | 7.9 | 11.172 | 48.59 |
| 70 | 37.5 | 7.6 | 6.186 | 41.52 |
The simulation results of air-cooled heat dissipation for different battery packs and the wall distance c where the inlet and outlet are located are listed in Table 7. Firstly, as the distance between the battery pack and the inlet and outlet increases, the volume of the battery module increases, and the volume energy density Ev will inevitably decrease. When the c value increases from 30mm to 70mm, Ev decreases by 29.1%. The trend of wind turbine consumption power Wp is opposite to Ev, and as the c value increases, Wp continuously decreases. The farther the battery pack is from the inlet and outlet, the smaller the air flow resistance and Wp. When the c value increases from 30mm to 70mm, Wp decreases by 74%.
From the perspective of heat dissipation effect, when the c value is small, the heat dissipation effect is better. When c is 30mm, Tmax and Δ The Tmax is 36.6 ℃ and 7.2 ℃, respectively, which is 1.0 ℃ and 0.6 ℃ lower than when c is 50mm. As the distance between the battery pack and the inlet and outlet continues to increase, the heat dissipation effect will not continue to deteriorate. When the c value increases from 50mm to 70mm, Tmax and Δ Tmax actually decreased by 0.1 ℃ and 0.3 ℃.
The simulation results of air-cooled heat dissipation for different battery packs and the distance a between the left and right, upper and lower wall surfaces are listed in Table 8. Due to the correlation between the value of a and the horizontal distance s between the inlet and the edge battery, in order to ensure uniform variables, the values of s are set to 10mm. From Table 8, it can be seen that the effect of a value on battery pack heat dissipation is similar to that of c value on battery pack heat dissipation. The volume of the battery pack module increases as the distance between the battery pack and the left, right, and colonel walls increases, resulting in a decrease in the volume energy density Ev. When the value of a increases from 30mm to 70mm, Ev decreases by 42.6%. It can be seen that the influence of a value on Ev is greater than that of c value, because increasing a value is equivalent to increasing the length and height of the battery module, while increasing c value only increases the width of the battery pack. The power consumption Wp of the fan decreases with the increase of a value, but the increase amplitude decreases. When the value of a increases from 30mm to 50mm, Wp decreases by 54.5%; When the value of a increases from 50mm to 70mm, Wp only decreases by 7.1%.
When the value of a is 30mm, the air cooling and heat dissipation effect of the battery pack is better, with Tmax and Δ Tmax is 36.2 ℃ and 7.2 ℃, respectively; When the value of a increases to 50mm, Tmax and Δ Tmax increased by 1 ℃ and 0.5 ℃ compared to a value of 30mm. Continuing to increase the value of a, the heat dissipation effect remains almost unchanged. Compared with the two cases where the value of a is 50mm and 70mm, Tmax and Δ Tmax only changed by 0.1 ℃.
| α/mm | Tmax/℃ | Δ Tmax/℃ | Wp/W | Ev/Wh · L^-1 |
| 30 | 36.2 | 7.2 | 32.346 | 65.39 |
| 50 | 37.2 | 7.7 | 14.704 | 48.59 |
| 70 | 37.3 | 7.6 | 13.662 | 37.52 |
In summary, increasing the volume of the battery pack module will to some extent improve heat dissipation performance, but further increase will not continuously improve heat dissipation performance. Increasing the volume of the battery pack module will reduce the power consumption of the fan, but it will also reduce the energy density of the battery pack module volume.
3. Analysis of cooling strategies under different operating modes
According to the previous conclusion, reducing the discharge rate and increasing the inlet flow rate and battery gap can improve the heat dissipation performance of the battery pack, resulting in a lower maximum temperature Tmax of the battery pack. In addition, the temperature of the inlet air also has an impact on the heat dissipation of the battery pack. The lower the inlet temperature, the greater the temperature difference between the air and the surface temperature of the battery, which naturally carries more heat away, resulting in a lower Tmax.
The air flow required to achieve the same heat dissipation performance is naturally different for battery packs operating at different magnification rates, as well as for different battery gaps and inlet temperatures. The better the heat dissipation performance, the lower the air flow required and the less energy consumed. The recommended operating temperature for lithium-ion batteries is 25 ℃~40 ℃, and their performance is optimal within this temperature range. Therefore, with the highest temperature Tmax of the battery pack reaching 40 ℃ as the critical point, it is considered that Tmax below 40 ℃ meets the heat dissipation demand. It is of great significance to determine the critical inlet flow rate required for battery packs to meet heat dissipation needs at different discharge rates, battery gaps, and inlet temperatures through CFD simulation research, which can save energy consumption and provide guidance for practical cooling strategies. The upper limit of the inlet flow rate is set to 0.25m ^ 3/s, and the inlet wind speed is 10m/s. If the maximum temperature Tmax of the battery pack still exceeds 40 ℃ when the inlet flow rate reaches 0.25m ^ 3/s, it is considered that the heat dissipation demand cannot be met in this situation. Correspondingly, when the inlet air volume is 0.25m ^ 3/s and the maximum temperature Tmax of the battery pack is 40 ℃, the inlet temperature at this time is the critical inlet temperature for this situation.
We have comprehensively considered the impact of the discharge rate (1C, 2C, and 3C) of the battery pack, inlet temperature (20 ℃, 24 ℃, 28 ℃, 32 ℃, and 35 ℃), and individual cell gap (0mm, 1mm, 3mm, and 5mm) on the critical inlet flow rate. When the inlet flow rate is 0m ^ 3/s, it represents natural convection heat dissipation, and the inlet temperature is the ambient temperature. The critical inlet flow required to meet the heat dissipation requirements under different operating conditions is shown in Figure 8.
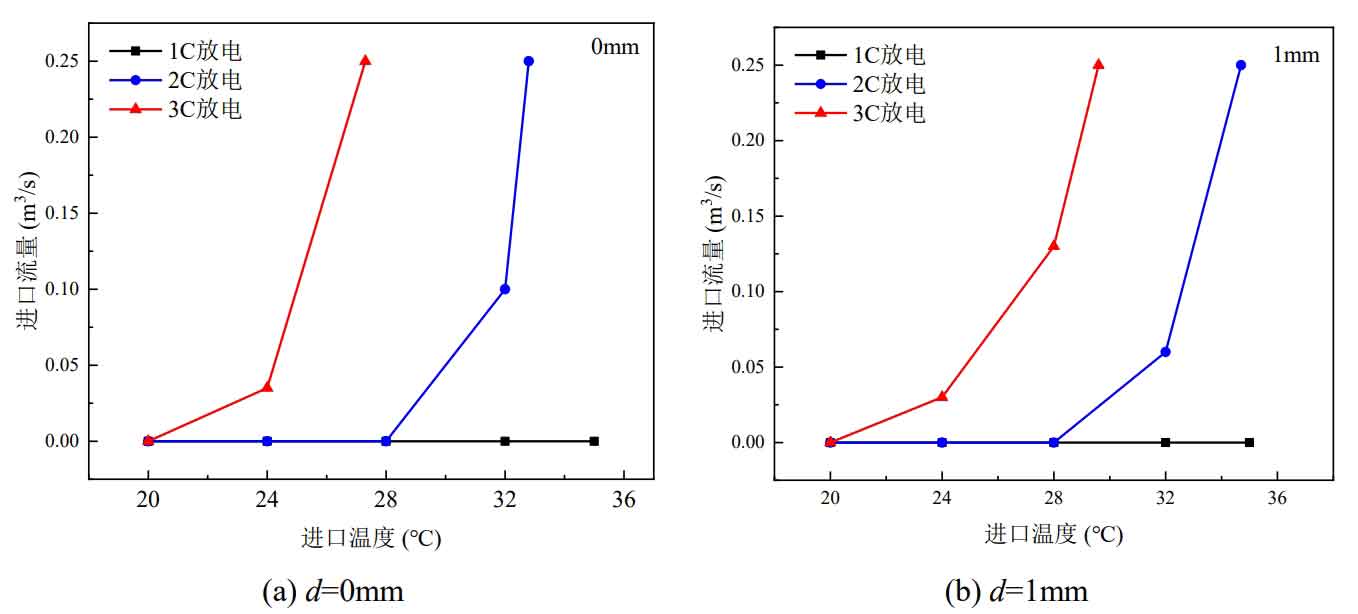
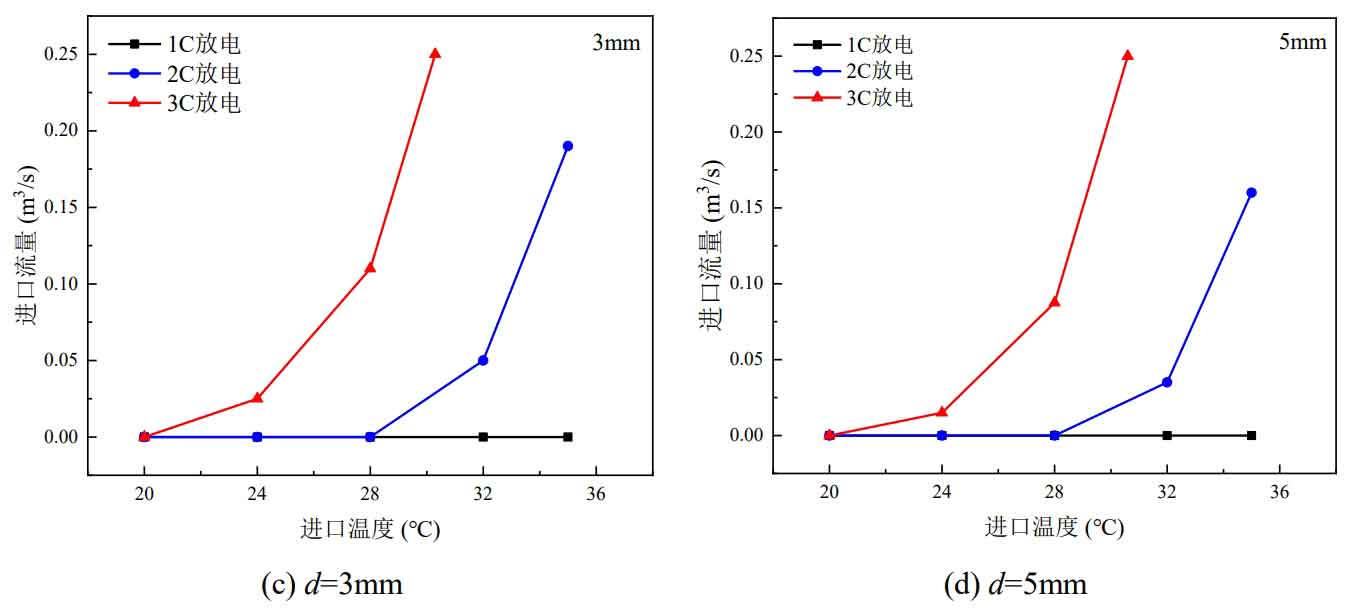
From Figure 8, it can be seen that when the battery pack is discharged at a rate of 1C, even when the ambient temperature reaches 35 ℃ and the battery gap is 0mm, the natural convection heat dissipation method can still meet the heat dissipation needs of the battery pack. This is because the temperature rise of the battery pack during discharge at 1C rate is relatively small, and the temperature rise results of the single cell discharge experiment can explain this phenomenon. When the ambient temperature is 20 ℃, natural convection can meet the heat dissipation needs, even if the battery pack is discharging at a rate of 3C. When the battery pack is discharged at a rate of 2C and the ambient temperature is below 28 ℃, natural convection heat dissipation can be used. If the temperature exceeds 28 ℃, a forced air cooling strategy needs to be adopted.
Overall, as the inlet temperature increases, the required inlet flow rate also increases. The higher the inlet temperature, the smaller the temperature difference with the battery surface, and the heat transfer is positively correlated with the temperature difference and flow rate. Therefore, in order to meet the heat dissipation demand, the wind speed passing through the battery surface can only be increased, which requires a larger inlet flow rate. In addition, regardless of whether the battery pack is discharged at 2C or 3C rates, as the battery gap decreases, the slope of the critical inlet flow curve increases, which means that the inlet flow required to meet heat dissipation needs is smaller at the same inlet temperature. Taking the 2C rate discharge of the battery pack as an example, when the inlet temperature is 32 ℃ and the battery gap is 5mm, 3mm, 1mm, and 0mm, the critical inlet flow rates are 0.035m ^ 3/s, 0.05 m ^ 3/s, 0.06m ^ 3/s, and 0.1m ^ 3/s, respectively; When the inlet temperature is 35 ℃ and the battery gap is 5mm and 3mm, the critical inlet flow rates are 0.16m ^ 3/s and 0.19m ^ 3/s, respectively. However, when the battery gap is 1mm and 0mm, the inlet flow rate reaches the upper limit (0.25m ^ 3/s) and still cannot meet the heat dissipation demand. At this time, the critical inlet temperatures are 34.7 ℃ and 32.8 ℃, respectively.
It can be seen that as the battery gap decreases, the critical inlet temperature also decreases, which means a lower inlet temperature is required to meet the heat dissipation needs of the battery pack. When the battery pack is discharged at a 3C rate, the critical inlet temperatures for battery gaps of 5mm, 3mm, 1mm, and 0mm are 30.6 ℃, 30.3 ℃, 29.6 ℃, and 27.3 ℃, respectively.
The above research is only based on the single discharge behavior of the battery pack. Due to the fact that the actual operation of the battery energy storage system requires the charging and discharging processes of the battery, this article further simulates the cycle mode of the battery pack’s single charge and discharge. Two arrangement methods of battery gaps of 0mm and 3mm were considered. The critical inlet flow rate required to meet the heat dissipation requirements under different operating conditions under one charging and discharging cycle is shown in Figure 9.
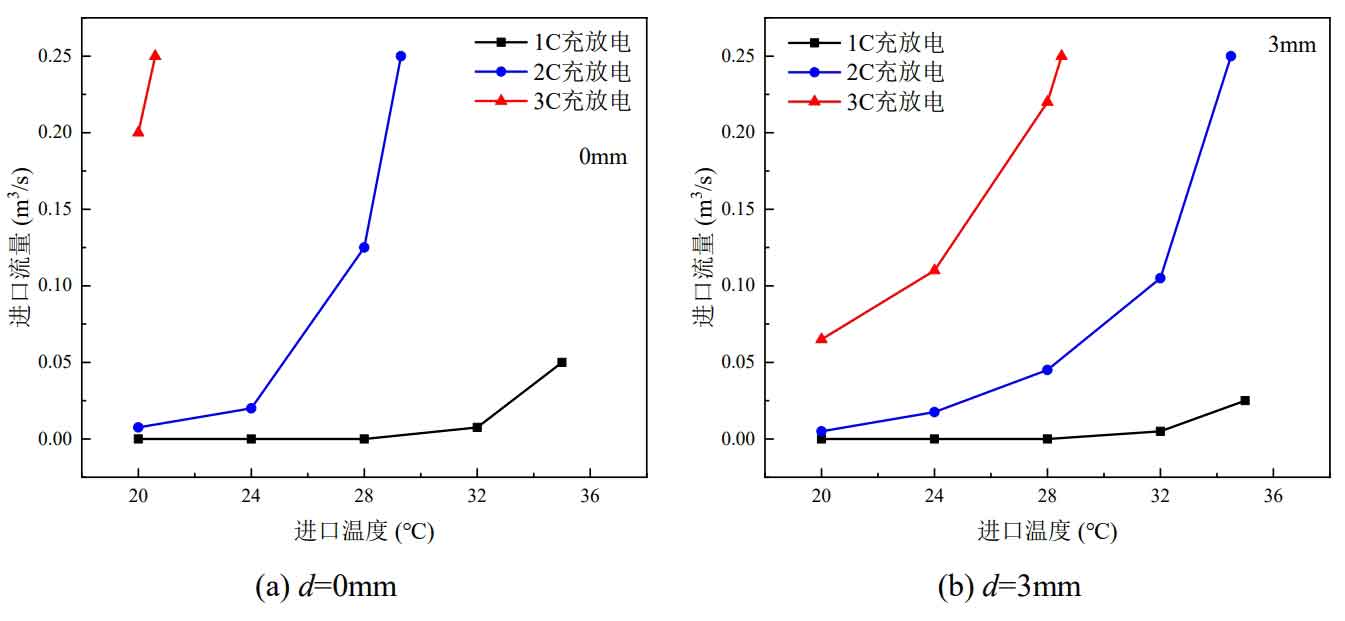
From Figure 9, it can be seen that compared to a single discharge process, under a single charge discharge cycle, the battery pack requires a higher inlet flow rate to meet heat dissipation needs. When the ambient temperature exceeds 32 ℃, even if the battery pack is charged and discharged at a rate of 1C, forced air cooling still needs to be used; As for cycling charging and discharging at a rate of over 2C, even if the ambient temperature is as low as 20 ℃, the natural convection heat dissipation method cannot meet the heat dissipation needs of the battery pack. This is because batteries also generate heat during the charging process. Compared to a single discharge process, the electrochemical reaction time inside the battery during a single charge discharge cycle is longer, which is equivalent to twice the time of a single discharge process. Therefore, more heat is generated, resulting in higher battery temperature and more unfavorable heat dissipation.
Taking 2C rate as an example, under a single discharge operation mode at an inlet temperature of 32 ℃, the critical inlet flow rates for battery gaps of 3mm and 0mm are 0.05 m ^ 3/s and 0.1 m ^ 3/s, respectively; In a single charge discharge cycle operation mode, the critical inlet flow rate is 0.105m ^ 3/s when the battery gap is 3mm, and cannot meet the heat dissipation demand when the battery gap is 0mm. At this time, the critical inlet temperature is 29.3 ℃. When the battery pack is charged and discharged at a rate of 3C in one cycle, the critical inlet temperatures with a gap of 0mm and 3mm are 20.6 ℃ and 28.5 ℃, respectively, which are 6.7 ℃ and 1.8 ℃ lower than those during a single discharge process.
In summary, the more conducive it is to heat dissipation (such as reducing the charging and discharging rate, increasing the battery gap, and reducing the inlet temperature), the less inlet flow is required, and the more energy consumption is saved. But at the same time, each factor that benefits heat dissipation comes with a corresponding cost, such as reducing the charging and discharging rate, requiring more batteries to be connected in parallel or series while the power demand remains unchanged, increasing the number of batteries and resulting in a larger footprint; The direct consequence of increasing the battery gap is to increase the volume of the battery module, leading to a decrease in volume energy density and ultimately resulting in a larger footprint; Reducing the inlet temperature requires additional refrigeration equipment to consume energy. The lower the inlet temperature, the higher the corresponding energy consumption. In addition, prolonged battery operation also has a negative impact on heat dissipation performance. The longer the operation time, the less conducive it is to heat dissipation. Heat dissipation can only be achieved by increasing the inlet flow rate or reducing the inlet temperature, which undoubtedly increases energy consumption.
Established a CFD simulation model for air cooling and heat dissipation of the battery pack, using the maximum temperature Tmax and maximum temperature difference of the battery pack Δ Four evaluation indicators, Tmax, fan consumption power Wp, and volumetric energy density Ev, were simulated and analyzed to investigate the effects of different discharge rates, inlet flow rates, battery gaps, inlet arrangement methods, and different battery pack module volumes on heat dissipation performance. Finally, the cooling strategies under different operating conditions were comprehensively analyzed, and the critical inlet flow rate and critical inlet temperature were given.
The main conclusions are as follows:
(1) As the discharge rate of the battery pack increases, the maximum temperature Tmax and maximum temperature difference Δ Tmax of the battery pack also increase. Under the 3C rate discharge of the battery pack, natural convection heat dissipation is adopted, with Tmax and Δ The Tmax reached 43.7 ℃ and 7.9 ℃, which were 13.6 ℃ and 6.1 ℃ higher than those during 1C rate discharge.
(2) Increasing the inlet flow rate can effectively improve the heat dissipation performance of the battery pack, but the power consumption Wp of the fan also increases accordingly. The battery pack is discharged at a 3C rate, and when the inlet flow rate increases from 0.15m ^ 3/s to 0.20m ^ 3/s, Tmax and Δ Tmax decreased by 2.5% and 5.5% respectively, while Wp increased by 135.9%. When selecting the inlet flow rate, the relationship between heat dissipation performance and power consumption should be balanced based on the actual situation.
(3) Increasing the gap between individual batteries is beneficial for the heat dissipation performance of the battery pack, and it will reduce Wp, but it will reduce the volume energy density Ev and occupy more space.
(4) Reducing the volume of the battery pack module appropriately (such as when the battery pack is 30mm away from the wall) can enhance the heat dissipation effect and save space, but the power consumption Wp of the fan is relatively large.
(5) A comprehensive analysis was conducted on the cooling strategies under different operating modes, providing critical inlet flow rates for different discharge rates, battery gaps, inlet temperatures, and operating times. The upper limit of the inlet flow rate was specified, and the corresponding critical inlet temperature was given. The higher the discharge rate, the smaller the battery gap, the higher the inlet temperature, and the longer the operating time, the more unfavorable it is for dissipation. The required critical inlet flow rate is larger, and the critical inlet temperature is lower when the heat dissipation demand cannot be met.