
The accurate prediction of the state of charge (SOC) and available capacity of a lithium ion battery is a cornerstone for the reliable and efficient operation of modern energy systems. From electric vehicles to grid-scale storage and portable electronics, the ability to know precisely how much energy remains in a battery under varying conditions directly impacts system performance, safety, and user experience. Traditionally, the Peukert equation has served as a foundational empirical model for estimating battery capacity under constant discharge current. However, its significant limitation lies in its inability to account for the dynamic thermal and electrical conditions that a lithium ion battery invariably experiences in real-world applications. Discharge rates fluctuate, and ambient temperatures vary, causing the internal temperature of the battery to change, which in turn dramatically affects its electrochemical behavior and available capacity. This work addresses this critical gap by developing and validating an enhanced capacity prediction model that extends the Peukert equation to accurately forecast the usable capacity of a lithium ion battery under variable temperature and discharge rate conditions.
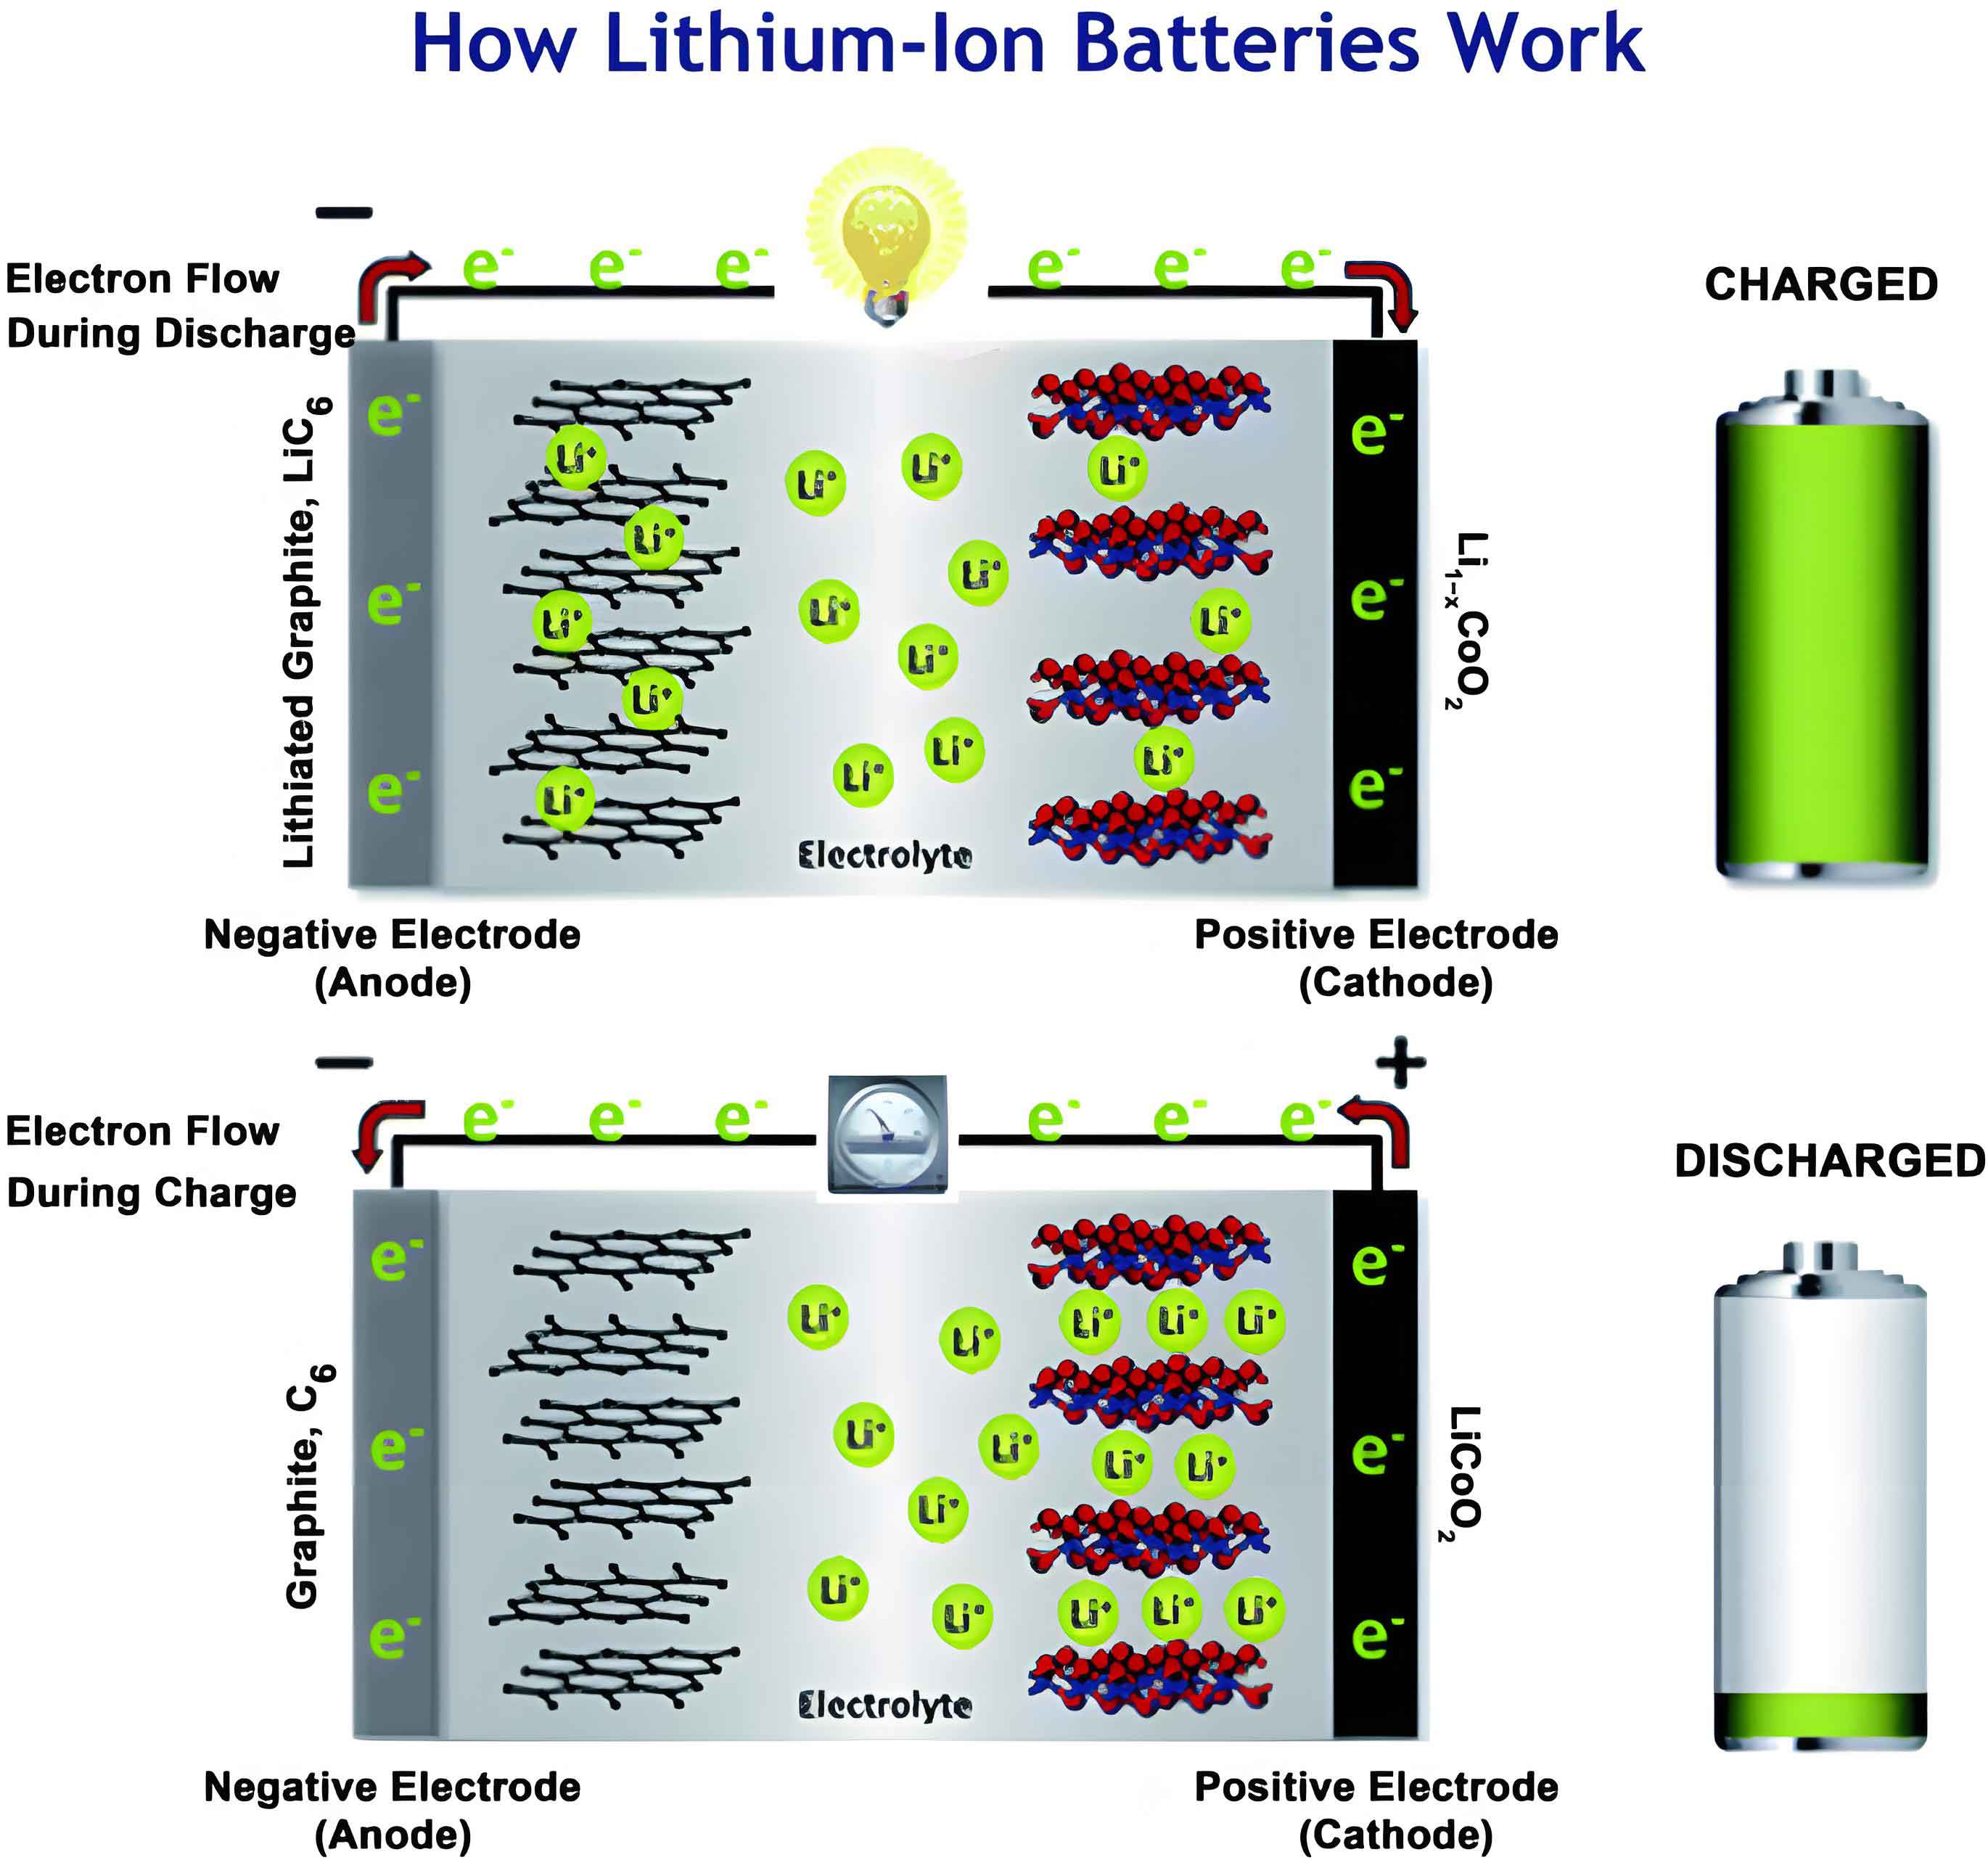
The classical Peukert’s law describes the relationship between the discharge current and the delivered capacity of a battery at a constant temperature. It is expressed as:
$$ C_p = I^k \cdot t $$
or, in its more common form relating nominal capacity, current, and time-to-discharge:
$$ I^k \cdot t = \text{constant} $$
where \( C_p \) is the capacity delivered at current \( I \), \( t \) is the discharge time, and \( k \) is the Peukert constant (typically >1 for lead-acid and lithium ion battery systems). This model implies that at higher currents, the usable capacity of the battery diminishes. While useful for constant current scenarios, this formulation fails when both the current \( I \) and, more importantly, the battery temperature \( T \) are not constant. In practical operation, the internal temperature of a lithium ion battery rises due to Joule heating and electrochemical reaction heat, especially at high discharge rates. Since the kinetics of lithium-ion intercalation/de-intercalation and the conductivity of the electrolyte are strongly temperature-dependent, this self-heating effect significantly influences the actual available capacity. An average current or a fixed temperature assumption, therefore, introduces substantial error.
To overcome these limitations, we propose an enhanced, state-based model. We define the state of charge (SOC) in terms of the remaining effective capacity, \( C_r \). The core idea is to track the consumption of this effective capacity over time, where the rate of consumption is a function of both the instantaneous discharge current and the instantaneous battery temperature. The governing update equation is:
$$ C_r^{t+1} = C_r^{t} – \Delta C_r $$
The key innovation lies in the definition of \( \Delta C_r \), the amount of effective capacity consumed in a time interval \( \Delta t \). We posit that it is not simply the product of current and time (\( I \cdot \Delta t \)), but this product scaled by a dynamic compensation coefficient \( k(I, T) \):
$$ \Delta C_r = k(I, T) \cdot I \cdot \Delta t = k(I, T) \cdot \Delta C $$
Here, \( \Delta C \) is the measured ampere-hour throughput. The coefficient \( k(I, T) \) encapsulates the non-ideal effects: at high currents or low temperatures, \( k > 1 \), meaning each ampere-hour drawn from the battery depletes more than one unit of effective capacity. Under favorable conditions (low current, optimal temperature), \( k \approx 1 \). For a lithium ion battery, the temperature dependence is particularly critical and often dominates the rate dependence under many operational profiles.
From extensive experimental data, we observe that the relationship between capacity retention and temperature for a lithium ion battery is highly non-linear. At elevated temperatures, the capacity variation is relatively muted. However, as temperature decreases, the available capacity drops precipitously due to increased internal resistance and slowed ionic diffusion. To model this, we adopt an Arrhenius-type formulation for the temperature-dependent part of the compensation coefficient. We initially separate the effects, focusing on a temperature compensation factor \( k(T) \), acknowledging that in high-energy lithium ion battery cells, the current’s effect is often mediated through the temperature change it induces. We propose:
$$ k(T) = a – b \cdot e^{(c/T)} $$
where \( T \) is the absolute temperature (in Kelvin) of the battery, and \( a \), \( b \), and \( c \) are parameters determined from experimental data. This form captures the asymptotic behavior: as \( T \) becomes very large, \( k(T) \) approaches \( a \); as \( T \) decreases, the exponential term grows, reducing \( k(T) \) and reflecting greater capacity loss per unit of discharge. The parameter \( c \) is related to the activation energy of the limiting electrochemical processes.
To parameterize and validate this model, a comprehensive experimental study was conducted. A high-capacity commercial lithium iron phosphate (LiFePO4) lithium ion battery was subjected to discharge tests under a matrix of conditions. The test matrix encompassed nine ambient temperature levels (-20°C, -10°C, 0°C, 10°C, 15°C, 25°C, 35°C, 45°C, 55°C) and four constant discharge rates (C/3, C/2, 1C, 2C). The battery was fully charged and then discharged to the cutoff voltage at each condition. Crucially, instead of relying solely on ambient temperature, the battery’s internal temperature was approximated by monitoring multiple surface points (positive terminal, negative terminal, and casing) and calculating a real-time average. This provides a more accurate representation of the electrochemical environment within the lithium ion battery compared to the ambient temperature, especially during high-rate discharges where significant self-heating occurs.
| Parameter | Value |
|---|---|
| Chemistry | Lithium Iron Phosphate (LiFePO4) |
| Rated Capacity | 105 Ah |
| Nominal Voltage | 3.2 V |
| Charge Cut-off Voltage | 3.65 V |
| Discharge Cut-off Voltage | 2.5 V |
| Internal Resistance | ≤ 0.5 mΩ |
The experimental results clearly illustrate the complex interplay between rate, ambient temperature, and battery temperature. A summary of the delivered capacity (as a fraction of the rated capacity) is shown below, highlighting the dominant trends.
| Ambient Temp (°C) | C/3 | C/2 | 1C | 2C |
|---|---|---|---|---|
| -20 | 0.55 | 0.51 | 0.49 | 0.46 |
| -10 | 0.79 | 0.76 | 0.75 | 0.78 |
| 0 | 0.90 | 0.90 | 0.89 | 0.90 |
| 10 | 0.96 | 0.94 | 0.94 | 0.94 |
| 15 | 0.98 | 0.96 | 0.92 | 0.93 |
| 25 | 0.97 | 0.96 | 0.95 | 0.96 |
| 35 | 0.96 | 0.96 | 0.95 | 0.95 |
| 45 | 0.97 | 0.97 | 0.97 | 0.97 |
| 55 | 0.98 | 0.98 | 0.98 | 0.98 |
The data reveals two key regimes. For ambient temperatures at or above 25°C, the discharge rate has a negligible impact on the final delivered capacity of the lithium ion battery. All values cluster around 95-98% of the rated capacity. This indicates that within this temperature range, the inherent Peukert effect (capacity reduction with current) is minimal or is compensated by beneficial warming from self-heating. In stark contrast, for sub-25°C environments, the capacity is severely affected, showing a strong dependence on both temperature and discharge rate. At -20°C, capacity plummets to nearly half. Interestingly, for a given low ambient temperature (e.g., -10°C, 0°C), the capacity does not monotonically decrease with increasing rate; instead, it sometimes shows a slight recovery at the highest rate (2C). This is a direct consequence of self-heating: the high current rapidly warms the lithium ion battery, raising its internal temperature and partially offsetting the initial low-temperature penalty. This phenomenon underscores why battery temperature, not ambient temperature, is the correct variable for modeling.
We therefore analyze the capacity retention (the ratio of delivered capacity to rated capacity) as a function of the measured average battery temperature throughout the discharge. Plotting this data yields a characteristic curve. To derive the parameters \( a \), \( b \), and \( c \) for our model \( k(T) = a – b \cdot e^{(c/T)} \), we fit it to this capacity-temperature data. The fitting is performed using a least squares regression approach. The model is linearized for regression as follows. We set the capacity retention \( \mu = C_{delivered}/C_{rated} \). Assuming that at an ideal reference condition \( \mu_{ref} = a \), we have:
$$ a – \mu = b \cdot e^{(c/T)} $$
Taking the natural logarithm of both sides:
$$ \ln(a – \mu) = \ln(b) + c \cdot \frac{1}{T} $$
This is a linear equation in terms of \( \ln(a – \mu) \) and \( 1/T \). By iteratively optimizing for \( a \) and performing linear regression on \( \ln(a – \mu) \) vs. \( 1/T \), we obtain the best-fit parameters.
The optimal fit to our experimental data from the lithium ion battery yields the following parameters:
$$ a = 1.032, \quad b = 4.666 \times 10^{-10}, \quad c = 5417 \, \text{K} $$
Thus, the temperature compensation coefficient model is:
$$ k(T) = 1.032 – 4.666 \times 10^{-10} \cdot e^{(5417 / T)} $$
where \( T \) is in Kelvin. The effective capacity consumed during any small time interval is then:
$$ \Delta C_r = \left( 1.032 – 4.666 \times 10^{-10} \cdot e^{(5417 / T(t))} \right) \cdot I(t) \cdot \Delta t $$
The total effective capacity used from a full state to termination is the integral of this quantity. If the starting effective capacity is the rated capacity (105 Ah), the model’s prediction for the delivered capacity under arbitrary conditions should match the measured value when the integral of \( \Delta C_r \) reaches 105 Ah.
To validate the model’s predictive power, we applied it retrospectively to our various constant-current discharge tests. For each test, we used the recorded time-series data of battery temperature \( T(t) \) and constant current \( I \). We numerically integrated the model equation until it reached the rated capacity (105 Ah). The time at which this occurred is the model-predicted discharge time. Multiplying this time by the constant current gives the model-predicted deliverable capacity. The results for the low and medium temperature regimes are summarized below.
| Ambient Temp (°C) | Discharge Rate | Model-Predicted Effective Capacity Consumed to Reach Cutoff (Ah) | Remarks |
|---|---|---|---|
| -20 | C/3 | ~147.6 | High deviation, indicating extreme low-T behavior may need further model refinement. |
| -10 | C/3 | ~108.3 | Predicted effective capacity consumption clusters near the rated 105 Ah, demonstrating model accuracy. The variation is small, confirming that the model successfully normalizes different conditions to a consistent effective capacity baseline. |
| -10 | 1C | ~103.6 | |
| 0 | C/2 | ~102.0 | |
| 0 | 2C | ~106.0 | |
| 10 | C/3 | ~108.9 | |
| 10 | 1C | ~106.1 | |
| 15 | C/2 | ~109.0 | |
| 15 | 2C | ~107.0 | |
| 25 | 1C | ~109.0 | |
| 35 | 2C | ~109.2 |
The validation shows that for most conditions (ambient temperatures from -10°C to 35°C), the model predicts that discharging the battery to its voltage cutoff corresponds to consuming an effective capacity very close to its rated 105 Ah. This is a powerful result. It means that regardless of whether the battery was cold and discharged slowly or warmer and discharged rapidly, the underlying “effective energy” removed is constant. The model successfully compensates for the temperature and rate effects, translating them into a unified measure of capacity depletion. The exception at -20°C suggests that at extremely low temperatures, other mechanisms (like solid electrolyte interface (SEI) resistance growth or lithium plating) that are not fully captured by a simple Arrhenius-type kinetic model may become dominant, warranting further study.
The implications of this enhanced model are significant for battery management systems (BMS). By implementing this lithium ion battery capacity tracking algorithm, a BMS can maintain a much more accurate estimate of SOC during dynamic operation. Consider an electric vehicle starting on a cold morning: initial discharge at high power from a cold battery would be assigned a high \( k(T) \) factor, causing the SOC to drop rapidly per ampere-hour drawn, correctly reflecting the lower usable energy. As the battery pack warms up from self-heating and external heating, the \( k(T) \) factor would decrease, leading to a more accurate and stable SOC reading. This prevents the “false empty” reading common in cold weather and allows for optimal energy utilization and range prediction.
Furthermore, the model elegantly explains the observed capacity trends. The minimal rate dependence at high ambient temperature is because \( k(T) \approx 1 \) across the temperature range experienced during discharge. The complex rate dependence at low ambient temperature is directly modeled through the dynamic change in \( T(t) \). A low-rate discharge keeps the battery cold, maintaining a high \( k(T) \) and thus a low apparent capacity. A high-rate discharge quickly heats the lithium ion battery, causing \( k(T) \) to decrease over the discharge duration, which integrates to a higher total delivered capacity than the low-rate case. Our model quantitatively captures this cross-coupling effect.
In conclusion, we have developed a robust and practical framework for predicting the available capacity of a lithium ion battery under real-world, variable conditions. By enhancing the classical Peukert equation with a dynamically calculated temperature compensation coefficient derived from an Arrhenius-type relationship, the model successfully decouples the complex effects of discharge rate and thermal state. Experimental validation on a commercial LiFePO4 lithium ion battery across a wide temperature and rate spectrum confirms the model’s accuracy in normalizing capacity loss to a consistent effective capacity basis. This work provides a foundational tool for improving the performance and reliability of BMS algorithms, enabling more precise state estimation, better system design, and ultimately extending the usable range and lifespan of systems powered by lithium ion battery technology. Future work will focus on refining the model for extreme low-temperature behavior and incorporating the direct, non-thermal effects of very high current density on the compensation coefficient \( k \).