
The demand for efficient, safe, and long-lasting energy storage solutions has propelled LiFePO4 (Lithium Iron Phosphate) batteries to the forefront of various applications, from electric vehicles to grid storage. Their intrinsic advantages, including superior thermal stability, extended cycle life, and cost-effectiveness, have driven significant market adoption. Consequently, accurately predicting the long-term degradation and lifespan of LiFePO4 batteries under real-world operating conditions has become a critical engineering challenge. Traditional cycle life testing, which involves repeated charge-discharge sequences until a specified end-of-life criterion (commonly 80% of initial capacity) is met, can be prohibitively time-consuming and expensive, especially for high-quality LiFePO4 cells designed for thousands of cycles. This necessitates the development of robust accelerated testing methodologies that can reliably extrapolate long-term performance from shorter, high-stress tests.
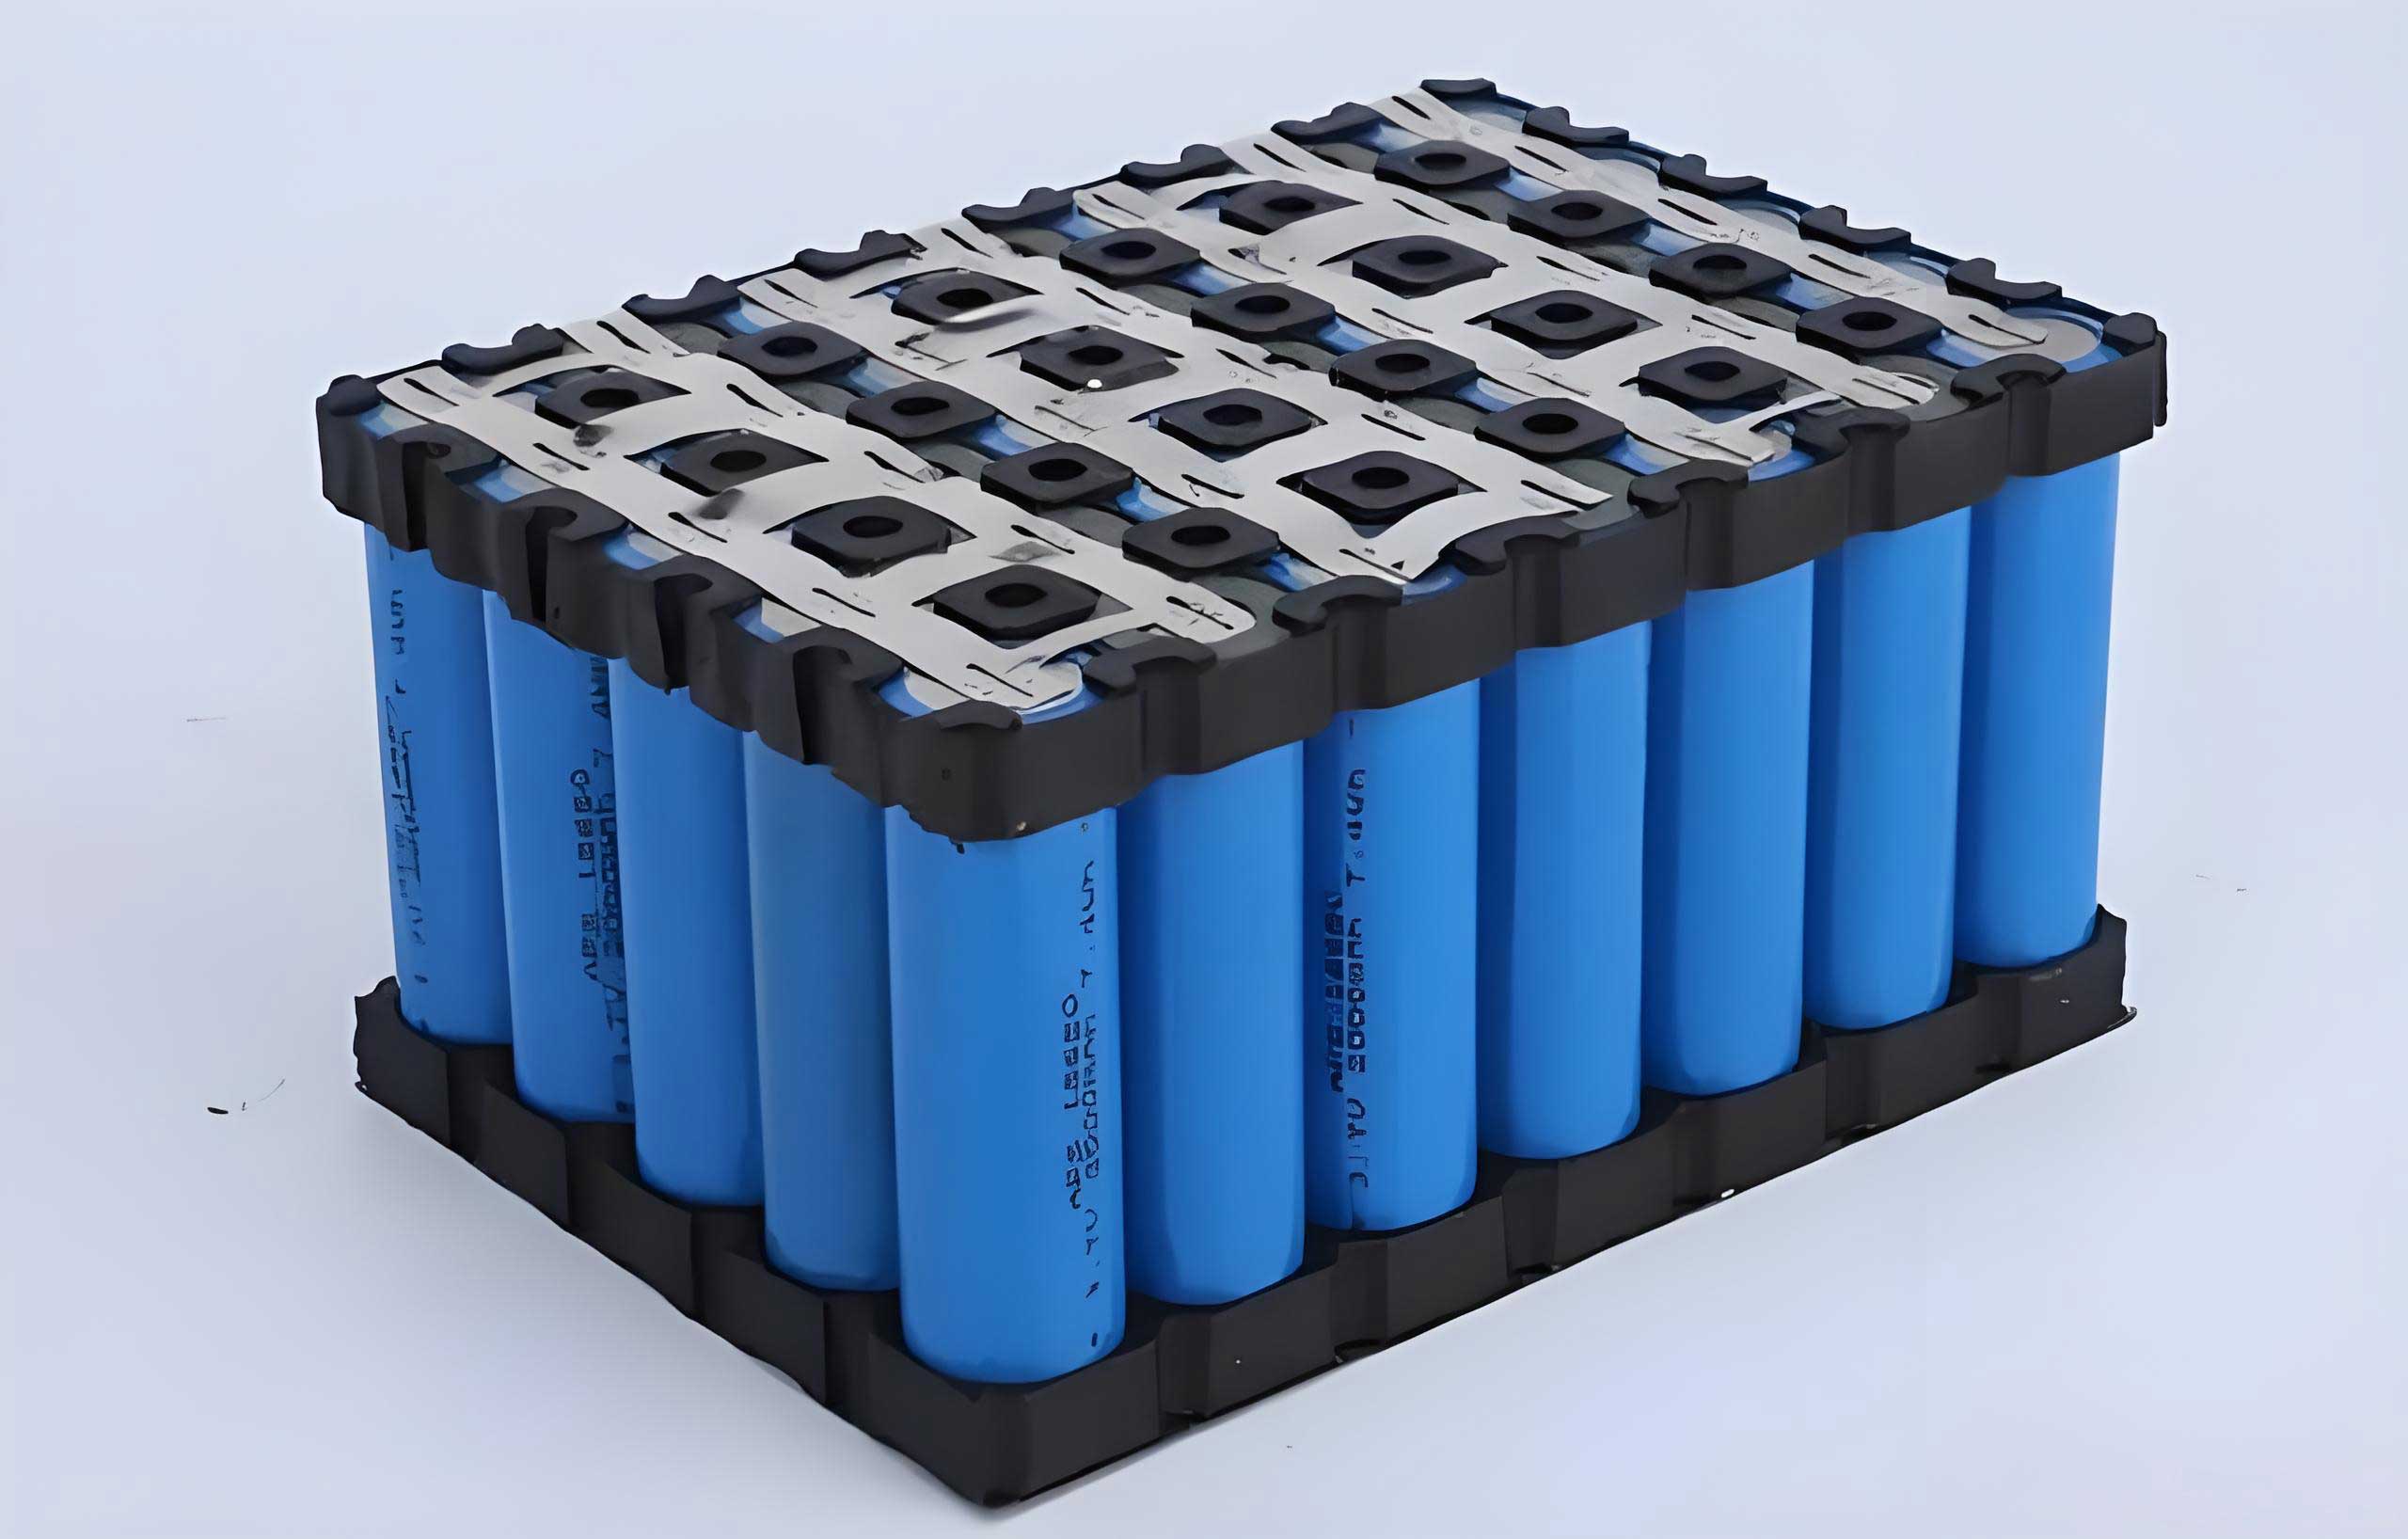
The core principle of accelerated life testing is to subject the test unit—in this case, a LiFePO4 battery—to stress levels that exceed normal operating conditions. Common accelerating stresses for LiFePO4 batteries include temperature, charge/discharge current rate (C-rate), Depth of Discharge (DOD), and state-of-charge (SOC) window. By carefully selecting and controlling these stresses, degradation mechanisms are expedited. The critical step is then to establish a mathematical model that quantifies the relationship between the accelerated stress level and the rate of degradation. This model allows for the prediction of performance under normal, lower-stress conditions. This article details a systematic approach for developing such a model, focusing on charge C-rate as the primary accelerating stress for cycle life testing of LiFePO4 batteries, leveraging machine learning techniques for data fitting and the inverse power law for life-stress relationship modeling.
Experimental Design and Data Acquisition for LiFePO4 Battery Degradation
To establish a foundational dataset for model development, a controlled cycle life test matrix was executed. The test object was a commercial prismatic LiFePO4 battery cell with a nominal capacity. The cell’s voltage limits were set at 3.65 V for charging and 2.20 V for discharging.
Fixed Parameters: To isolate the effect of the charge C-rate, several other influential factors were held constant. The ambient temperature for the primary test series was maintained at 25°C (a secondary series at 15°C was also conducted for comparative analysis). The discharge current was consistently set at 1.0 C. The charge termination protocol was constant-current constant-voltage (CC-CV) with a cutoff current of 0.05 C.
Accelerating Stress Variable: The charge current rate was selected as the accelerating stress. Three distinct levels were chosen: a relatively mild 0.5 C, a moderate 1.5 C, and a high 2.0 C rate. This range is designed to induce measurably different degradation rates while remaining within the manufacturer’s specified limits to avoid abusive conditions that trigger atypical failure modes.
Cycle Life Test Protocol: The test procedure for each stress level was as follows:
- Initial Capacity Reference: A standard capacity calibration test was performed to determine the cell’s initial capacity at the beginning of life (BoL).
- Accelerated Cycling Block: The cell underwent a block of 200 cycles following this sequence:
- Charge: CC-CV charge at the specified stress C-rate (0.5C, 1.5C, or 2.0C) to 3.65V, terminating when the current tapers to 0.05C.
- Rest: A 0.5-hour open-circuit rest period.
- Discharge: Constant current discharge at 1.0 C to the lower cutoff voltage of 2.20V.
- Rest: Another 0.5-hour rest period.
- Intermediate Capacity Check: After every 200-cycle block, a standard capacity calibration test was conducted to measure the remaining capacity. This test involved three consecutive 1.0C CC-CV charge / 1.0C CC discharge cycles at 25°C, with the discharge capacity from the third cycle taken as the reference capacity.
- Termination: Steps 2 and 3 were repeated until the cell’s reference capacity faded below 80% of its initial BoL capacity or until a predefined cycle count (e.g., 1000 cycles) was reached.
This protocol yielded six distinct degradation datasets: capacity retention (Q/Q0) versus cycle number (N) for three charge C-rates at 25°C and three at 15°C. A subset of this data is conceptually summarized in the table below, illustrating the typical trend of faster capacity fade with increasing charge C-rate.
| Cycle Count (N) | Capacity Retention @ 0.5C Charge (%) | Capacity Retention @ 1.5C Charge (%) | Capacity Retention @ 2.0C Charge (%) |
|---|---|---|---|
| 0 | 100.0 | 100.0 | 100.0 |
| 200 | ~96.5 | ~96.2 | ~95.8 |
| 400 | ~93.7 | ~92.9 | ~91.9 |
| 600 | ~91.0 | ~89.9 | ~88.1 |
| 800 | ~88.5 | ~87.0 | ~84.4 |
Data Fitting and Feature Extraction Using Lasso Regression
The raw data of capacity retention versus cycle number forms a non-linear trajectory. The first step in building a predictive model is to find a suitable mathematical function that accurately fits this trajectory for each stress condition. Polynomial functions are excellent candidates due to their flexibility. However, choosing the right polynomial order is crucial: an order too low leads to underfitting (poor accuracy), while an order too high leads to overfitting (the model captures noise rather than the true trend).
To objectively determine the optimal fit, we employ Lasso (Least Absolute Shrinkage and Selection Operator) regression, a supervised machine learning algorithm. Lasso regression enhances standard linear regression by incorporating an L1 regularization term. This term penalizes the absolute magnitude of the polynomial coefficients, effectively driving some of them toward zero. This process inherently performs feature selection and helps prevent overfitting, making it ideal for identifying the most parsimonious yet accurate model for our LiFePO4 battery degradation data.
The objective function \( J(\theta) \) minimized in Lasso regression is:
$$ J(\theta) = \frac{1}{2n_{\text{samples}}} \| X\theta – y \|_2^2 + \alpha \| \theta \|_1 $$
where:
- \( \theta \) is the vector of polynomial coefficients \( [\theta_n, \theta_{n-1}, …, \theta_0]^T \).
- \( n_{\text{samples}} \) is the number of data points.
- \( X \) is the matrix of input features (e.g., \( [N^3, N^2, N, 1] \) for a cubic model).
- \( y \) is the vector of observed capacity retention values.
- \( \alpha \) is the regularization hyperparameter controlling the strength of the penalty.
The first term, \( \frac{1}{2n} \| X\theta – y \|_2^2 \), is the ordinary least squares loss, ensuring the polynomial curve fits the data. The second term, \( \alpha \| \theta \|_1 \), is the L1 penalty which promotes sparsity in \( \theta \).
We applied Lasso regression to fit the 25°C, 1.5C dataset, splitting the data into a training set (80%) and a validation set (20%). We tested three candidate models: linear (1st order), quadratic (2nd order), and cubic (3rd order) polynomials. The quality of fit was evaluated using the coefficient of determination \( R^2 \) on the validation set.
| Polynomial Model | Optimal Coefficients (θ) | R² (Validation Set) |
|---|---|---|
| Cubic | θ₃ = -1.2e-8, θ₂ = 2.0e-5, θ₁ = -0.0223, θ₀ = 99.97 | 0.9702 |
| Quadratic | θ₂ = 6.1e-6, θ₁ = -0.0183, θ₀ = 99.87 | 0.9722 |
| Linear | θ₁ = -0.0135, θ₀ = 99.50 | 0.9657 |
The quadratic model achieved the highest \( R^2 \) on the validation set while maintaining a simple form. The cubic model’s slightly lower score suggests potential overfitting to the training noise. Therefore, a quadratic polynomial was selected as the universal form to model the capacity fade of the LiFePO4 battery under all test conditions:
$$ \hat{y}(N) = \theta_2 N^2 + \theta_1 N + \theta_0 $$
where \( \hat{y} \) is the predicted capacity retention (%). Applying Lasso regression with this constraint to all datasets yielded the following coefficients:
| Temperature | Charge C-rate (ν) | θ₂ | θ₁ | θ₀ |
|---|---|---|---|---|
| 25°C | 0.5 C | 5.8e-6 | -0.0163 | 99.91 |
| 1.5 C | 6.1e-6 | -0.0183 | 99.87 | |
| 2.0 C | 4.4e-6 | -0.0190 | 99.80 | |
| 15°C | 0.5 C | 5.0e-6 | -0.0163 | 99.77 |
| 1.5 C | 2.0e-6 | -0.0190 | 99.94 | |
| 2.0 C | -3.0e-6 | -0.0169 | 99.74 |
Constructing the Accelerated Life Model via the Inverse Power Law
Having obtained precise mathematical descriptions (the quadratic coefficients) for the degradation path at each accelerated stress level, the next step is to establish a relationship between these “lifetime characteristics” (the coefficients θ₂ and θ₁) and the magnitude of the applied stress (charge C-rate, ν). For stress factors like current, voltage, or pressure, the Inverse Power Law (IPL) model is widely used in reliability engineering. It posits that the product’s life is inversely proportional to a power of the stress:
$$ \xi = A \cdot \nu^{-c} $$
where \( \xi \) represents a life characteristic (e.g., time or cycles to failure, or in our case, a degradation coefficient), \( A \) is a constant, \( \nu \) is the stress level, and \( c \) is the stress exponent (a constant related to the activation energy of the failure mechanism). Taking the natural logarithm linearizes the model:
$$ \ln(\xi) = a + b \cdot \ln(\nu) $$
where \( a = \ln(A) \) and \( b = -c \).
In this methodology for the LiFePO4 battery, we treat the absolute values of the quadratic and linear coefficients from the Lasso fits as the life characteristics \( \xi \). Observing the coefficients in the table above, we see clear trends with ν. For the 25°C data, using the |θ₁| and |θ₂| values from the 0.5C and 2.0C tests as anchor points, we can solve for the parameters \( a \) and \( b \) in the log-linear IPL model for each coefficient.
For the linear coefficient characteristic (\( \xi_1 = |\theta_1| \)) at 25°C:
Using points (ν=0.5, ξ=0.0163) and (ν=2.0, ξ=0.0190):
$$ \ln(0.0163) = a_1 + b_1 \cdot \ln(0.5) $$
$$ \ln(0.0190) = a_1 + b_1 \cdot \ln(2.0) $$
Solving this system yields: \( b_1 \approx 0.1117 \), \( a_1 \approx -4.0383 \).
Thus: $$ \ln(|\theta_1|) = 0.1117 \cdot \ln(\nu) – 4.0383 $$ or $$ |\theta_1| = e^{-4.0383} \cdot \nu^{0.1117} $$
For the quadratic coefficient characteristic (\( \xi_2 = |\theta_2| \)) at 25°C:
Using points (ν=0.5, ξ=5.8e-6) and (ν=2.0, ξ=4.4e-6):
$$ \ln(5.8e-6) = a_2 + b_2 \cdot \ln(0.5) $$
$$ \ln(4.4e-6) = a_2 + b_2 \cdot \ln(2.0) $$
Solving gives: \( b_2 \approx -0.2007 \), \( a_2 \approx -12.1916 \).
Thus: $$ \ln(|\theta_2|) = -0.2007 \cdot \ln(\nu) – 12.1916 $$ or $$ |\theta_2| = e^{-12.1916} \cdot \nu^{-0.2007} $$
The constant term θ₀ is very close to 100 (initial capacity) for all tests and shows less systematic variation with ν. Therefore, it can be reasonably approximated as 100 for the predictive model. Consequently, the complete accelerated life model for a LiFePO4 battery at 25°C, predicting capacity retention \( \hat{y} \) at any cycle count \( N \) and for any charge rate \( \nu \) (within the characterized range), is synthesized as:
$$ \hat{y}(N, \nu) = \left( e^{-12.1916} \cdot \nu^{-0.2007} \right) N^2 – \left( e^{-4.0383} \cdot \nu^{\,0.1117} \right) N + 100 $$
Following an identical process for the 15°C data, a separate accelerated model is obtained:
$$ \hat{y}(N, \nu)_{15^\circ C} = \left( e^{-12.4863} \cdot \nu^{-0.4165} \right) N^2 – \left( e^{-4.1011} \cdot \nu^{\,0.0260} \right) N + 100 $$
Model Validation and Predictive Performance
The true test of the accelerated life model for the LiFePO4 battery is its ability to accurately predict degradation under a stress condition that was not used to derive the model’s parameters. For the 25°C series, the 1.5C charge data was reserved for this purpose. The graph below conceptually compares the actual measured capacity fade (scatter points) with the model’s predictions (solid line) generated by plugging \( \nu = 1.5 \) into the derived 25°C model equation.
The predictive accuracy can be quantified by comparing specific data points. The table below shows the model’s performance at key cycle intervals for the 25°C, 1.5C case.
| Cycle Count (N) | Measured Capacity Retention (%) | Predicted Capacity Retention (%) | Relative Error (%) |
|---|---|---|---|
| 200 | 96.18 | 96.50 | 0.33 |
| 400 | 93.68 | 93.37 | 0.33 |
| 600 | 91.31 | 90.62 | 0.76 |
| 800 | 88.95 | 88.24 | 0.80 |
| 1000 | 86.81 | 86.23 | 0.67 |
The model demonstrates excellent agreement with the experimental data, with relative errors consistently below 1% across the entire 1000-cycle span for the LiFePO4 battery. This validates the core premise: the degradation path at any charge rate within the tested range can be reliably constructed using only the parameters derived from tests at two other charge rates.
The model for the LiFePO4 battery at 15°C also shows strong predictive capability for the 1.5C data, with errors generally below 2% up to 800 cycles, affirming the robustness of the methodological framework across different operating temperatures.
Discussion and Implications
The presented methodology integrates controlled physical testing, statistical machine learning for pattern recognition, and established reliability theory to create a powerful tool for LiFePO4 battery life prediction. The use of Lasso regression provides an objective, data-driven way to select the optimal degradation curve form, mitigating analyst bias. The interpretation of polynomial coefficients as life characteristics linked to stress via the Inverse Power Law is a novel and effective approach for constructing the accelerated model.
This framework has significant practical implications. For battery developers and quality assurance teams, it enables rapid assessment of cycle life. Instead of running a multi-year test at a 0.5C charge rate, tests at higher rates (e.g., 1.5C and 2.0C) can be conducted in a fraction of the time. The data from these accelerated tests are then fed into the model to predict the long-term fade curve under the desired usage condition. This drastically reduces time-to-market and R&D costs for new LiFePO4 battery formulations or designs.
Furthermore, the model’s structure offers insights into degradation physics. The sign and magnitude of the stress exponent \( b \) in the IPL relationship for θ₁ and θ₂ may correlate with dominant aging mechanisms. For instance, a stronger negative exponent for |θ₂| at lower temperatures (as seen in the 15°C model: \( b_2 = -0.4165 \)) might indicate a heightened sensitivity of a particular degradation mode (e.g., lithium plating or SEI growth kinetics) to current stress under cooler conditions.
The natural extension of this work is to incorporate temperature as a concurrent accelerating stress, potentially leading to a more generalized model based on the Arrhenius law and the Inverse Power Law (a combined stress model). This would allow for the prediction of LiFePO4 battery life across a wide range of real-world usage profiles involving varying temperatures and charge/discharge rates.
Conclusion
This article detailed a comprehensive and validated methodology for performing accelerated cycle life testing and modeling for LiFePO4 batteries. By employing charge C-rate as a controlled accelerating stress and acquiring precise degradation data, we demonstrated the application of Lasso regression to objectively determine that a quadratic polynomial optimally fits the capacity fade trajectory. The coefficients of this polynomial were then successfully treated as lifetime characteristics and linked to the applied stress through the Inverse Power Law model. The resulting accelerated life model for the LiFePO4 battery exhibited high predictive accuracy when validated against independent test data, with errors typically below 1%. This structured approach, combining experimental design, machine learning-based data fitting, and reliability engineering principles, provides a powerful, time-efficient, and cost-effective framework for evaluating and predicting the long-term cycling performance of LiFePO4 batteries, offering substantial value for research, development, and quality validation in the energy storage industry.