
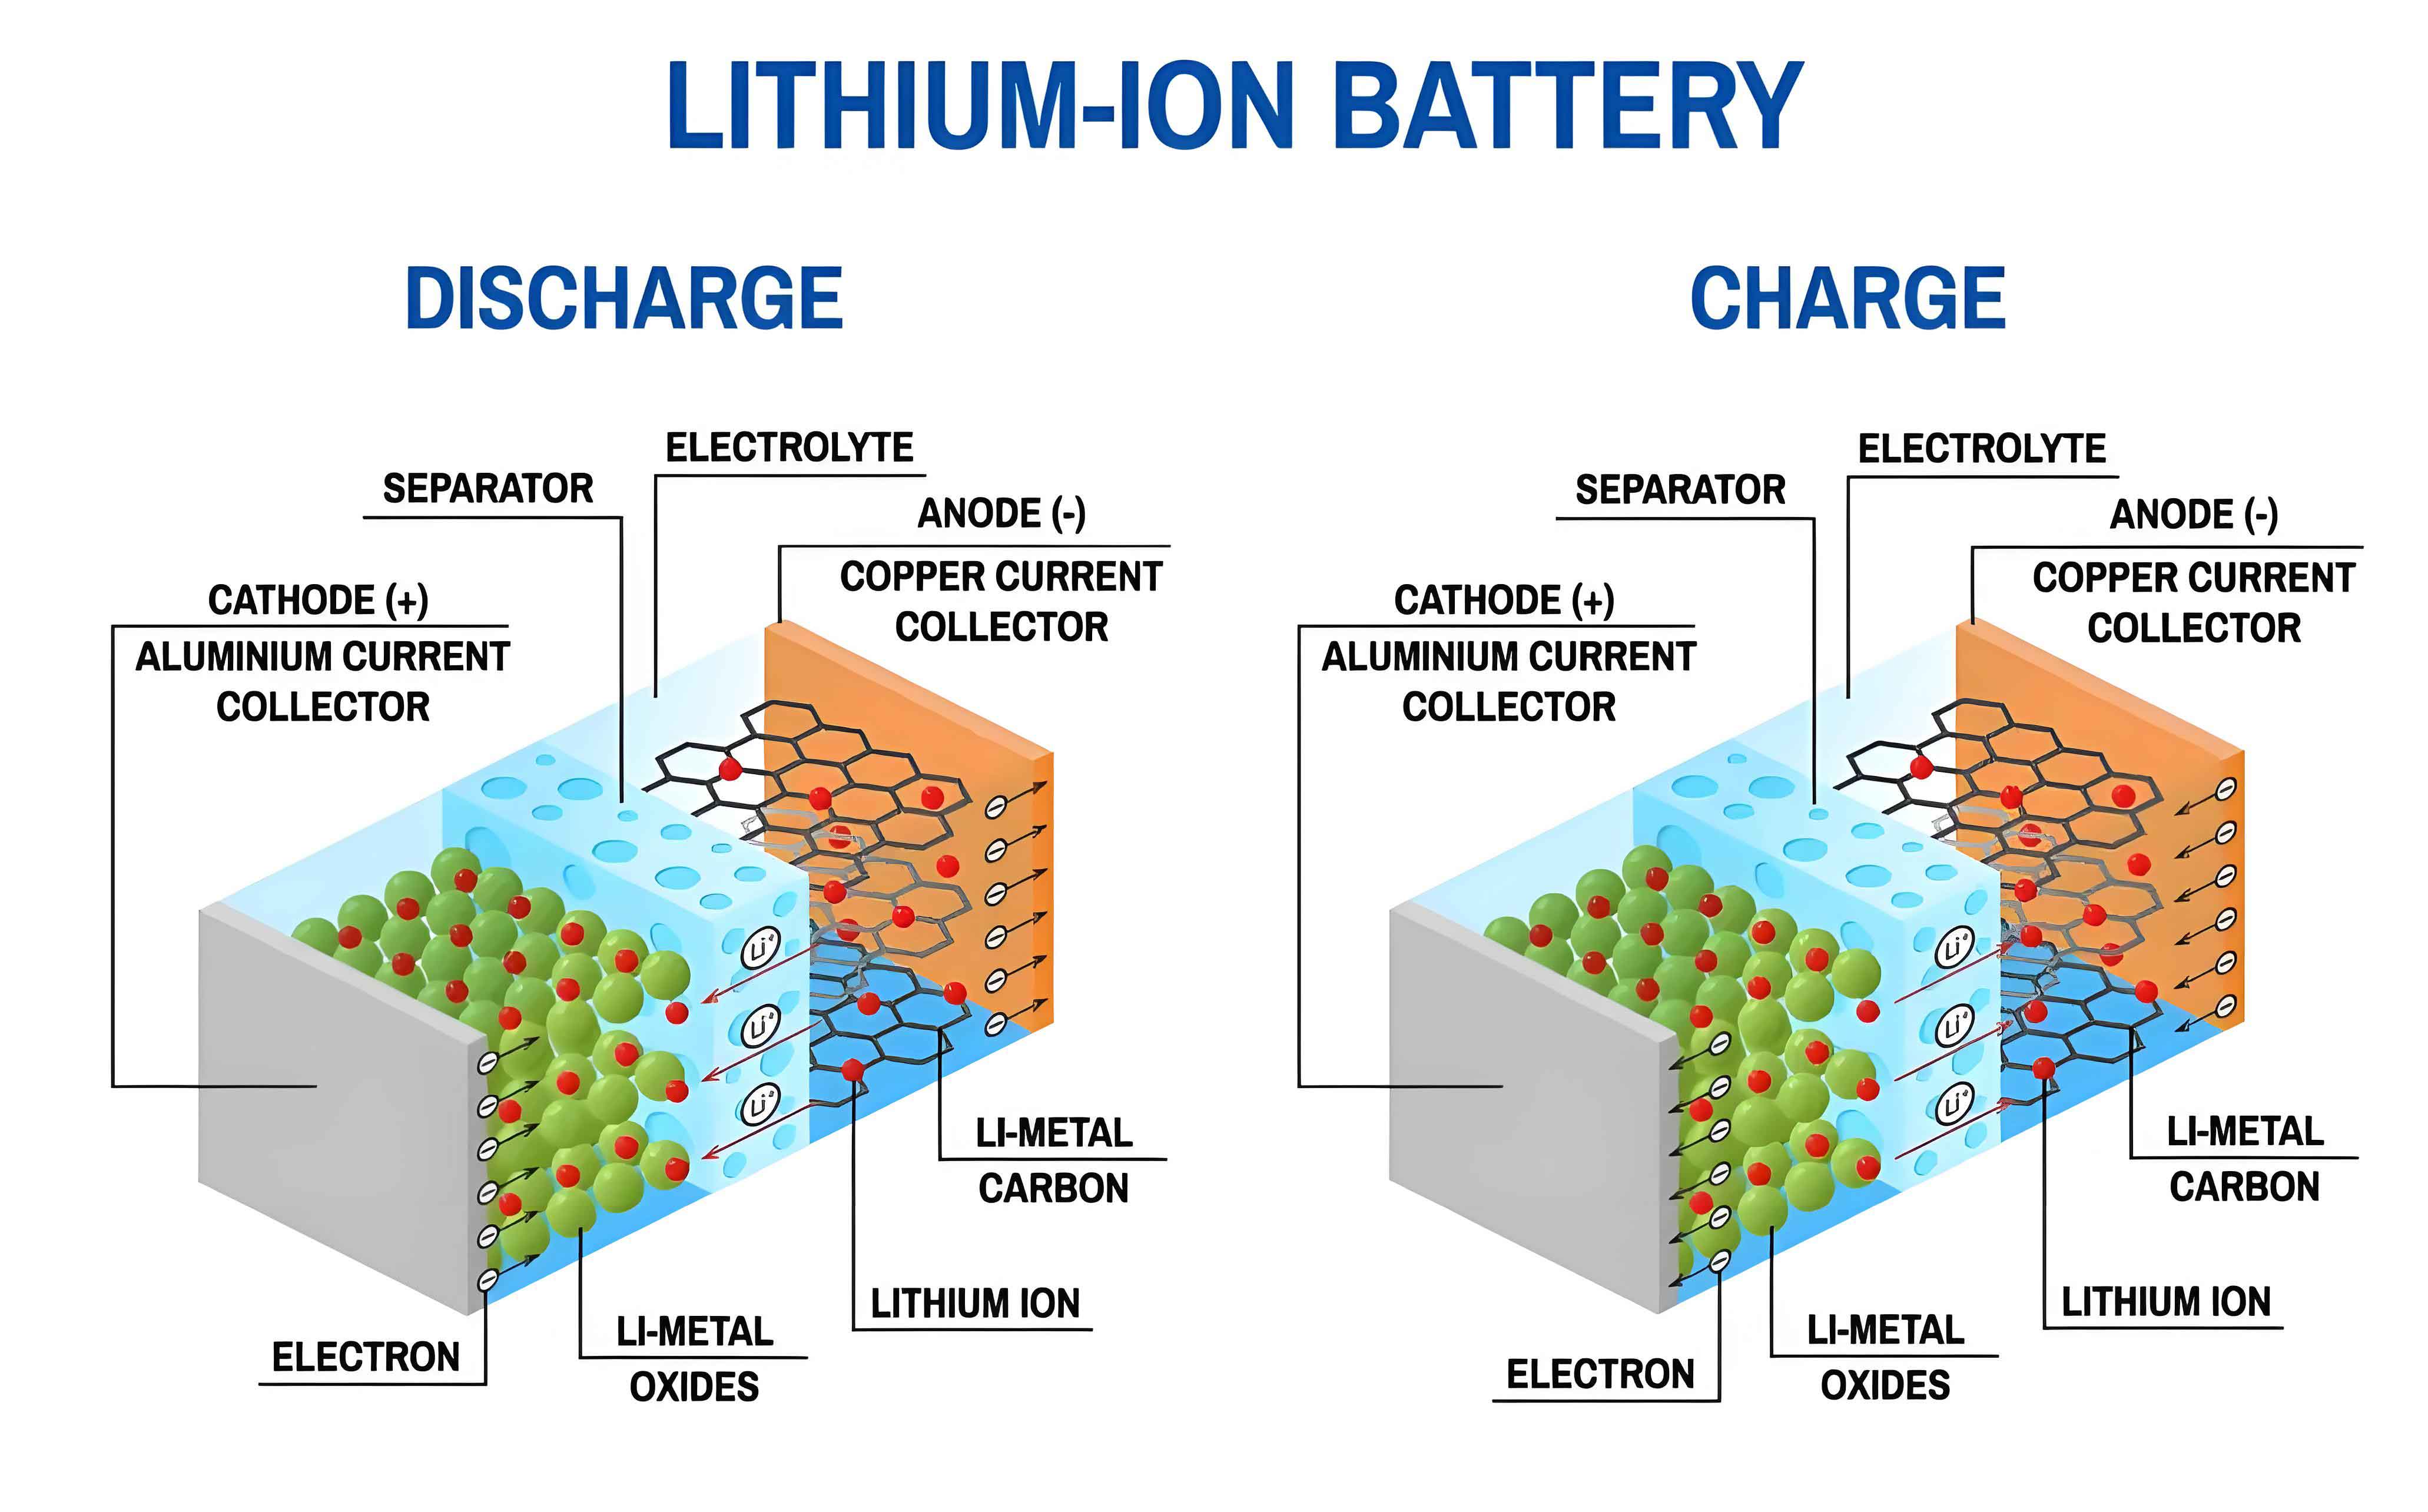
Accurately predicting the remaining useful life (RUL) of lithium-ion batteries is of paramount importance for enhancing the safety and reliability of energy storage systems, electric vehicles, and various electronic devices. As one of the most prominent energy storage solutions, the lithium ion battery is favored for its high energy density and long cycle life. However, its performance inevitably degrades over time due to complex internal electrochemical reactions, leading to capacity fade and increased internal resistance. Failure to predict this degradation can result in system failures and safety hazards. Therefore, developing precise and robust RUL prediction models is a critical research focus.
Traditional model-based prediction methods, which rely on electrochemical or equivalent circuit models, often struggle with complexity, non-linearity, and dependency on extensive prior knowledge. In contrast, data-driven approaches have gained significant traction as they circumvent the need for detailed physical models by learning directly from operational data. Among these, Long Short-Term Memory (LSTM) neural networks have demonstrated exceptional capability in capturing temporal dependencies in time-series data, such as capacity degradation trajectories, making them well-suited for RUL forecasting. However, the predictive performance of an LSTM model is highly sensitive to its hyperparameters (e.g., number of hidden units, learning rate). Manually tuning these parameters is inefficient and often leads to suboptimal models.
To address this challenge, metaheuristic optimization algorithms can be employed for automatic parameter search. The Sparrow Search Algorithm (SSA) is a relatively new swarm intelligence optimizer known for its strong search capability and fast convergence. Nonetheless, like many population-based algorithms, the standard SSA can suffer from uneven initial population distribution and a tendency to converge to local optima, limiting its effectiveness in complex optimization tasks like tuning LSTM networks for lithium ion battery RUL prediction.
In this work, we propose a novel hybrid prediction model that integrates an Improved Sparrow Search Algorithm (ISSA) with an LSTM network. The primary contributions are threefold: First, we apply data preprocessing techniques, including averaging, to handle anomalies and noise in raw battery capacity data. Second, we introduce several enhancements to the standard SSA: Tent chaotic mapping for population initialization, an adaptive weight factor for the discoverer’s position update, and a dynamic selection mechanism between opposition-based learning and Cauchy mutation strategies to update the optimal solution. These improvements collectively enhance the algorithm’s global exploration and local exploitation capabilities, preventing premature convergence. Third, we utilize this robust hybrid ISSA algorithm to automatically identify the optimal hyperparameters for the LSTM network. The resulting hybrid ISSA-LSTM model is then applied to predict the RUL of lithium ion battery. Experimental validation on NASA’s public battery aging dataset confirms that our proposed model achieves superior prediction accuracy and stability compared to baseline methods.
1 Methodology
1.1 The Improved Sparrow Search Algorithm (ISSA)
The standard SSA simulates the foraging and anti-predation behaviors of sparrows. The population is categorized into discoverers, followers, and vigilantes. While effective, its performance can be limited. Our improvements target key phases of the algorithm.
1.1.1 Population Initialization using Tent Chaotic Map
To ensure a more uniform and diverse initial population, enhancing global search potential, we replace random initialization with a Tent chaotic sequence. The Tent map is defined as:
$$
X_{i+1} = \begin{cases}
\frac{X_i}{\gamma}, & \text{if } X_i \in (0, \gamma] \\
\frac{1 – X_i}{1 – \gamma}, & \text{if } X_i \in (\gamma, 1)
\end{cases}
$$
where $X_i$ is the chaotic value at iteration $i$, and $\gamma$ is a coefficient within (0,1). This generates a chaotic sequence used to initialize the positions of the sparrows.
1.1.2 Discoverer Position Update with Adaptive Weight
In the standard SSA, discoverers guide the search. To improve convergence and avoid local optima, we modify the discoverer’s position update formula by incorporating the previous global best solution and a non-linearly decreasing adaptive weight $\omega$. The new update rule is:
$$
x_{i,j}^{t+1} = \begin{cases}
x_{i,j}^{t} + \omega \cdot (f_{j,g}^{t} – x_{i,j}^{t}) \cdot k, & \text{if } R_2 < ST \\
x_{i,j}^{t} + Q, & \text{if } R_2 \geq ST
\end{cases}
$$
where $x_{i,j}^{t}$ is the position of the $i$-th sparrow in dimension $j$ at iteration $t$, $f_{j,g}^{t}$ is the $j$-th dimension of the global best position, $k$ is a random number in [0,1], $R_2$ is an alarm value, $ST$ is a safety threshold, and $Q$ is a random number. The adaptive weight $\omega$ is calculated as:
$$
\omega = \tanh\left(2 – \frac{2t}{T_{\max}}\right)
$$
where $t$ is the current iteration and $T_{\max}$ is the maximum number of iterations. This weight starts high for global exploration and decreases to facilitate local refinement.
1.1.3 Enhanced Optimal Solution Update via Dynamic Strategy Selection
To help the algorithm escape local optima, we dynamically apply either an opposition-based learning (OBL) strategy or a Cauchy mutation strategy to perturb the current global best solution. A dynamic selection probability $P_y$ governs the choice:
$$
P_y = \exp\left(-\frac{20t}{T_{\max}}\right) + \eta
$$
where $\eta$ is a small constant (e.g., 0.05). If a random number $rand < P_y$, the OBL strategy is used to generate a candidate solution $x’_{b}(t)$:
$$
x’_{b}(t) = u_{lb} + u_{ub} \oplus \mathbf{r} – x_{b}(t)
$$
where $x_{b}(t)$ is the current best solution, $u_{ub}$ and $u_{lb}$ are the upper and lower bounds, $\mathbf{r}$ is a random vector, and $\oplus$ denotes element-wise multiplication. Otherwise, the Cauchy mutation strategy is applied:
$$
x’_{b}(t) = x_{b}(t) + x_{b}(t) \oplus \text{Cauchy}(0,1)
$$
After generating the candidate solution $x’_{b}(t)$, a greedy selection is performed to decide whether to update the global best:
$$
x_{b}(t+1) = \begin{cases}
x’_{b}(t), & \text{if } f(x’_{b}(t)) < f(x_{b}(t)) \\
x_{b}(t), & \text{otherwise}
\end{cases}
$$
where $f(\cdot)$ is the fitness function.
1.2 Long Short-Term Memory (LSTM) Network
LSTM networks are a specialized form of Recurrent Neural Networks (RNNs) designed to model long-term dependencies in sequential data. They address the vanishing/exploding gradient problem of standard RNNs through a gated cell structure. Each LSTM cell contains an input gate ($i_t$), a forget gate ($f_t$), an output gate ($o_t$), and a cell state ($C_t$). The forward propagation at time step $t$ is governed by:
$$
\begin{aligned}
f_t &= \sigma(W_f \cdot [h_{t-1}, x_t] + b_f) \\
i_t &= \sigma(W_i \cdot [h_{t-1}, x_t] + b_i) \\
\tilde{C}_t &= \tanh(W_C \cdot [h_{t-1}, x_t] + b_C) \\
C_t &= f_t \odot C_{t-1} + i_t \odot \tilde{C}_t \\
o_t &= \sigma(W_o \cdot [h_{t-1}, x_t] + b_o) \\
h_t &= o_t \odot \tanh(C_t)
\end{aligned}
$$
where $x_t$ is the input, $h_{t-1}$ is the previous hidden state, $\sigma$ is the sigmoid function, $\tanh$ is the hyperbolic tangent function, $\odot$ denotes the Hadamard product, $W$ denotes weight matrices, and $b$ denotes bias vectors. This structure allows the LSTM to effectively learn and remember long-range patterns in the capacity degradation sequence of a lithium ion battery.
1.3 The Hybrid ISSA-LSTM Prediction Framework
The overall framework for lithium ion battery RUL prediction using the hybrid ISSA-LSTM model consists of the following key steps:
Step 1: Data Preprocessing. The raw capacity data from charge-discharge cycles is processed. Anomalous capacity points (e.g., sudden increases due to measurement noise or internal relaxation) are smoothed using a local averaging method. For an outlier at cycle $i$, its value $z_i$ is replaced by:
$$
z_i = \frac{\sum_{k=i-10}^{i-1} z_k + \sum_{k=i+1}^{i+10} z_k}{20}
$$
Subsequently, the capacity data is normalized to facilitate stable and efficient network training.
Step 2: ISSA Parameter Initialization. Initialize ISSA parameters: population size $N$, maximum iterations $T_{\max}$, proportion of discoverers $PDR$, safety value $ST$, alarm value $R_2$, and the adjustment parameter $\eta$. The initial population is generated using the Tent chaotic map.
Step 3: LSTM Parameter Optimization via ISSA. The ISSA is used to search for the optimal set of LSTM hyperparameters. Each sparrow’s position vector represents a candidate configuration: e.g., the number of neurons in the first hidden layer $L_1 \in [1, 100]$, the number of neurons in the second hidden layer $L_2 \in [1, 100]$, the number of training epochs $K \in [1, 50]$, and the learning rate $l_r \in [0.001, 0.01]$. The fitness function for ISSA is defined as the root mean square error (RMSE) of the LSTM model’s predictions on a validation set. The ISSA iteratively updates the sparrow positions using the improved rules described in Sections 1.1.2 and 1.1.3 to minimize this fitness value.
Step 4: RUL Prediction with Optimized LSTM. Once the termination criteria (e.g., maximum iterations) of ISSA are met, the best position vector (hyperparameters) is retrieved. An LSTM network is constructed with these optimal parameters and trained on the full training dataset. Finally, the trained model is used to predict the future capacity values and determine the RUL. The RUL is defined as the number of cycles remaining until the battery’s capacity degrades to a predefined failure threshold (typically 70-80% of its nominal capacity).
2 Experimental Design and Results
2.1 Dataset and Experimental Setup
The proposed model is validated using the NASA Ames Prognostics Center of Excellence (PCoE) publicly available lithium ion battery aging dataset. We select batteries B0005, B0006, B0007, and B0018 for experimentation. These 18650-sized batteries have a nominal capacity of 2 Ah and were cycled under constant current-constant voltage (CC-CV) charge and constant current (CC) discharge profiles at room temperature. The failure threshold is set at 1.4 Ah (70% of nominal capacity). The capacity versus cycle data for the four batteries shows non-monotonic degradation with occasional regeneration effects, which is a typical characteristic of lithium ion battery aging.
The data from each battery is split into a training set and a testing set. Two common scenarios are evaluated: using the first 50% of cycles for training and the last 50% for testing (earlier prediction), and using the first 60% for training and the last 40% for testing (later prediction, more data).
2.2 Performance Metrics
The prediction performance is evaluated using three standard metrics:
- Mean Absolute Error (MAE): $$E_{\text{MAE}} = \frac{1}{n}\sum_{i=1}^{n} |s(i) – \hat{s}(i)|$$
- Root Mean Square Error (RMSE): $$E_{\text{RMSE}} = \sqrt{\frac{1}{n}\sum_{i=1}^{n} (s(i) – \hat{s}(i))^2}$$
- Mean Absolute Percentage Error (MAPE): $$E_{\text{MAPE}} = \frac{1}{n}\sum_{i=1}^{n} \left| \frac{s(i) – \hat{s}(i)}{s(i)} \right| \times 100\%$$
where $s(i)$ is the true capacity, $\hat{s}(i)$ is the predicted capacity, and $n$ is the number of predicted points. Lower values of these metrics indicate higher prediction accuracy.
2.3 Results and Comparative Analysis
The proposed hybrid ISSA-LSTM model is compared against three baseline models: the standard LSTM with empirical parameters, the PSO-optimized LSTM (PSO-LSTM), and the standard SSA-optimized LSTM (SSA-LSTM). The hyperparameters found by ISSA for the LSTM model on the validation set are presented below:
| Parameter | $L_1$ | $L_2$ | $K$ | $l_r$ |
|---|---|---|---|---|
| Optimal Value | 63 | 67 | 41 | 0.0055 |
The RUL prediction results for all four batteries under the two training/testing split scenarios are summarized in the following table. It comprehensively lists the MAE, RMSE, and MAPE for each model.
| Battery | Train/Test Split | Model | MAE ($E_{\text{MAE}}$) | RMSE ($E_{\text{RMSE}}$) | MAPE ($E_{\text{MAPE}}$) % |
|---|---|---|---|---|---|
| B0005 | 50/50 | LSTM | 0.10771 | 0.15625 | 8.0168 |
| PSO-LSTM | 0.13489 | 0.14413 | 9.7400 | ||
| SSA-LSTM | 0.01759 | 0.02239 | 1.3404 | ||
| ISSA-LSTM | 0.01259 | 0.01757 | 0.96874 | ||
| 60/40 | LSTM | 0.10681 | 0.14595 | 7.8997 | |
| PSO-LSTM | 0.12804 | 0.19719 | 9.6207 | ||
| SSA-LSTM | 0.01346 | 0.01652 | 0.96344 | ||
| ISSA-LSTM | 0.00893 | 0.01189 | 0.59247 | ||
| B0006 | 50/50 | LSTM | 0.03317 | 0.03778 | 2.3602 |
| PSO-LSTM | 0.08642 | 0.12075 | 6.9683 | ||
| SSA-LSTM | 0.02714 | 0.03434 | 2.09685 | ||
| ISSA-LSTM | 0.01845 | 0.02339 | 1.29600 | ||
| 60/40 | LSTM | 0.07295 | 0.08301 | 5.8075 | |
| PSO-LSTM | 0.08523 | 0.09361 | 6.7532 | ||
| SSA-LSTM | 0.01934 | 0.02365 | 1.4769 | ||
| ISSA-LSTM | 0.01351 | 0.01901 | 1.00950 | ||
| B0007 | 50/50 | LSTM | 0.05393 | 0.06434 | 3.6889 |
| PSO-LSTM | 0.16948 | 0.20283 | 11.6284 | ||
| SSA-LSTM | 0.01288 | 0.01581 | 0.94796 | ||
| ISSA-LSTM | 0.01117 | 0.01360 | 0.74797 | ||
| 60/40 | LSTM | 0.03153 | 0.03552 | 2.1450 | |
| PSO-LSTM | 0.05338 | 0.06415 | 3.6885 | ||
| SSA-LSTM | 0.01198 | 0.01955 | 0.80923 | ||
| ISSA-LSTM | 0.00989 | 0.01324 | 0.66375 | ||
| B0018 | 50/50 | LSTM | 0.04651 | 0.05579 | 3.2782 |
| PSO-LSTM | 0.04805 | 0.05321 | 3.4474 | ||
| SSA-LSTM | 0.02032 | 0.02550 | 1.4371 | ||
| ISSA-LSTM | 0.01905 | 0.02484 | 1.34750 | ||
| 60/40 | LSTM | 0.06961 | 0.07509 | 5.0184 | |
| PSO-LSTM | 0.03742 | 0.06298 | 2.6618 | ||
| SSA-LSTM | 0.02229 | 0.03025 | 1.5884 | ||
| ISSA-LSTM | 0.01647 | 0.02284 | 1.20480 |
Analysis of Results:
- Superior Performance of ISSA-LSTM: Across all batteries and both data split scenarios, the proposed hybrid ISSA-LSTM model consistently achieves the lowest values for MAE, RMSE, and MAPE. This demonstrates its superior accuracy and robustness in predicting the RUL of lithium ion battery. For instance, with the 60/40 split, the model’s errors are controlled within 0.01647, 0.02284, and 1.2048%, with the best-case results as low as 0.00893, 0.01189, and 0.59247% (B0005).
- Effectiveness of ISSA Improvements: The ISSA-LSTM model significantly outperforms the standard SSA-LSTM model. This performance gap validates the effectiveness of the introduced enhancements (Tent mapping, adaptive weight, dynamic strategy selection) in improving the optimization algorithm’s search capability, leading to better LSTM hyperparameters.
- Impact of Training Data Size: As expected, prediction errors generally decrease when more data (60% vs. 50%) is available for training. However, the ISSA-LSTM model shows relatively smaller error increments when training data is reduced, indicating better generalization ability and stability compared to the other models.
- Comparison with Other Optimizers: The PSO-LSTM model shows unstable performance, sometimes yielding very high errors (e.g., for B0007), highlighting PSO’s susceptibility to local optima in this high-dimensional parameter space. The standard LSTM model with fixed parameters performs poorly, emphasizing the necessity of automated hyperparameter tuning for reliable lithium ion battery RUL prediction.
3 Conclusion
This paper presents a novel hybrid data-driven model for accurately predicting the remaining useful life of lithium ion battery. The core innovation lies in the integration of a substantially improved Sparrow Search Algorithm with a Long Short-Term Memory neural network. The ISSA incorporates Tent chaotic mapping for population initialization, an adaptive weight factor for balanced exploration-exploitation, and a dynamic mechanism combining opposition-based learning and Cauchy mutation to escape local optima. This robust optimizer is then employed to automatically find the optimal hyperparameters for the LSTM network, which excels at modeling the temporal degradation patterns of battery capacity.
The model was rigorously validated using the NASA lithium ion battery dataset. Experimental results demonstrate that the proposed hybrid ISSA-LSTM model achieves significantly higher prediction accuracy and greater stability compared to the standard LSTM, PSO-LSTM, and SSA-LSTM models under different prediction starting points. The prediction errors (MAE, RMSE, MAPE) are consistently the lowest, proving its effectiveness and generalization capability. This work provides a reliable and advanced tool for battery health management, which is crucial for ensuring the safety and optimizing the maintenance of systems powered by lithium ion battery. Future work may involve integrating more health indicators (e.g., internal resistance, temperature) and adapting the model for online, real-time RUL prediction.