
The widespread adoption of solar energy as a clean and renewable source is a cornerstone of the global transition towards sustainable power generation. At the heart of this transition are vast arrays of solar panels, converting sunlight directly into electricity. However, the efficient operation, maintenance, and optimization of these photovoltaic (PV) systems rely heavily on the continuous and reliable monitoring of their performance parameters. Traditional data acquisition methods, often reliant on complex wired networks, present significant challenges. These include high installation costs due to extensive cabling, vulnerability to environmental damage, difficulty in expanding or reconfiguring the system, and increased points of failure. To overcome these limitations, this article details the design and implementation of a novel, Internet of Things (IoT)-based wireless data acquisition and monitoring system specifically for solar panels. This system aims to provide a scalable, cost-effective, and robust solution for real-time performance tracking and intelligent analysis of photovoltaic installations.
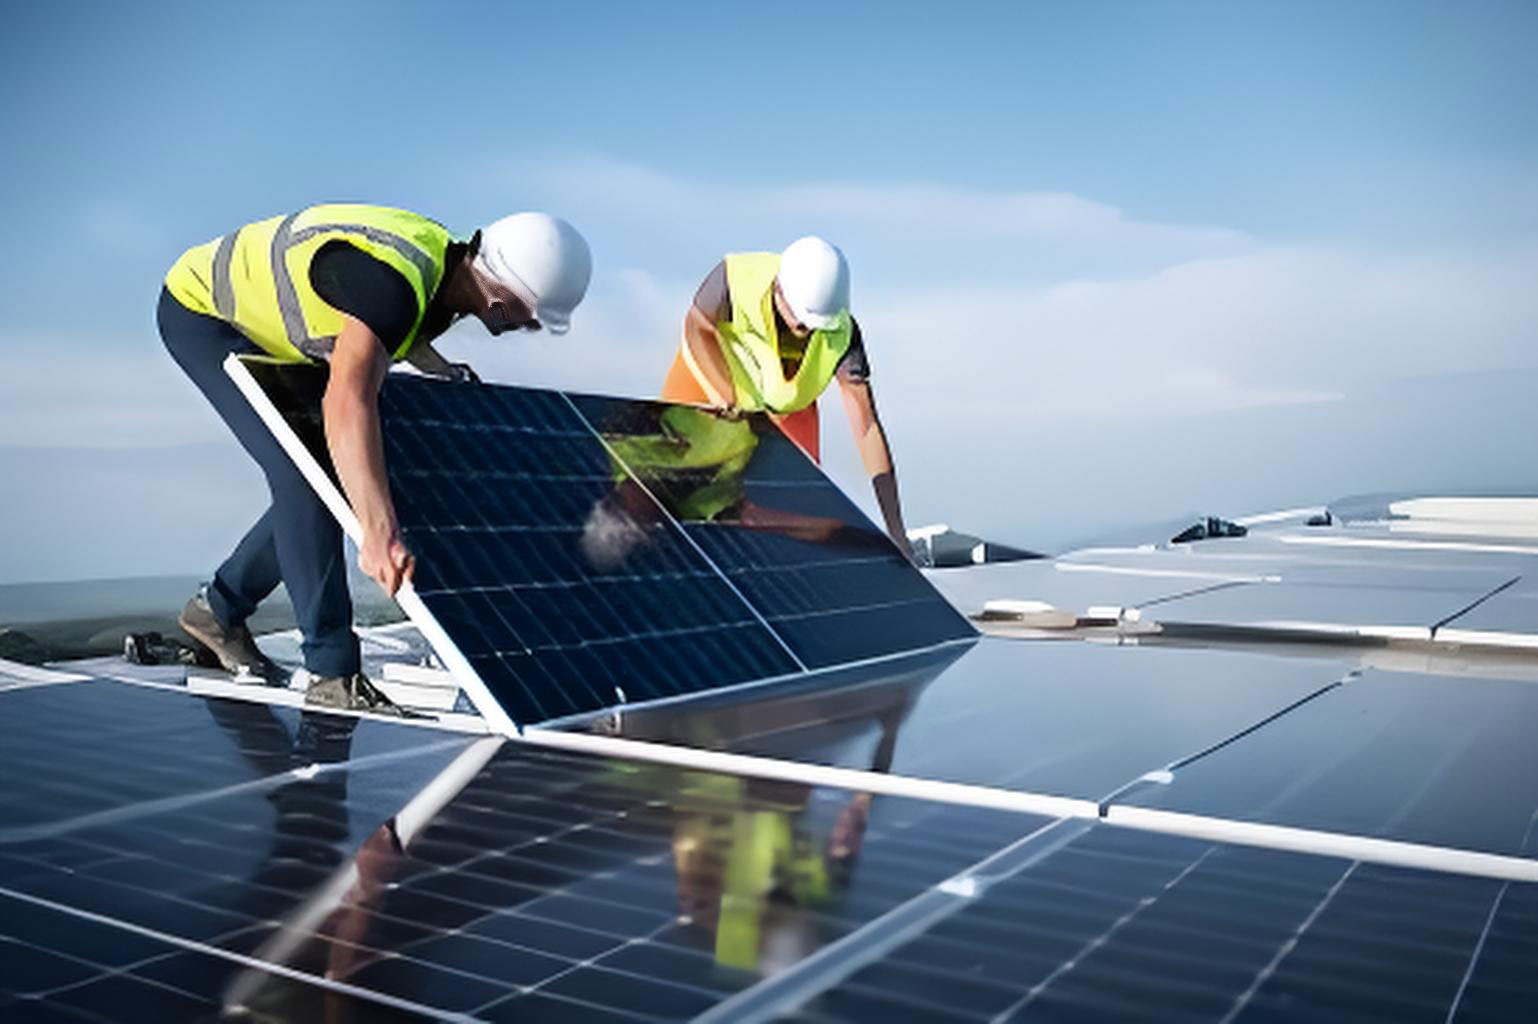
The proposed system architecture is fundamentally decentralized and wireless, eliminating the need for costly and inflexible wired connections between individual solar panels or combiner boxes and a central control room. The core philosophy is to deploy intelligent data acquisition nodes at strategic points within the PV plant—such as at combiner boxes that aggregate the output of multiple solar panel strings. These nodes are responsible for locally measuring critical electrical parameters, processing the data, and then transmitting it wirelessly to a central gateway or directly to a cloud-based platform. This approach not only simplifies deployment, especially in large-scale or topographically challenging solar farms, but also enhances system resilience and scalability.
System Architecture and Hardware Design
The overall hardware architecture is modular, consisting of three primary units: the Data Acquisition Module, the IoT Communication Module, and the Power Supply Module. This modularity ensures flexibility, ease of maintenance, and the ability to tailor the system to different scales of PV installations, from small rooftop arrays to utility-scale solar panels farms.
1. Data Acquisition Module
This module is the sensory front-end of the system. Its primary function is to accurately measure the voltage and current output from strings of solar panels. A typical configuration involves monitoring multiple channels (e.g., 16 current channels and a common voltage bus) from a combiner box.
- Core Controller: An ARM Cortex-M3 based microcontroller (e.g., STM32F103 series) serves as the local brain. It manages analog-to-digital conversion, initial data processing, and communication protocol handling. Its low-power capabilities are crucial for energy-efficient operation.
- Sensing Circuitry: High-precision Hall-effect current sensors are used for galvanic isolation and accurate current measurement. Voltage is measured through high-impedance resistive dividers for safety. The analog signals from these sensors are conditioned using operational amplifier circuits (e.g., based on LM324) to scale them to the appropriate voltage range (0-3.3V) for the microcontroller’s Analog-to-Digital Converter (ADC).
- Local Indication: The module often includes basic LED indicators or a small digital display for immediate, on-site status verification.
The instantaneous power for a single channel i is calculated by the microcontroller using the formula:
$$P_i = V_i \times I_i$$
where \(V_i\) is the string voltage and \(I_i\) is the string current. The total power for the combiner box is the sum of all channel powers:
$$P_{total} = \sum_{i=1}^{N} (V_i \times I_i)$$
where \(N\) is the number of monitored channels.
2. IoT Communication Module
This module is responsible for creating the wireless link between the data acquisition nodes and the central monitoring system. The choice of technology is critical for range, reliability, and power consumption.
- Wireless Technology: A low-power Wi-Fi module (e.g., ESP32) is employed. In large fields of solar panels, a Wireless Distribution System (WDS) using robust outdoor Wi-Fi access points or bridges can be deployed to create a mesh network, ensuring complete coverage.
- Communication Protocol: The system utilizes lightweight IoT protocols like MQTT (Message Queuing Telemetry Transport). In this publish-subscribe model, each data acquisition node acts as a publisher, sending its data to a central broker (server). Monitoring clients (like a central dashboard) subscribe to this data. This decoupled architecture is highly scalable and efficient.
- Data Packaging: The microcontroller packages the measured voltage, current, calculated power, and potentially module temperature into a concise data frame (often JSON format) and transmits it via the Wi-Fi module to the designated MQTT broker topic.
3. Power Supply Module
A reliable power source for the electronic modules is paramount. Since the system is deployed near the solar panels, it logically derives power from the PV array itself.
- Wide-Input DC/DC Conversion: The input voltage from the combiner box can vary widely (e.g., 300V to 1000V DC). A high-voltage, isolated DC/DC converter (e.g., a module like PV15-29BxxR3 series) first steps this down to a safer intermediate voltage like 24V DC.
- Secondary Regulation: Subsequent switching or linear voltage regulators (e.g., LM78M05, LM1117) then derive the stable voltages required by the different components: 5V for the microcontroller and peripherals, and 3.3V for the Wi-Fi module and logic circuits.
- Protection: The design incorporates protection against over-voltage, reverse polarity, and transient spikes to ensure longevity in the harsh outdoor environment typical of solar panels installations.
| Module | Component | Key Function/Specification |
|---|---|---|
| Data Acquisition | Microcontroller (STM32F103) | ARM Cortex-M3 core, 72 MHz, ADC for signal conversion. |
| Current Sensor (Hall-effect) | Galvanic isolation, measures DC current up to 10A or more. | |
| IoT Communication | Wi-Fi Module (ESP32) | Integrated TCP/IP stack, supports Wi-Fi & Bluetooth, low power modes. |
| Power Supply | Primary DC/DC Converter | Input: 200-1500V DC, Output: 24V DC, Isolated. |
| Secondary Regulator (LM1117) | Low-dropout, provides stable 3.3V output. |
Software Architecture and Data Flow
The software ecosystem bridges the gap between raw data from the solar panels and actionable insights for the operator. It consists of firmware embedded in the acquisition nodes, server-side applications, and a user-facing monitoring dashboard.
1. Embedded Firmware
The firmware running on the microcontroller follows a structured loop:
- Initialization: Configures ADC, timers, UART (for Wi-Fi), and I/O pins.
- Sensor Polling: Periodically reads voltage and current values from all channels via the ADC.
- Data Processing: Applies calibration coefficients, filters noise (e.g., using moving average filters), and calculates power and energy.
$$E_{daily} = \sum_{t=0}^{T} P_{total}(t) \cdot \Delta t$$
where \(E_{daily}\) is the daily energy yield, \(P_{total}(t)\) is the total power at time \(t\), and \(\Delta t\) is the sampling interval. - Communication Handling: Formats the processed data into a packet and sends it to the Wi-Fi module with instructions to publish to the MQTT broker.
- Sleep Management: Enters low-power sleep modes between sampling intervals to conserve energy, a critical feature for systems powered by the solar panels they monitor.
2. Server-Side and Cloud Platform
An MQTT broker (e.g., EMQX, Mosquitto) acts as the central nervous system, receiving messages from all nodes. Backend services, often written in Python or Node.js, subscribe to the data streams to perform several key functions:
- Data Ingestion & Storage: Parses incoming JSON data and stores it in a time-series database (e.g., InfluxDB) or a traditional SQL database for long-term trending.
- Real-time Processing: Calculates aggregate metrics for the entire plant, detects anomalies (e.g., sudden voltage drop indicating a faulty string of solar panels), and triggers alert notifications via SMS or email.
- API Provision: Exposes a RESTful API so that the front-end dashboard can retrieve historical and real-time data.
3. Monitoring Dashboard
A web-based dashboard provides the user interface. Developed using frameworks like React or Vue.js, it visualizes data in an intuitive manner:
- Real-time Gauges & Charts: Displays current voltage, current, power, and yield for individual strings and the entire plant.
- Historical Trends: Interactive charts allow users to view performance over hours, days, months, or years, helping to identify degradation in solar panels.
- Alerts & Reports: Lists active alarms and generates performance reports (daily, monthly energy reports).
- Geographical View: For large farms, a map overlay showing the status of different sections or combiner boxes can be implemented.
| Field | Example Value | Description |
|---|---|---|
| node_id | “CB_01” | Unique identifier for the combiner box/node. |
| timestamp | 1698765432 | Unix epoch time of measurement. |
| voltage | 735.5 | DC bus voltage (V). |
| channels | [2.1, 2.3, 0.0, 2.5, …] | Array of current values (A) for each string. |
| total_power | 1545.2 | Calculated total power (W). |
| temperature | 42.5 | Ambient or module temperature (°C). |
Advanced Feature: Power Prediction using LSTM-KNN Model
Beyond simple monitoring, the collected historical data from the solar panels enables predictive capabilities. A short-term power forecasting model can be integrated into the server-side analytics to predict power output for the next hours or day. This is invaluable for grid integration and energy trading. We describe a hybrid model combining a K-Nearest Neighbors (KNN) algorithm for feature selection with a Long Short-Term Memory (LSTM) network for sequence prediction.
1. Feature Selection with KNN and Mahalanobis Distance
Not all weather parameters equally influence the output of solar panels. The KNN algorithm is used to select the most relevant meteorological features (e.g., irradiance, temperature, humidity, cloud cover) from a historical dataset. The similarity between a target weather vector \(\mathbf{x}\) and historical vectors \(\mathbf{x}_i\) is measured using the Mahalanobis distance \(D_M\), which accounts for correlations between features:
$$D_M(\mathbf{x}, \mathbf{x}_i) = \sqrt{(\mathbf{x} – \mathbf{x}_i)^T \mathbf{S}^{-1} (\mathbf{x} – \mathbf{x}_i)}$$
where \(\mathbf{S}\) is the covariance matrix of the feature dataset. The \(K\) historical data points with the smallest \(D_M\) to the current conditions are identified. Their corresponding power outputs from the solar panels are used to form an optimized input sequence for the prediction model.
2. Sequence Prediction with LSTM Network
LSTM networks are a type of Recurrent Neural Network (RNN) adept at learning long-term dependencies in time-series data, making them ideal for forecasting the output of solar panels based on past weather and power trends. The internal gates of an LSTM cell govern the flow of information.
- Forget Gate (\(f_t\)): Decides what information to discard from the cell state \(C_{t-1}\).
$$f_t = \sigma(W_f \cdot [h_{t-1}, x_t] + b_f)$$ - Input Gate (\(i_t\)) & Candidate State (\(\tilde{C}_t\)): Decide what new information to store.
$$i_t = \sigma(W_i \cdot [h_{t-1}, x_t] + b_i)$$
$$\tilde{C}_t = \tanh(W_C \cdot [h_{t-1}, x_t] + b_C)$$ - Cell State Update (\(C_t\)): Combines the old and new information.
$$C_t = f_t * C_{t-1} + i_t * \tilde{C}_t$$ - Output Gate (\(o_t\)) & Hidden State (\(h_t\)): Determine the final output based on the updated cell state.
$$o_t = \sigma(W_o \cdot [h_{t-1}, x_t] + b_o)$$
$$h_t = o_t * \tanh(C_t)$$
Here, \(\sigma\) is the sigmoid activation function, \(\tanh\) is the hyperbolic tangent function, \(W\) and \(b\) are learned weights and biases, \(x_t\) is the input at time \(t\), and \(h_{t-1}\) is the previous hidden state.
The selected historical weather-power sequence is fed into the LSTM network. The final hidden state, often enhanced with an attention mechanism to weigh the importance of different time steps, is passed through a fully connected (dense) layer to produce the predicted power output for the upcoming period. This prediction can be visualized on the dashboard alongside actual measurements.
| Parameter | Measured Performance | Note |
|---|---|---|
| Voltage Measurement Range | 0 – 1000 V DC | Scalable based on divider ratio. |
| Current Measurement Range | 0 – 10 A per channel | Scalable with sensor choice. |
| Sampling Rate | Configurable (e.g., 1 sample/5 sec) | Balances data resolution and power/bandwidth. |
| Wireless Range (Node to Gateway) | > 200m (line-of-sight with Wi-Fi) | Extendable with mesh/repeaters. |
| Data Transmission Latency | < 2 seconds (end-to-end) | Sufficient for monitoring and control. |
| Prediction Model Accuracy (RMSE) | ~5-8% of rated capacity (short-term) | Dependent on weather forecast quality. |
Experimental Validation and Results
The system was deployed and monitored over an extended period in a photovoltaic plant. The wireless network proved stable, reliably transmitting data from the widely dispersed solar panels combiner boxes. A sample of one day’s voltage data, as captured and displayed by the system, clearly shows the characteristic curve: starting near 20V at dawn, rising to a peak above 930V around solar noon, and declining back to 20V at night. This pattern validates the accurate temporal tracking of the solar panels‘ performance.
Simultaneous current measurements from 16 different strings of solar panels were recorded. The data showed currents consistently in the 2.0A to 2.8A range under similar irradiance, with minor variations attributable to panel mismatch, soiling, or slight orientation differences. The ability to monitor each string individually is a key advantage, as it allows for the rapid pinpointing of underperforming strings—a task nearly impossible with only whole-array monitoring. The table below shows a snapshot of this multi-channel data.
| String Channel | Current (A) | String Channel | Current (A) |
|---|---|---|---|
| 1 | 2.06 | 9 | 2.51 |
| 2 | 2.77 | 10 | 2.48 |
| 3 | 2.45 | 11 | 2.39 |
| 4 | 2.61 | 12 | 2.55 |
| 5 | 2.33 | 13 | 2.42 |
| 6 | 2.58 | 14 | 2.36 |
| 7 | 2.49 | 15 | 2.44 |
| 8 | 2.67 | 16 | 2.40 |
Conclusion
This article has presented a comprehensive IoT-based wireless data acquisition and monitoring system designed to address the practical challenges associated with managing modern photovoltaic installations. By replacing complex wired networks with a flexible, modular, and wireless architecture, the system significantly reduces installation complexity and cost while enhancing scalability. The integration of robust hardware for data acquisition, efficient IoT communication protocols for data transmission, and intelligent software for visualization and analysis creates a powerful tool for plant operators. The addition of a sophisticated LSTM-KNN power prediction model further elevates the system from a passive monitoring tool to an active management asset, enabling better grid integration and operational planning. Continuous operation over more than a year in a real-world environment of solar panels has demonstrated the system’s reliability, stability, and practical value in ensuring the optimal performance and maximum energy yield from solar power assets. Future work may focus on integrating more advanced analytics for predictive maintenance of individual solar panels and leveraging edge computing to perform more data processing directly at the node level.