
At present, there are three main aging models for lithium-ion batteries, namely mechanism models, semi empirical models, and empirical models. The mechanism model often takes the porous electrode theory as the core and combines basic principles such as material conservation and current conservation to solve the aging of lithium-ion batteries. This model can comprehensively describe the electrochemical, chemical, and physical processes inside lithium-ion batteries. However, the electrochemical processes included in the model are complex and diverse, with numerous chemical parameters, Often difficult to implement and verify; The semi empirical model is a simplification of the mechanism model, assuming that the growth of the intermediate phase in the solid electrolyte is a control step for the aging rate. Combined with experiments, the relationship between the aging of lithium-ion batteries and external stress can be obtained, which can to some extent describe the internal aging mechanism of lithium-ion batteries, However, a large number of simplifications and assumptions limit the accuracy and application scope of the model; The empirical model is based on fitting experimental data with empirical formulas to obtain the relationship between external characteristic changes and external stress. This model does not rely on the internal aging mechanism of lithium-ion batteries and is convenient to use. However, to be accurate, a large amount of experimental data support is required.
Based on the data of cyclic aging and calendar aging tests of lithium cobalt oxide/graphite batteries publicly available at the Advanced Life Cycle Engineering Research Center of the University of Maryland, a semi empirical study on cyclic aging and calendar aging of lithium cobalt oxide/graphite batteries was established
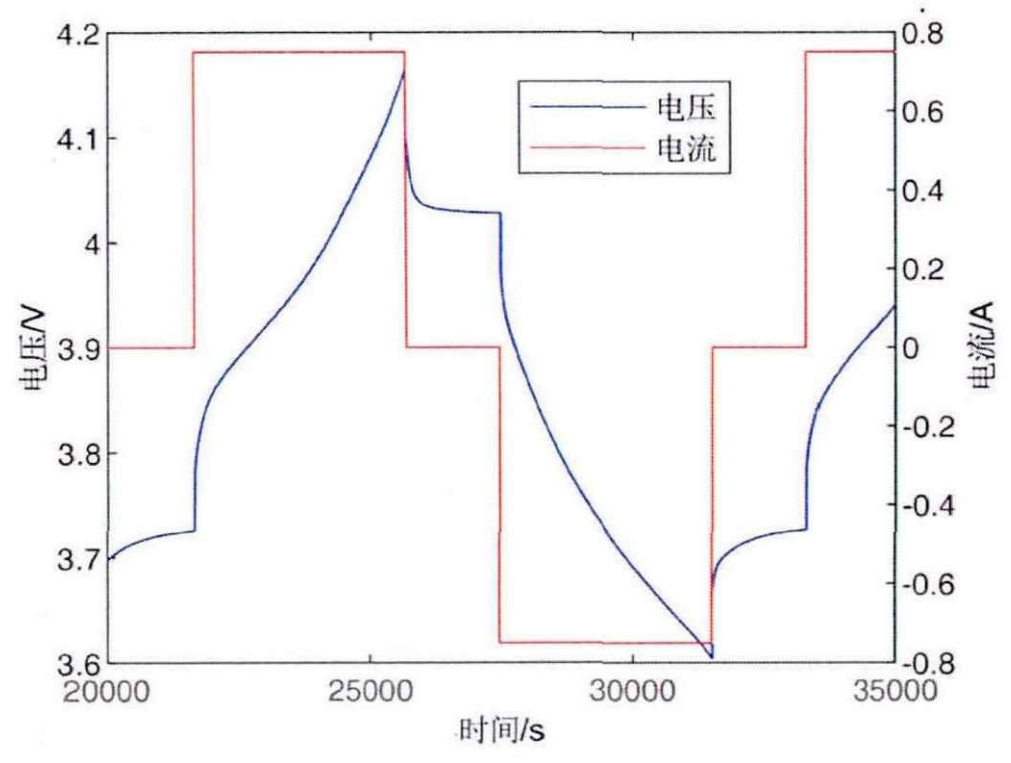
Verify the model. In the cyclic aging test, lithium-ion batteries were cycled approximately 1200, 900, 1500, 2000, and 1200 times at a rate of C/2 within five different SOC ranges of 0% -60%, 0% -100%, 20% -80%, 40% -60%, and 40% -100%, respectively. After each charge and discharge, the lithium-ion battery is left to stand for 30 minutes to stabilize its properties. The charge discharge curves for SOC cycles ranging from 20% to 80% are shown in Figure 1, while the charge discharge curves for other SOC cycle ranges are shown in Appendix Figure 2.
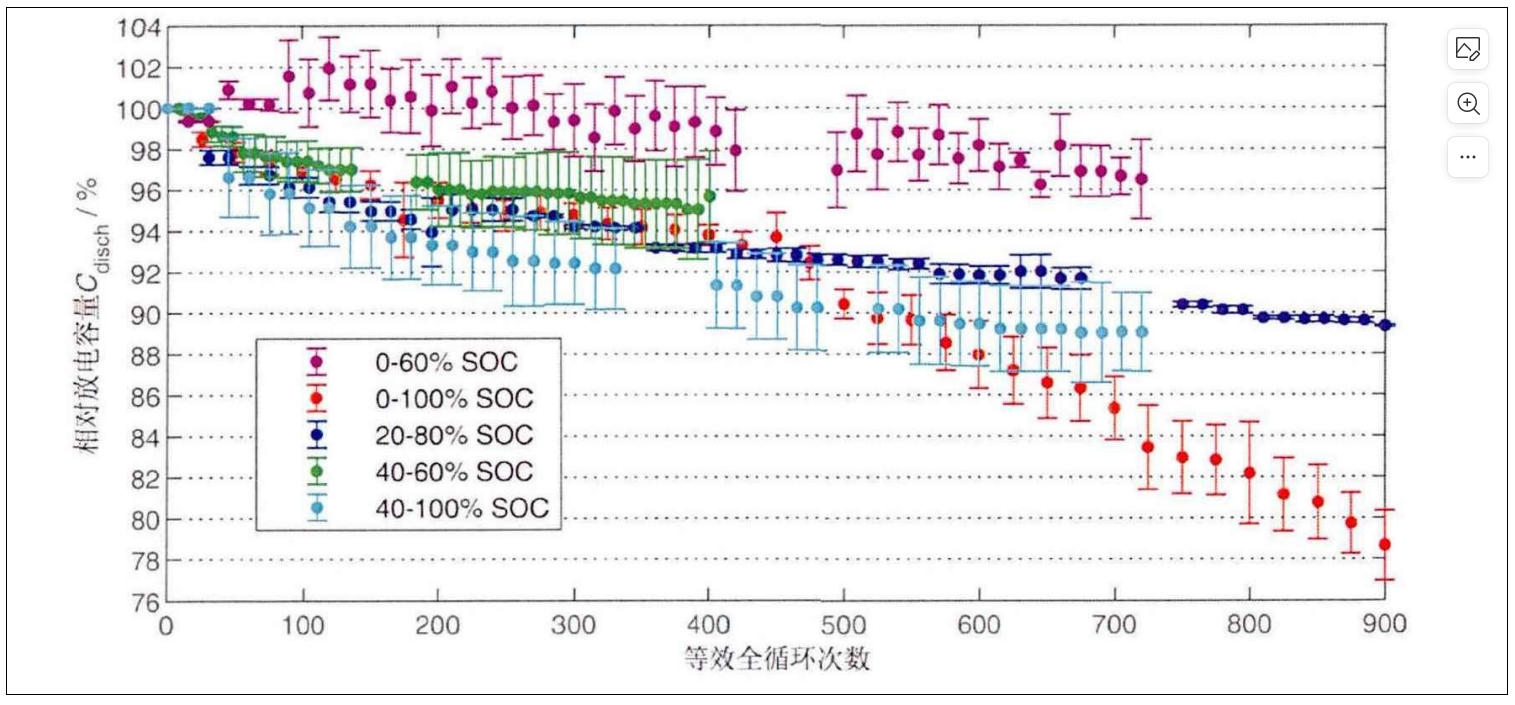
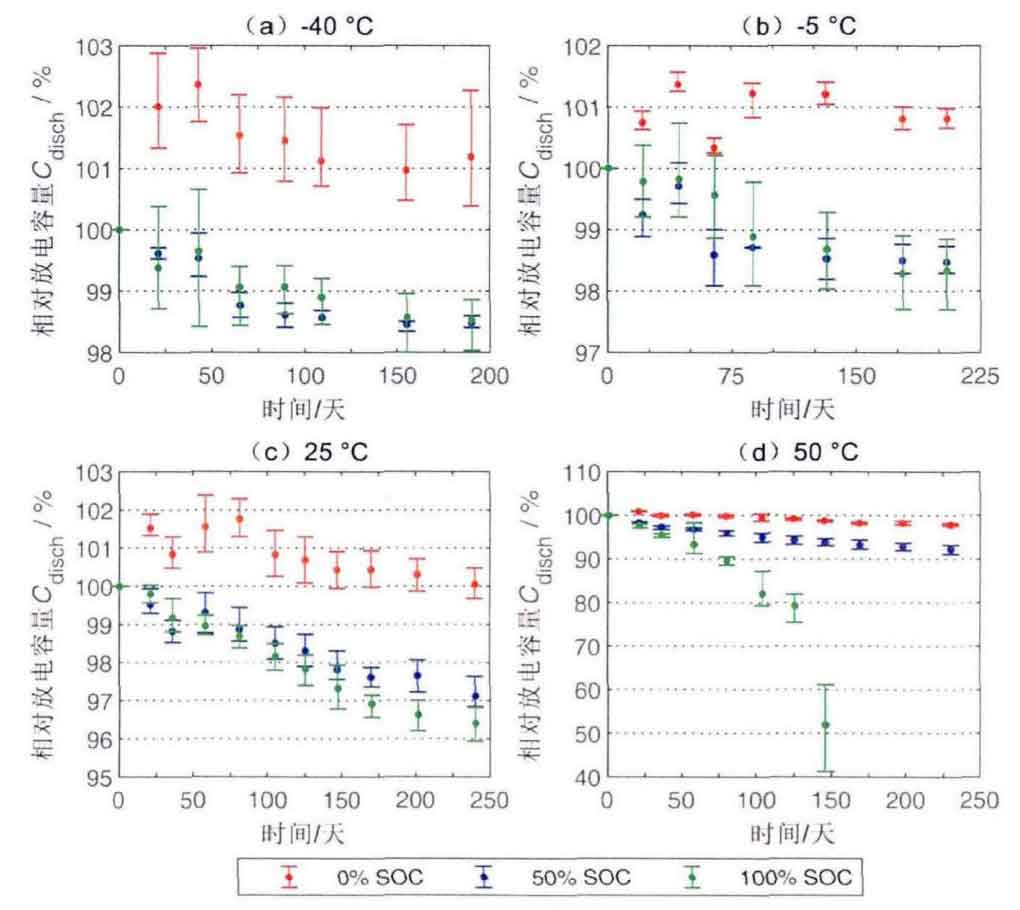
In the calendar aging test, 144 lithium-ion batteries were set to 0%, 50%, and 100% SOC, and stored for eight months at -40 ° C, -5 ° C, 25 ° C, and 50 ° C, respectively. Figures 3 and 4 show the results of capacity degradation of lithium-ion batteries after cyclic aging test and calendar aging test, respectively. The equivalent number of full cycles refers to the ratio of cumulative discharge capacity to initial discharge capacity, and the relative discharge capacity refers to the ratio of discharge capacity of lithium-ion batteries after aging to their initial discharge capacity.
Two phenomena can be observed from the cyclic aging test results:
(1) When testing within an equal range of SOC variation (SOC of 0% -60%, 20% -80%, and 40% -100%), the capacity decay of lithium-ion batteries tested in the low SOC range is slower than that of lithium-ion batteries tested in the high SOC range, The capacity decay is slower when SOC is 0% -60% than when SOC is 20% -80% and slower when SOC is 40% -100%.
It is worth noting that the capacity of lithium-ion batteries tested within the SOC range of 0% -60% showed a slight increase in the initial 270 equivalent full cycles, and even after 700 equivalent full cycles, the remaining capacity of lithium-ion batteries remained above 96%. This means that the aging mechanism of lithium-ion batteries cycled in the range of 0% -60% SOC may be different from that of lithium-ion batteries cycled in the high SOC range. However, no clear explanation has been found for this phenomenon in existing research.
(2) When testing within the SOC cycle range with an average SOC of 40% -60%, 20% -80%, and 0% -100%, the capacity of lithium-ion batteries slowly decreases in the initial 400 equivalent full cycles, and after 500 equivalent full cycles, The smaller the SOC cycle range, the slower the rate of capacity decrease in lithium-ion batteries. This phenomenon is likely related to the distribution of lithium. Lewerenz et al. have pointed out that in lithium-ion batteries, the more uniform the distribution of lithium, the slower the capacity decay of lithium-ion batteries, and a small SOC cycle range corresponds to a high uniformity of lithium distribution.
After 500 equivalent full cycles, the capacity degradation of lithium-ion batteries cycled in the range of 0% -100% SOC accelerated, indicating the possible existence of a new aging mechanism in this stage. In fact, more experimental data is needed here to analyze whether there is an accelerated capacity decay when lithium-ion batteries are cycled within a smaller SOC range, in order to better understand the reasons for this phenomenon.