
Optimization methods generally include mathematical optimization algorithms and parameter research. In many thermal storage performance studies, the common method is to optimize variables one by one, but this analysis has certain limitations, that is, it does not consider the mutual influence between different variables. Therefore, it is necessary to identify significant factors that affect the thermal performance of energy storage systems and analyze their interactions. Meanwhile, based on the relationship between the above factors, obtain the optimal parameter combination for the thermal performance of the energy storage system.
Response surface methodology is a mature mathematical modeling and statistical technique used to determine the relationship between design variables and response indicators in a series of experiments or simulations. By identifying the relationship between variables and response values, the impact of each parameter on response indicators can be obtained, and the optimal response value can be determined through parameter optimization. This method has been widely used in experimental design and process optimization. Therefore, the response surface method can effectively analyze the impact of various factors and their interactions on the performance of energy storage systems, and combine it with the expected function to obtain the optimal parameter combination.
The response surface method first requires designing experimental or simulation schemes, conducting corresponding simulations based on the schemes, and calculating the response values under different schemes. Then, by obtaining multiple sets of combined data results, establish a functional relationship between influencing factors and response values. Due to the combination of experimental design and statistical methods, the results have good robustness.
1. Response surface model
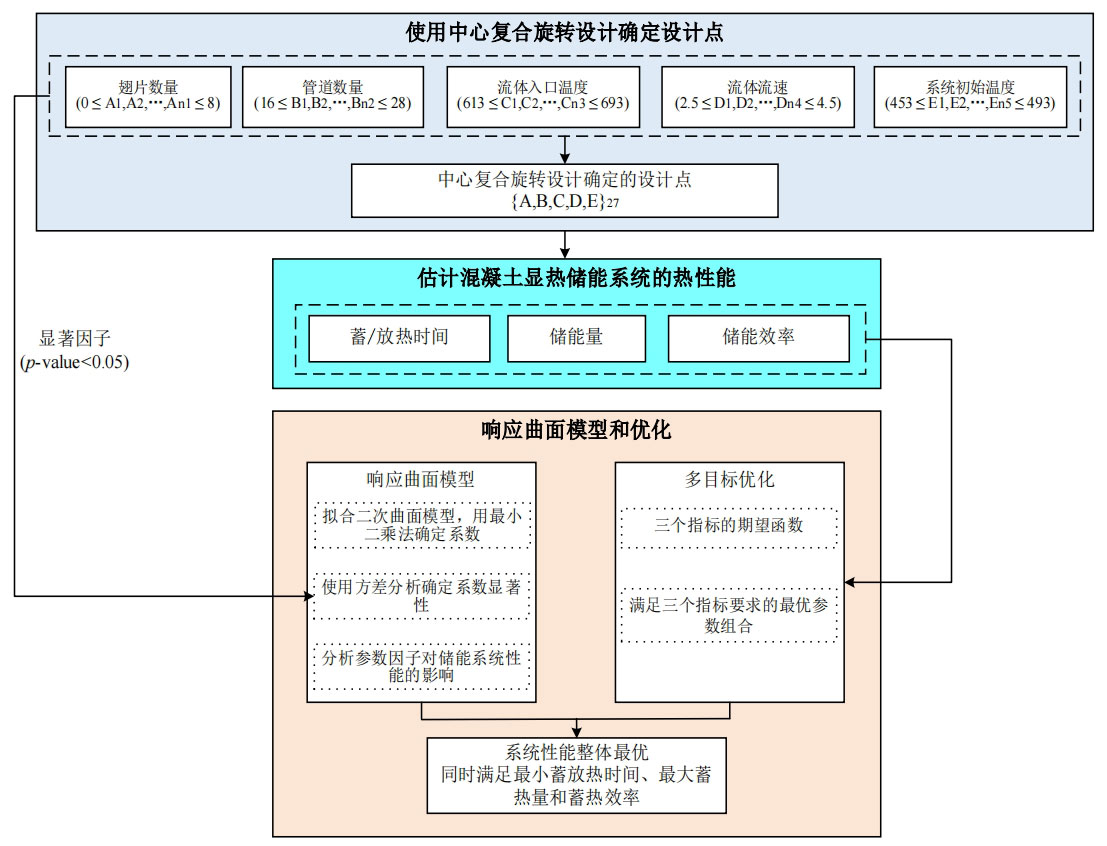
Figure 1 shows a schematic diagram of the thermal performance optimization method for energy storage systems based on the response surface model. It mainly includes the following three parts: (1) Determine the design points using center composite rotation design; (2) By simulating the design points to obtain response values, establish a response surface model; (3) Based on the response surface model and expected function, the optimal design of the overall thermal performance of the system can be obtained.
Response surface methodology is a technique for studying the relationship between response variables and a set of design variables. The response surface model is a polynomial regression model that represents the relationship between influencing factors and response indicators. This model can quickly evaluate the thermal response of energy storage systems within the range of each design variable value. By using experimental design methods, relatively accurate thermal response values of energy storage systems can be obtained with minimal data, without the need to simulate all research combinations. So, after determining the range of design variables, using the response surface method can quickly obtain the response values, effectively reducing calculation time and cost. At present, the response surface method has been applied in many fields. This includes parameter optimization of buried heat exchangers, enhanced heat transfer in the form of fins in phase change energy storage systems, analysis and optimization of thermal performance of packed beds, and prediction and optimization design of thermal performance of naturally ventilated underground shelters. However, it has not yet been used in the design and optimization of concrete energy storage systems.
In concrete sensible heat storage systems, the relationship between performance indicators such as heat storage time, energy storage, and heat storage efficiency and influencing factors is complex and difficult to express through specific physical equations. The response surface model can simplify the complex relationship between influencing factors and response values. The use of response surface models can obtain significant factors that affect response indicators and the interaction between these factors, and can be used to optimize multiple response indicators simultaneously.
The response surface model can obtain a regression equation by fitting the functional relationship between design variables and response indicators. When the range of variation of a variable deviates significantly from the target value, using a first-order function search can reduce computational complexity and quickly search to the vicinity of the target value. When the range of variation is close to the target value, it is necessary to refine the accuracy of the search and add a quadratic term to the equation, in order to respond to the precise proximity of the surface near the target value. The entire function equation is shown in the formula:
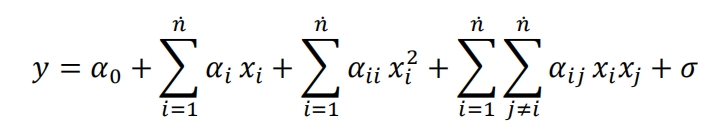
Among them, y is the response indicator; Xi and xj are the i-th and j-th design variables, respectively; ? is the number of design variables; ? 0, ?ǐ, ?ǐ, and ?ǐ j are the coefficients of the constant term, linear term, quadratic term, and interaction term, respectively; σ It is a statistical error.
2. Simulation scheme design
Before establishing a response surface model, it is necessary to first conduct experimental design and obtain a set of response values within the design range. For concrete sensible heat storage system units, due to the relatively limited thermal conductivity of concrete, in order to increase the thermal conductivity of the system, it is usually necessary to adjust the number of pipes and fins. However, considering the relatively high prices of pipes and fins, cost factors need to be comprehensively considered.
Prasad and Muthukumar determine the optimal number of pipelines by balancing the reduction in system heat storage time and the increase in pipeline costs. At the same time, they also analyzed the effects of the number of fins and fluid velocity on energy storage and heat storage time. Research has found that in concrete media, an increase in the number of fins and flow rate can reduce the system’s heat storage time. Although the increase in the number of fins takes up some of the concrete volume, it improves the heat transfer efficiency of the system and accelerates the temperature rise of the concrete. Within a certain period of time, as the number of fins increases, the energy storage also increases because the temperature difference between the system and the initial time is greater. However, this effect only varies significantly with and without fins, and the difference in influence between different numbers of fins is relatively small. This indicates that the number of fins has a diminishing marginal effect on reducing heat storage time. In order to reduce heat storage and release time and optimize system costs, Vigneshwaran et al. used cast steel with higher volume energy density and thermal conductivity efficiency as the material for energy storage systems. Due to the high working temperature, the system can directly generate steam for power generation.
In addition to the influence of the number of pipes and fins on the application effectiveness of energy storage systems, the temperature and flow rate of the fluid entering the system can also affect system performance for specific heat transfer fluids. Vigneshwaran et al. investigated the effects of fluid inlet temperature and flow velocity on the thermal performance of concrete energy storage systems based on experiments and simulations. The research results indicate that as the flow rate increases from 2m/s to 3m/s, the heat storage and release time for the system to reach the set temperature are reduced by 48% and 27.4%, respectively. The fluid flow rate remains constant at 2m/s, and the inlet temperature of the system increases from 280 ℃ to 300 ℃, resulting in a 28.9% increase in the efficiency of the energy storage system. Further increasing the inlet temperature to 320 ℃ enhances the efficiency of the energy storage system by 25.9%. For the exothermic process, reducing the fluid inlet temperature from 130 ℃ to 110 ℃ can reduce the exothermic time by 22.3%. However, further reducing the inlet temperature to 90 ℃ does not significantly reduce the time required for heat release. In addition, Rao et al. [54] analyzed the effect of different fluid flow rates on the heat storage and release time of energy storage systems made of cast steel and concrete materials based on experimental data. As the flow rate increases, the convective heat transfer efficiency of the fluid in the pipeline increases, and the time required for the system to reach the set temperature decreases. The effect of increasing flow rate on the reduction of heat storage and release time in the steel casting system is significantly higher than that in the concrete system, but as the flow rate increases, the marginal effect of this reduction decreases, which is similar to the results obtained in Prasad and Muthukumar studies. This indicates that the flow rate has a greater impact on the thermal conductivity of the energy storage system medium, and there is an interaction between the two in terms of affecting the heat storage and release efficiency. However, this interaction manifests differently in concrete systems with different finned tube materials, and the heat storage and release time of copper finned tube concrete systems is shorter than that of low-carbon steel concrete systems. The decrease in heat storage and release time of copper finned tube system with an increase in flow rate is smaller than that of low-carbon steel system, but the difference between the two is relatively small.
The thermal performance of the system also varies in different temperature ranges (Tini Tin). As the temperature range increases, the heat storage time of the system increases, and the heat storage time of the concrete energy storage system in the high temperature range increases by about 10%. This is because the thermal properties of the concrete medium are greatly affected by temperature. As the temperature increases, the thermal conductivity of the concrete decreases, and the heating rate decreases. At the same time, in the high temperature range, the system loses more heat to the outside world, resulting in greater heat loss. Vigneshwaran et al. found in their research that the heat transfer efficiency and energy storage of cast steel energy storage systems are higher in the low operating temperature range than in the high temperature range. This is because at low temperatures, the density of air is higher, the energy density per unit volume is higher, and the energy transferred to the system is relatively more.
Based on the above analysis, geometric variables (number of fins and pipes) and operational variables (air inlet temperature, flow rate, and initial system temperature) were selected as design variables in this study. The response indicators are the system heat storage time, the system heat storage capacity and heat storage efficiency at 360 minutes. The heat storage time is the time required for the average temperature of concrete materials to reach the set temperature from the initial temperature value. The thermal storage efficiency represents the actual energy change of the system at time t divided by the maximum ideal energy change of the entire energy storage system. According to the China Statistical Yearbook (2020), the average daily sunshine hours in major cities in China are 5.6 hours. The northwest region has abundant solar energy resources, with an average daily increase of about 6.7 hours of sunshine. This article sets a time of 360 minutes, and the system’s energy storage ?? (?) and thermal storage efficiency ?? are expressed using formulas, respectively.
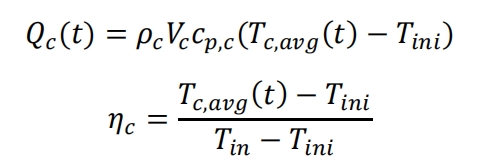
Among them, ??, ?Vg (?) is the average temperature of the concrete medium over time, while ?? and ?? are the initial temperature and fluid inlet temperature of the energy storage system, respectively.
For the experimental design of response surface models, Central Composite Design (CCD) and Box Behnken Design (BBD) are the two main design methods.
In order to determine the design point, this article uses Central Composite Rotatable Design (CCRD) because the optimal direction is not determined, and its rotatability ensures the accuracy of predicted values independent of direction. The central composite rotation design is mainly used for sequential experiments, which includes 2s factor design points, 2s axis points, and nc center points. The predicted variance at all points at the same distance from the central design point is equal, which ensures that the design used can have more accurate estimates in all directions.
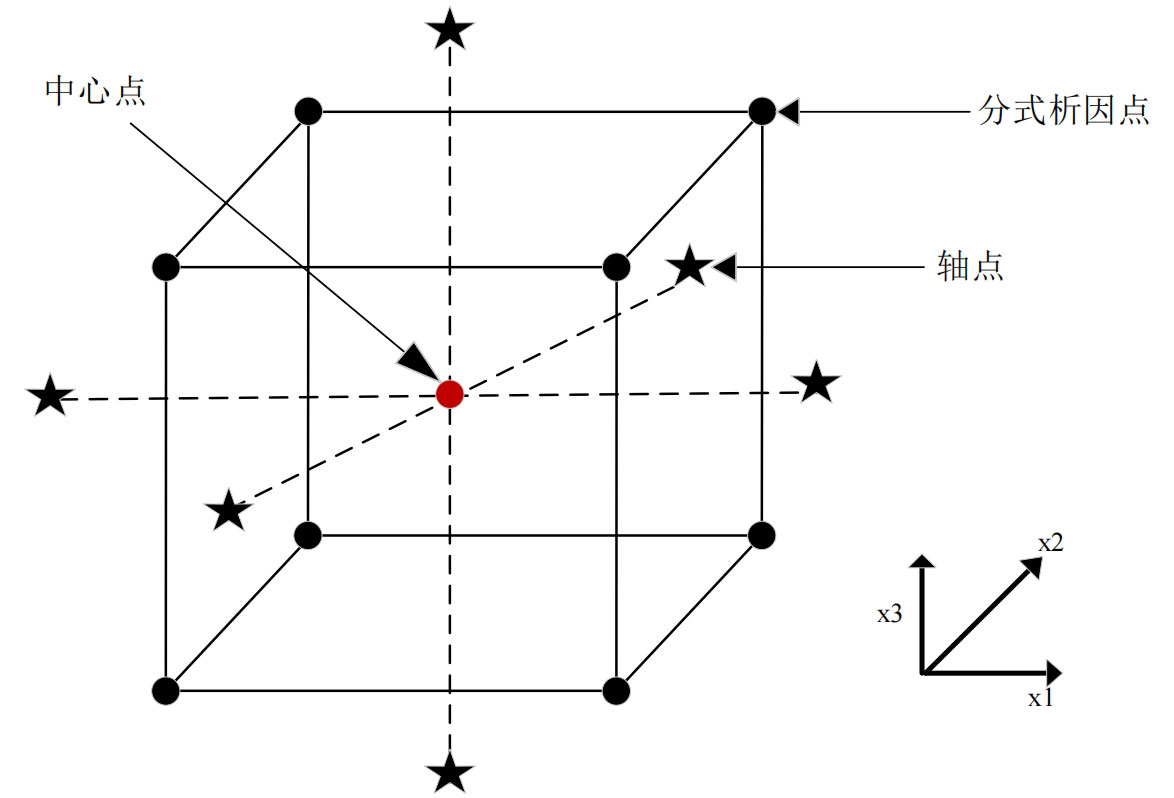
Figure 2 shows the geometric shape of the center composite design with three factors. The factor design point represents the optimal variance design of the first-order and second-order interaction model, and the center point provides surface information of the system. By repeating the center point, experimental errors can be reduced. However, since the simulation results are deterministic, there is no need to repeat the center point results. To ensure rotatability, the distance between the axis point and the center point is β= 2. This ensures that the predicted variance of the model is equal at points equidistant from the design center. The total number of simulations for the center composite rotation design is N=2s+2s+nc, where s is the number of design variables.
For this study, the factor design section is mainly used to obtain the main effects and two factor interactions of all design factors. When the interaction of three factors and higher-order factors can be ignored, using a factorial design with a resolution of X can effectively estimate the main effects and two factor interactions of all factors, without mixing factor effects. Therefore, using a 2 ^ 5-1v fractional factorial design with a resolution of ε, only 16 simulation results are needed to obtain the main effects of 5 influencing factors and their interactions, reducing the number of simulations and saving calculation time and cost. By adding the simulation of the axis and center points, a total of 27 simulations were obtained. The level and value range of the relevant design variables are shown in Table.
| Type | Variable Name | Item | Unit | Low level (-1) | High level (+1) |
| Design factors | Number of fins | A | Pieces | 2 | 6 |
| Design factors | Number of pipes | B | Pieces | 19 | 25 |
| Design factors | Fluid inlet temperature | C | K | 633 | 673 |
| Design factors | Fluid velocity | D | m/s | 3 | 4 |
| Design factors | System initial temperature | E | K | 463 | 483 |
| Response value | Heat storage time | T | min | ||
| Response value | Energy storage | Q | MJ | ||
| Response value | Heat storage efficiency | η | % |
After determining the range of variable values, it is necessary to encode the variables. The fractional factorial point code is located at ± 1, with a center point of 0 and an axis point of ± β。 The calculation rules for encoding variables are shown in the formula.
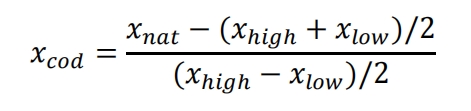
Among them, ?? od is the encoding variable, ?? at is the original variable, ?ℎℎℎ and ?? ow represent the maximum and minimum values of the design range, respectively.
The formula can be written in the following matrix form.
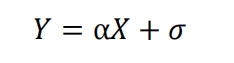
Among them, Y is the matrix composed of response indicator variable values, X is the design variable matrix, matrix α And ? are the coefficient matrix and error matrix, respectively. Solve the coefficient matrix in the formula α The following equation can be used.
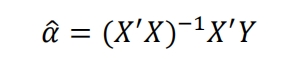
Among them, ǐ is the transpose of ǐ matrix, and (ǐ ǐ) − 1 is the inverse matrix of ǐ ǐ matrix. The estimated values of the main effect coefficient ?\and the coefficient of the two factor interaction term ?\j can be obtained through the least squares method.
3. Evaluation of Response Surface Model
By fitting the above simulation results, the regression equation of the response surface model can be obtained, and then the reliability and accuracy of the regression equation need to be verified.
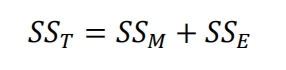
(1) Total sum of squares SST
The total sum of squares is used to measure the total variability of the data, and the total sum of squares SST is the sum of model squared sum SSM and residual (or error) squared sum SSE, expressed as:
(2) F-test
The F-test is the ratio of model mean square to residual mean square, used to test the accuracy of the model. The null hypothesis of the F-test is that the coefficients of all model terms are equal to 0. By calculating the F-value, it is determined whether to reject the null hypothesis. When the value of Prob>F is less than 0.05, the null hypothesis can be rejected and the model is reliable. The smaller the value of Prob>F, the more effective the model is. The expression for F-test is as follows:
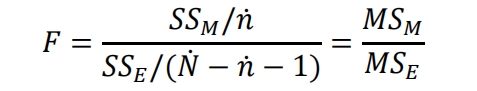
Among them, ? and ?− ?− 1 are the degrees of freedom of the model term and residual term, respectively.
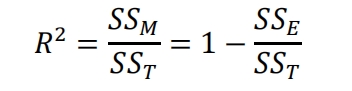
(3) Goodness of fit R2
R2 is used to measure the fitting quality of the model, with a range of changes from 0 to 1. The larger the value, the better the fitting effect. The expression is shown in the formula. Because as long as new variables are added, the R2 value will become larger and larger. However, if irrelevant variables are added, although the fitting value increases, it does not necessarily mean an improvement in fitting quality.
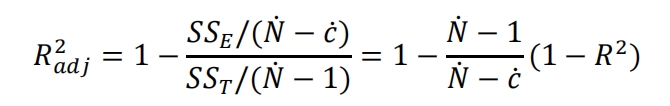
(4) Adjusted R ^ 2 (? ^ 2 ? dj)
The adjusted R2 value does not increase with the addition of irrelevant variables. Only by adding useful variables can ?^ 2;? dj increase, which is a more reasonable indicator. The expression is as follows:
4. Multi objective optimization
There is relatively little research on the optimization of thermal energy storage systems, and most of the research focuses on latent heat energy storage systems. Tao et al. studied the effects of operational and geometric parameters on latent heat storage units through parameter analysis. From the research results, it can be seen that the inlet velocity and temperature of the heat transfer fluid have a significant impact on the thermal storage performance, and the influence of pipe diameter on the thermal storage performance is minimal. It is recommended to use a larger pipe diameter. Tehrani et al. investigated the influence of geometric parameters on the performance of latent heat energy storage units. Expand the geometric parameters within the selected range of literature by evaluating all feasible combinations, and study the optimal values using outer diameter, inner diameter, and length as design variables. The results indicate that the optimization value of any specific geometric parameter depends on the values of other geometric parameters. Sun et al. used fluid inlet temperature, flow rate, and plate inclination angle as design variables and utilized the Taguchi method to minimize the melting time of plate latent heat storage units. Research has shown that after Taguchi optimization, the energy storage rate has increased by 23% without consuming more energy, and the melting process of phase change materials is most affected by the fluid inlet temperature. Jian et al. [133] applied genetic algorithm and sequential quadratic programming (SQP) algorithm to minimize the cost of concrete solid sensible heat storage modules. Design variables include diameter ratio, storage module length, average flow velocity inside the tube, and number of heat transfer tubes. Research has shown that the correct selection of internal heat transfer tube diameter is necessary, and the operating cost accounts for a significant portion of the total storage capacity cost.
Combining the response surface model, we use the expected function to achieve multi-objective optimization of concrete sensible heat storage systems. The objective function ??(X), also known as the joint expected function, converts each response value yi into a separate expected function ??(X), with a value range of [0,1]. Taking heat storage time as an example, the smaller the heat storage time, the better, and its conversion form can be expressed by a formula.
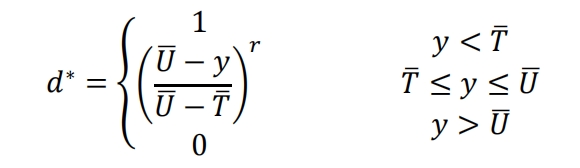
The greater the energy storage and heat storage efficiency, the better. Their conversion forms can be expressed by the formula:
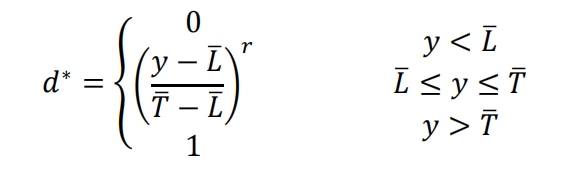
Among them, ? is the set upper limit, ? is the target value, ? is the set lower limit, and r represents the weight. If the response value yi is outside the acceptable range, then ?∗=0. The closer it is to the target value, the larger ?? will be [134, 135]. The design variable values are selected by maximizing the simultaneous objective function ?, which is the geometric average of all response values transformed.
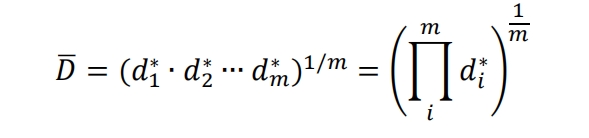
Where m is the number of responses. The expected goal is to minimize the heat storage time and maximize the heat storage capacity and efficiency of the energy storage system at 360 minutes.