
Based on a detailed introduction to the three-phase photovoltaic grid connected inverter, including control strategy, software and hardware design, in this chapter, we will build a physical model of the experimental model to further verify the feasibility of the control method and software and hardware design. For the safety and reliability of the experiment itself, we conducted a 1KW low-power experiment.
1. Introduction to physical models
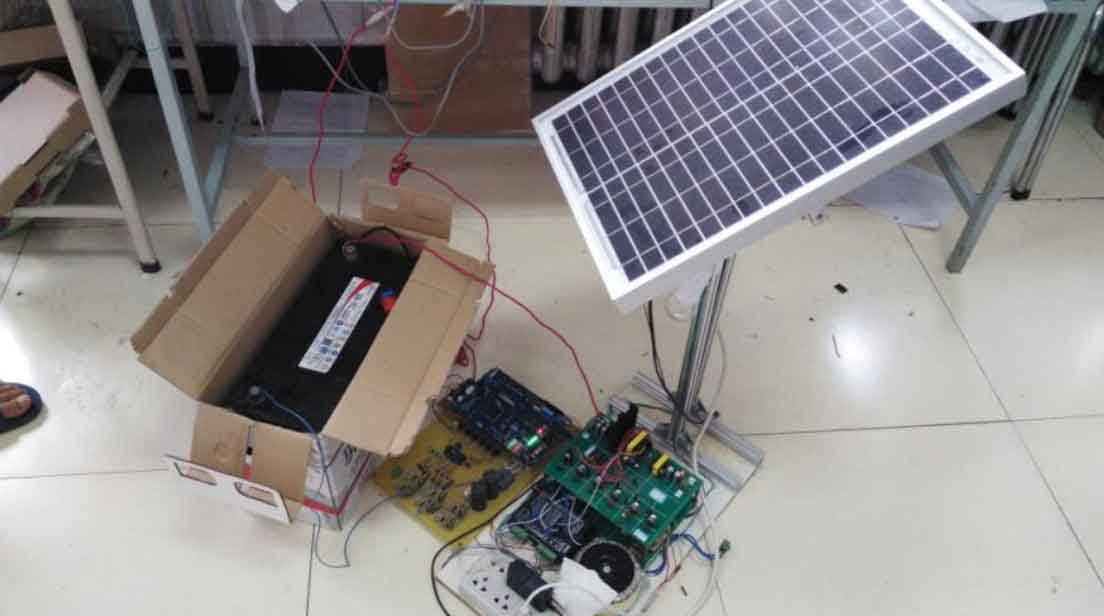
In the construction of the physical model, we connect the photovoltaic panel to the battery to output a relatively stable DC, and then control it through the circuit we designed. The overall physical model is shown in Figure 1, including the photovoltaic panel, battery, power supply, DSP2812 control board, main circuit, driving circuit, protection circuit, and sampling detection circuit.
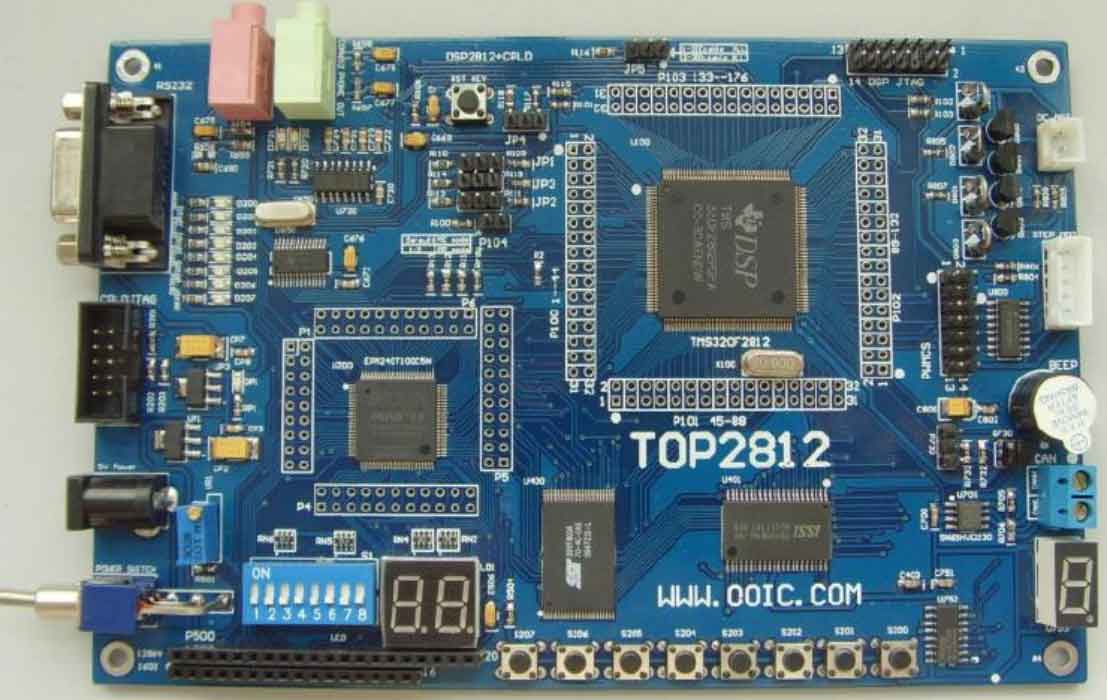
The control chip DSP2812 development board is shown in Figure 2.
2. Experimental detection results
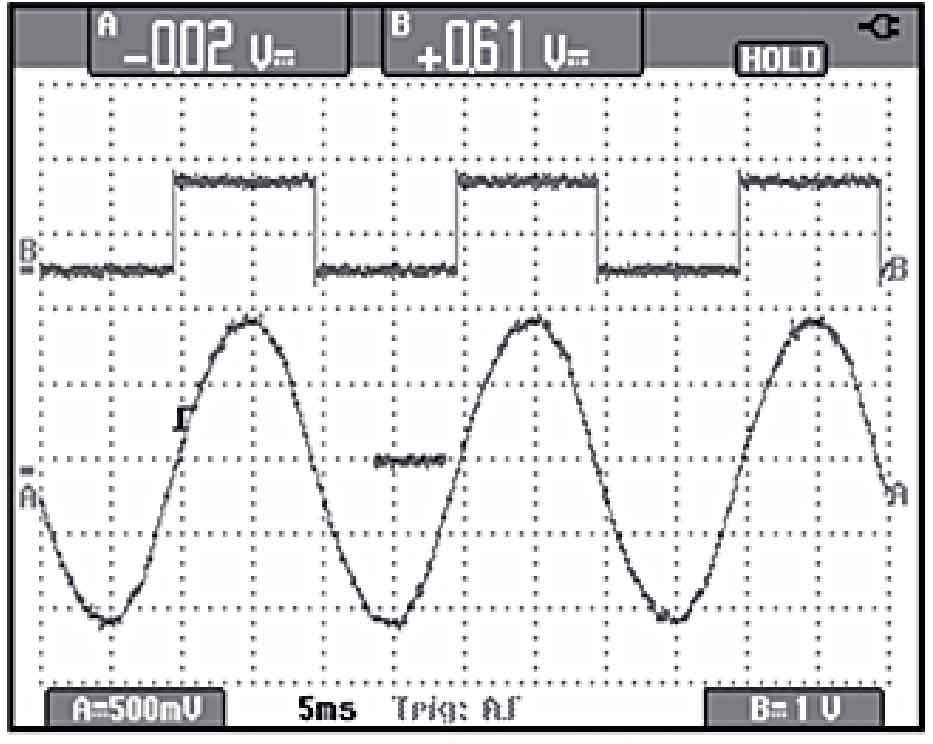
During the experiment, we detected the phase-locked loop, and the waveform is shown in Figure 3. The A line in the figure represents the collected A-phase grid voltage, while the B line represents the synchronization signal obtained after the grid voltage passes through the phase-locked loop zero crossing detection circuit. It can be seen from this that synchronous tracking of the grid voltage can be achieved.
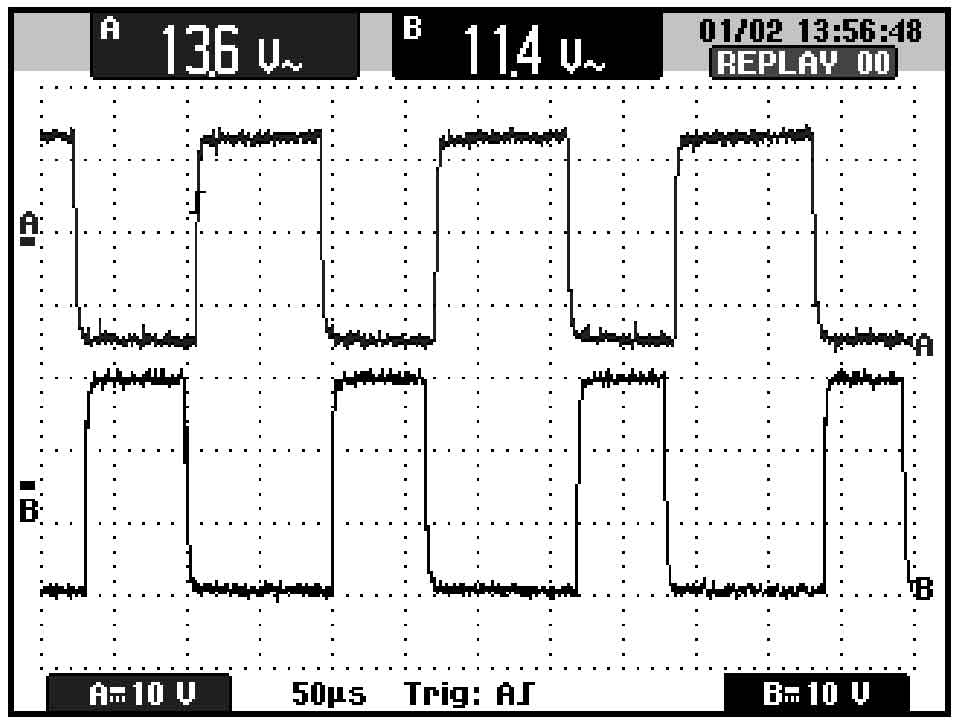
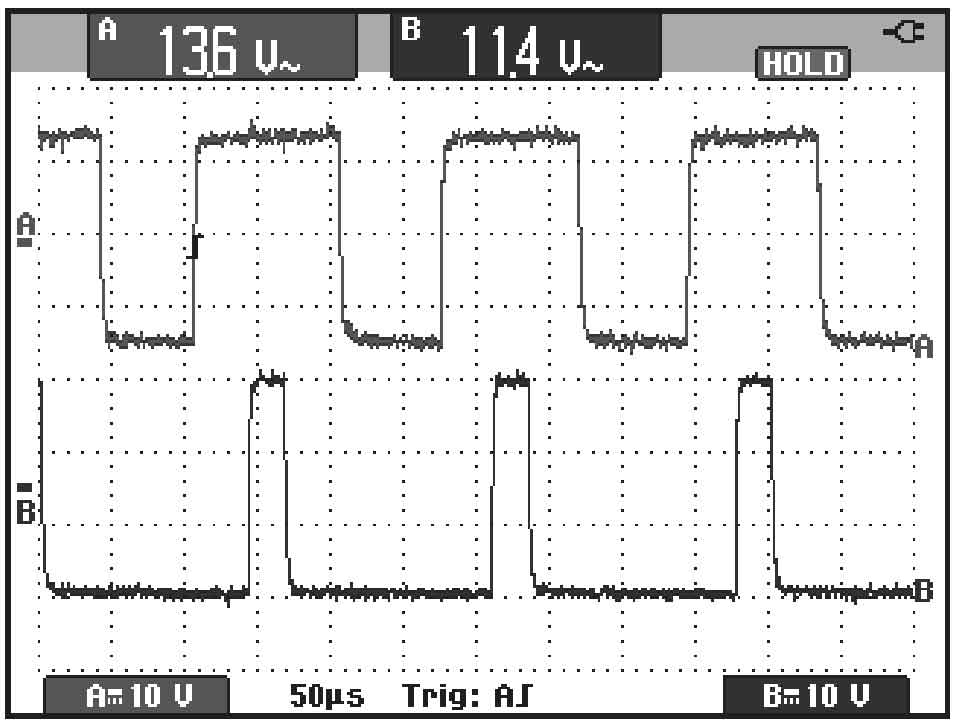
Next, we will collect and observe the pulse width modulation signal. Through software control of the three-phase solar inverter grid connected system, the modulation waveform output by the DSP is shown in Figure 4. Figure (a) shows the complementary signals driving the upper and lower bridge arms, with a dead time of 4 μ s. It can avoid the situation where the IGBTs of the upper and lower bridge arms are conducting simultaneously. (b) Figure shows the modulation waveform of the two upper bridge arms.
After the modulation of the driving waveform is completed, we start debugging and testing the entire three-phase solar inverter grid connected control system, observing the output three-phase voltage and comparing it with the grid voltage.
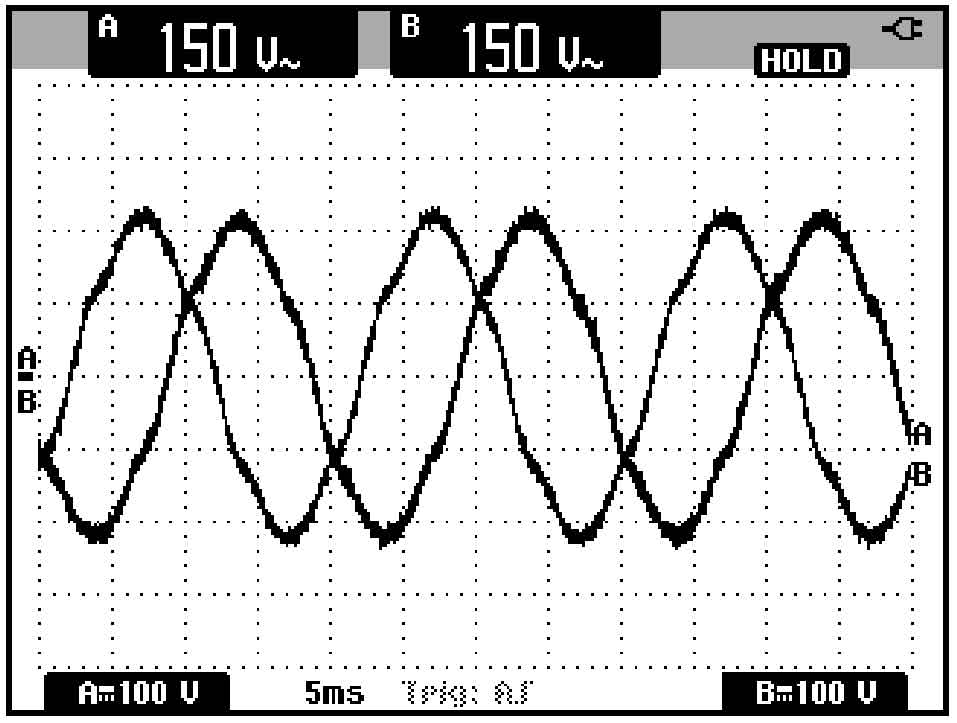
Due to the oscilloscope, we can only collect two output voltage signals at the same time, as shown in Figure 5, which is the output voltage waveform of AB two phases. It can be seen from the figure that the phase difference of the two phase voltages is 120 degrees, so the correctness of the output voltage is judged.
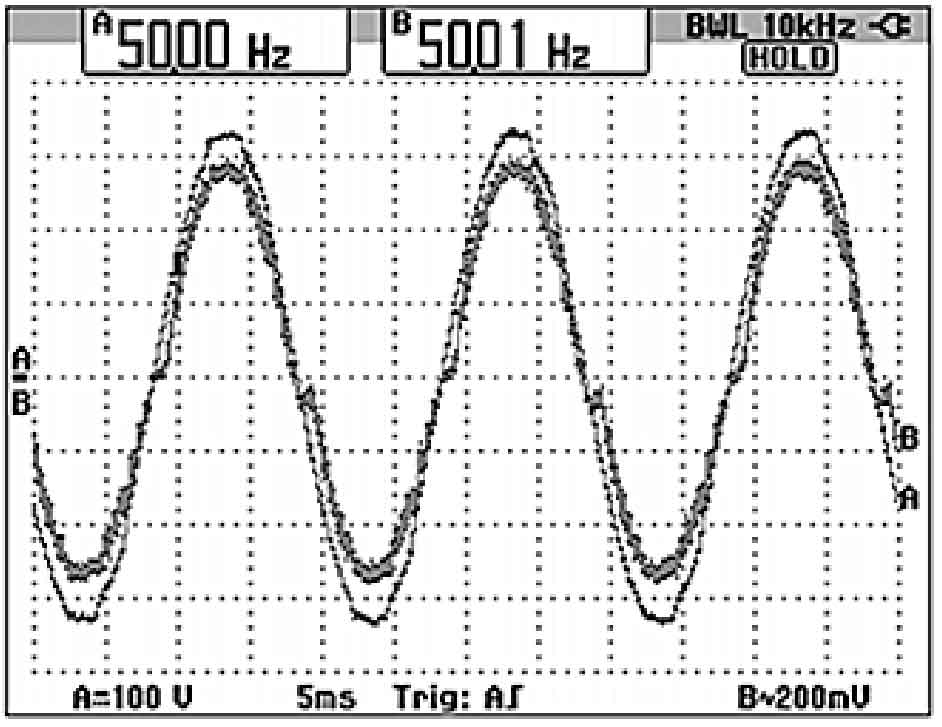
During operation, we collected and observed the voltage and grid connected current of phase A in the grid. The waveform of the grid voltage and grid connected current is shown in Figure 6, with line A representing the grid voltage and line B representing the grid connected current. In the figure, we can see that the output current waveform is good, with fewer harmonics, and the phase between the grid connected current and the grid voltage frequency is basically the same, meeting the requirements for grid connection.
3. Summary
The hardware circuit of the three-phase solar inverter connected to the grid was debugged, and the output waveforms of each link were observed through an oscilloscope. The output grid current was basically synchronized with the grid voltage, meeting the basic requirements for grid connection and proving the feasibility of the design. But there were also some issues during the debugging process that require further debugging.