
Using power electronics simulation software to verify the correctness of circuit design and the rationality of control algorithms can improve the efficiency and reliability of scientific research workers.This article mainly describes the use of Synopsys’s EDA software Saber to build a simulation platform for solar inverter systems, and models and simulates the aforementioned theoretical analysis.
1. Simulation structure of the system
The solar cell used in this system was programmed using the mast language on the saber simulation platform based on the proposed simplified engineering model of solar cells.The external environment S=1000W/m2, T=25°C, and the solar panel parameters are shown in Table 1.
| Short circuit current (Isc/A) | Open circuit voltage (Voc/V) | Maximum power point voltage (Vm/V) | Maximum power point current (Im/A) | Maximum power point power (Pm/W) |
| 18 | 228 | 180 | 17 | 3060 |
The simulation platform for the single-phase bipolar solar inverter system mainly includes the following modules: 1) solar cell module, 2) BOOST boost module, 3) full-bridge inverter module, 4) grid-connected relay, 5) filtering module, 6) load module, 7) voltage and current sampling module, 8) control module.The main parameters of the system are: effective value of grid voltage 220V (50Hz), boost inductance 1.1mH, DC side capacitance 2000uF, output side filtering inductance 3mH, output side filtering capacitance 1uF, using resistive load.Based on the above parameters and requirements, build a solar inverter system.
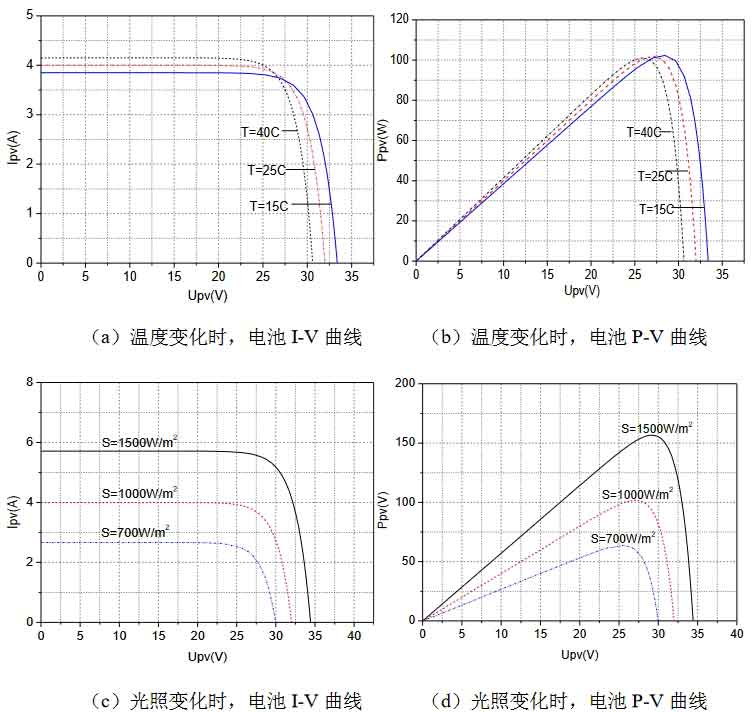
To ensure the correctness of the simulation, first ensure the correctness and reliability of the solar panel modeling.The test writes the solar cell model under different temperatures (T) and illumination (S) to output the characteristics curve and the actual operating curve, and obtains the I-V and P-V curves of the solar cell as shown in Figure 1.From the simulation results, it can be seen that under different test conditions, the output characteristics curve of the solar cell is consistent with the actual operating curve, achieving the expected effect, which proves the correctness of the modeling.
2. Improve the simulation of maximum power tracking algorithm
The tracking of MPPT is a dynamic process, and environmental changes have a significant impact on the maximum power point tracking effect.A good MPPT control algorithm can quickly track the maximum power point, and it will not make misjudgments when the environment changes, with fast adjustment speed.The experimental design should verify the MPPT tracking effect under severe environmental changes.Experimental design: Given a starting light intensity of 300W, the light intensity suddenly changes to 800W at 0.7s, and suddenly changes to 1000W at 1.4s. The traditional disturbance observation method and the variable step size disturbance observation method proposed in Chapter 2 are used to output the power from dynamic to stable state. The simulation waveform is shown in Figure 2.Figure 2(a) shows the light intensity change curve, and Figure (b) shows the dynamic waveform of maximum power tracking using two different MPPT control algorithms.The start time, adjustment time (light intensity suddenly changes from 200 W/m2 to 800W/m2), and the comparison of the error size at the maximum power point are shown in Table 2.
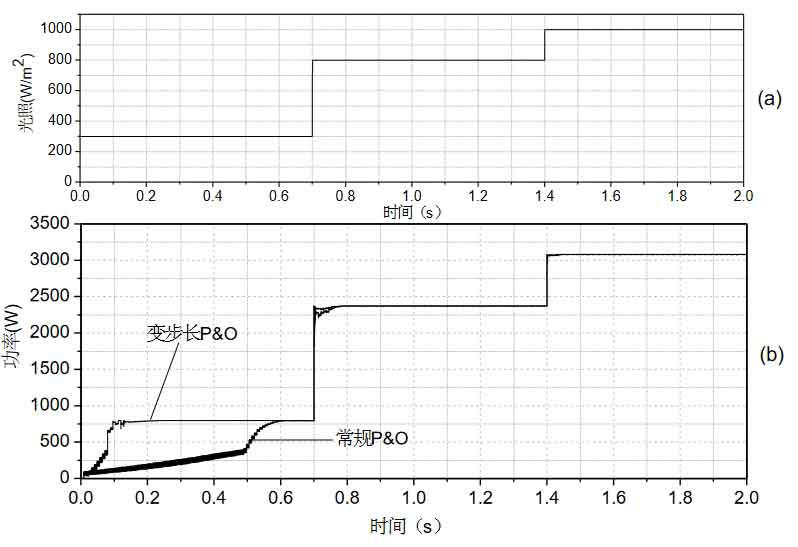
As shown in Figure 2 and Table 2, when using the variable step-size disturbance observer algorithm, the oscillation at the maximum power point, the startup time, and the adjustment time in the event of sudden changes in the external environment are all less than those of traditional disturbance observer methods, proving its superior dynamic and steady-state performance and verifying the algorithm’s rationality.
| MPPT tracking method | Start time | Adjusting time | Maximum power point efficiency |
| Variable step size P&O | 0.15s | 0.61s | 99.7% |
| Traditional P&O | 0.6s | 0.56s | 98.9% |
3. Simulation of solar inverter grid-connected control
3.1 Grid-connected current tracking control effect
When the solar inverter is operating in grid-connected mode, the phase and harmonic content of the output current are the key factors to control the full output of active power from the solar inverter. This section verifies the effect of dual closed-loop control through simulation.The voltage outer loop uses PI control.The current inner loop uses QPR control to achieve output steady-state error-free, which has better dynamic effects than traditional PI control. Through simulation, the control effects of two different controllers are compared.The parameters of the quasi-proportional resonant controller are Kp=6, Ki=120, ωc=3.2, and the parameters of the PI controller are Kp=3, Ki=2. The design simulation experiment is given: given a bus voltage of 370V, control the solar inverter to output unity power factor, compare the error of grid-connected current after the system is stable, and analyze the content of current harmonics using FFT, as shown in Figure 3.
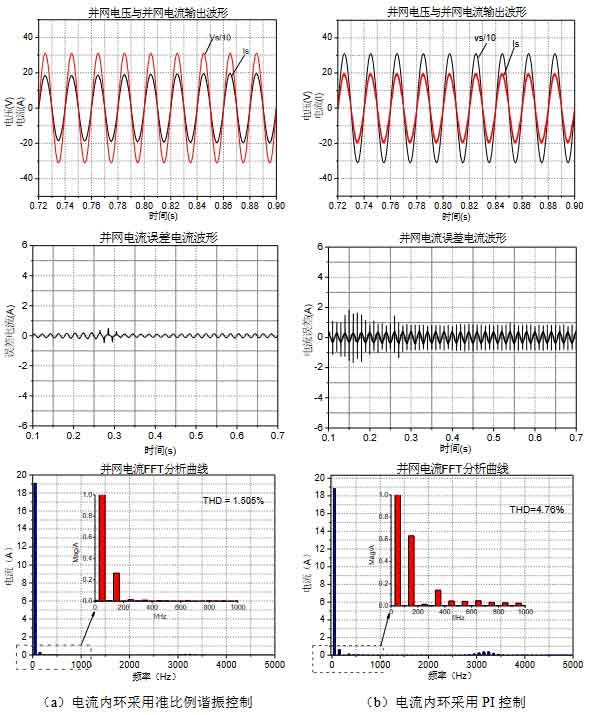
As shown in Figure 3(a) and Figure 3(b), the current loop can ensure good sinusoidal output current when using quasi-proportional resonance control and PI control, and can follow the frequency and phase of the grid voltage to achieve unit power output.The current error waveform shows that the output error of QPR control is approximately 0, while PI control always has an error of ±0.5A. The FFT analysis results show that the harmonic content of the quasi-proportional resonance controller is 1.505%, mainly concentrated in the third harmonic, with low harmonic content and good current quality, while the PI control has a harmonic content of 4.76%. The simulation results show that the former is significantly better than the latter in terms of output current quality and system steady-state performance.Simulation conclusion: the use of quasi-proportional resonance controller can eliminate static errors and achieve good dynamic performance.Using a voltage and current double closed-loop control strategy, the output grid current and grid voltage maintain consistency in amplitude and phase, resulting in high quality output current, achieving full conversion of solar cell energy into active power.This is consistent with the theoretical analysis in Chapter 2.
3.2 Control effect of bus voltage
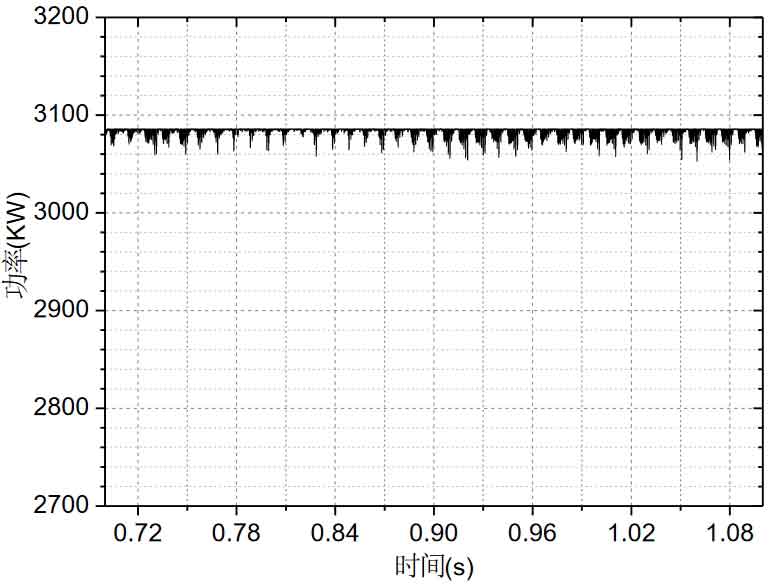
The control objective of bus voltage is to minimize the 100Hz fluctuation of bus voltage caused by the fluctuation of inverter power, thereby reducing the impact of bus voltage fluctuation on maximum power point tracking.Design simulation experiment: bus voltage is given as 370V, decoupling capacitor on the DC side is set as 2000uF, solar cell output power is 3080KW, and the variable step MPPT algorithm proposed previously is adopted. The solar inverter is connected to the grid.The simulation output waveform of bus voltage is shown in Figure 4, and the output power of solar cell is shown in Figure 5.
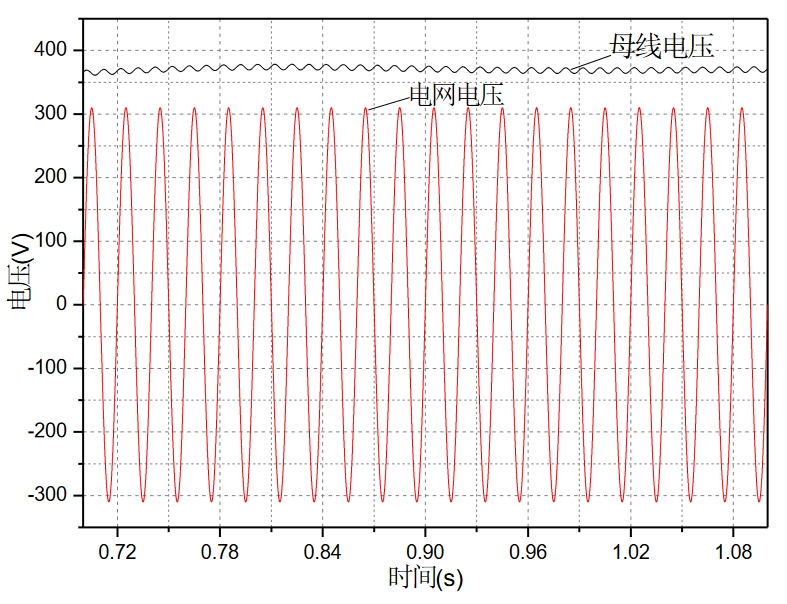
As shown in Figure 4, the bus voltage is stable at around 370V, although there is a 100Hz fluctuation, the amplitude fluctuation is small, and the DC capacitor achieves two-stage power decoupling before and after.As shown in Figure 5, although the fluctuation of the bus voltage causes the output power fluctuation of the solar cell to be larger than when the solar inverter is not connected to the grid, the output power is always around 3080KW, and the maximum power point tracking efficiency is still above 99%, meeting the design requirements.
Simulation conclusion: The bus capacitor can buffer the input and output power, achieve power decoupling at the DC/DC and DC/AC levels, and reduce the impact of bus voltage fluctuations on maximum power tracking.Through the control strategy, a stable bus voltage can be obtained, and the solar cell output efficiency is high, proving the correctness of the theoretical analysis.
4. Reactive power compensation simulation under different light intensities
After analyzing the implementation of a single-phase solar inverter with reactive power compensation, it is found that the reactive power compensation of solar inverters at the load of the feeder can improve the power quality of the grid and optimize the performance of solar inverters.When the light intensity is different, the power output of solar cells is different, which affects the working state of solar inverters.In order to verify the theoretical analysis, a simulation experiment is designed: the magnitude of the load with impedance and resistance at the common coupling point of the grid is simulated as ZL = 26.94 + j5.5, and the given light intensities are 1000W/m2 and 10W/m2, respectively. The proposed control strategy is used to study the reactive power compensation effect under different light intensities.
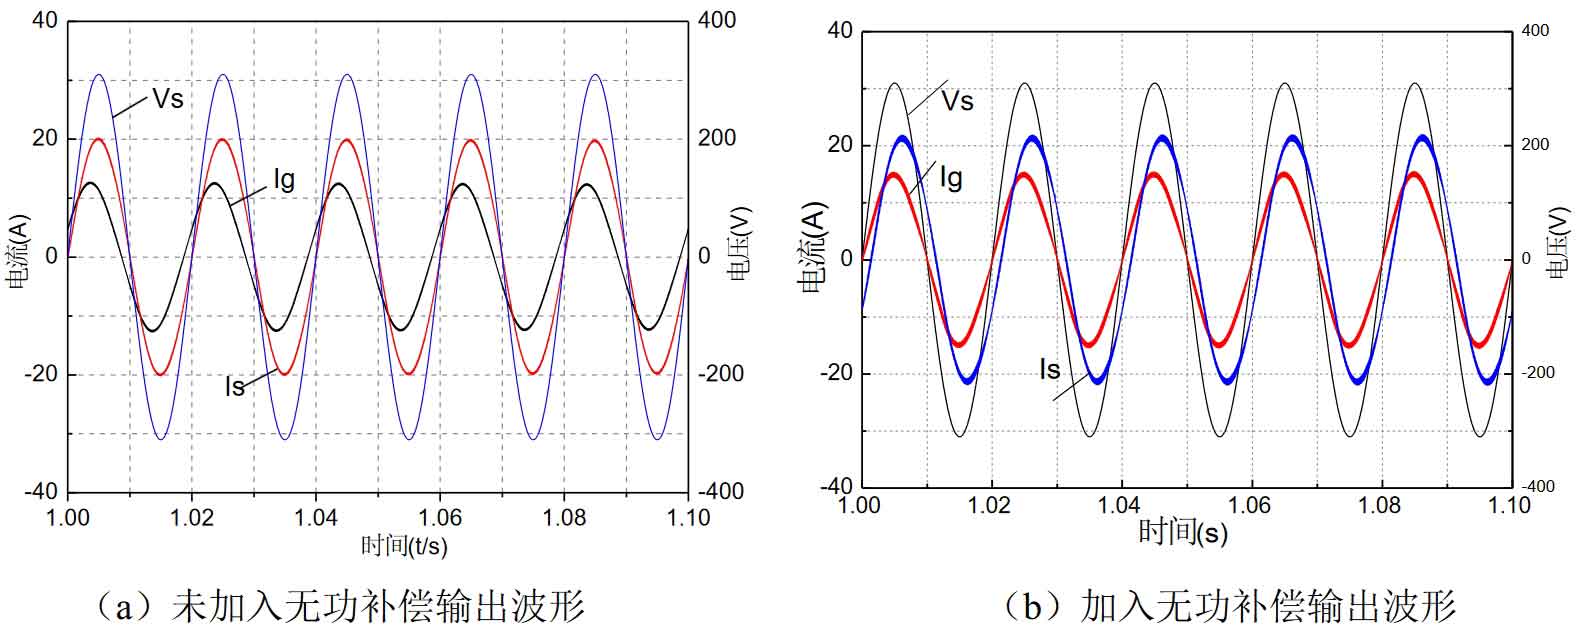
Figure 6(a) shows the waveform diagram of the system with a resistive load before reactive power compensation when the light intensity is 1000W/m2. The grid AC current is represented by Ig, the grid voltage is represented by Vs, and the solar inverter output current is represented by Is. It can be seen that due to the presence of reactive load (resistive load), the power factor of the system output is very low.Figure 8(b) shows the output waveform after adding reactive power compensation. The figure shows that the frequency and phase of the grid current and grid voltage are the same, and the solar inverter output current lags behind the grid voltage by an angle.It can be concluded that when the sunlight illumination intensity is high, the solar inverter can fully compensate for the reactive load of the load, and the remaining electric energy will be converted into active power and fed back to the grid.Through the FFT analysis of the simulation software, the THD size of the grid current is 2.168%, which meets the grid connection requirements.
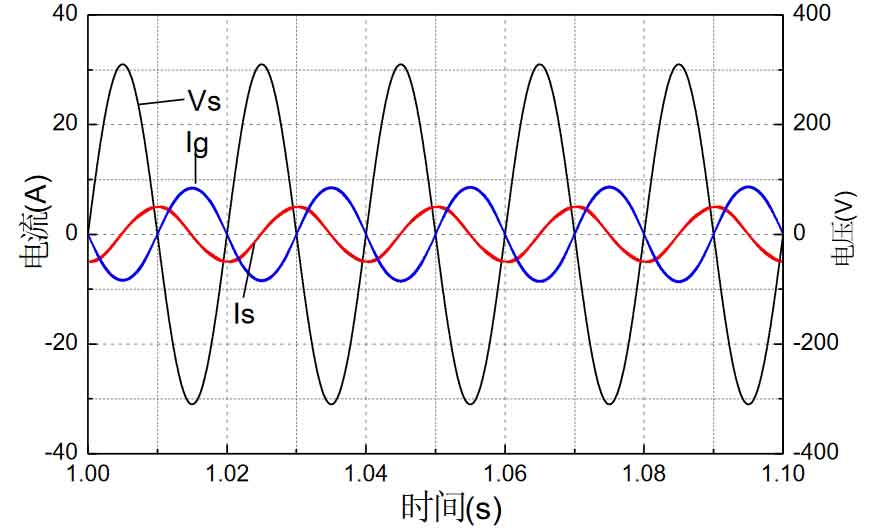
Figure 7 shows the system output waveform at low light intensity (10W/m2).The grid AC current is represented by Ig, the grid voltage is represented by Vs, and the solar inverter output current is represented by Is. From the figure, it can be seen that the solar inverter output current lags behind the grid voltage by 90 degrees, and the frequency of the grid voltage and grid current are the same but the phase difference is 180 degrees.Therefore, it can be concluded that when the sunlight illumination intensity is low, the energy output by the solar inverter is used to compensate for all the reactive power of the load, and the reactive power consumed by the load is all provided by the grid.Through FFT analysis of the simulation software, the THD of the grid current is 2.693%, which meets the grid connection requirements.
Simulation conclusion: Under different light intensities, the solar inverter can effectively compensate for the reactive power of the load through the reactive power compensation algorithm proposed in Chapter 3, improving the power quality of the grid and verifying the correctness of the theoretical analysis.However, it can be seen from the simulation that when the solar inverter performs reactive power compensation, its output current will increase compared to the original base. It is necessary to compensate for the reactive power within the range that the inverter can withstand, to avoid overcurrent damage to the inverter.
5. Summary
The following verification was conducted on the simulation platform built using the saber simulation software:
(1) Simulation research on maximum power tracking algorithm.Construct a solar panel model to verify the maximum power point tracking algorithm, and compare the start-up speed, adjustment speed, stability, and tracking efficiency of the improved maximum power point tracking algorithm before and after improvement, proving that the improved maximum power point algorithm is more effective.
(2) Simulation research on active control strategies for solar inverters.Construct a comprehensive model of a single-phase solar inverter system, and verify the effectiveness of dual-loop control when the voltage outer loop uses PI control and the current inner loop uses quasi-proportional resonance control, including output power factor, quality of grid-connected current, performance against grid disturbances, stability of bus voltage, and MPPT efficiency.
(3) Simulation research on reactive power compensation of single-phase solar inverters.Simulate the situation with inductive loads, verify the effect of reactive power compensation of solar inverters under different lighting conditions, and prove the feasibility of theoretical analysis.