
1. Software development environment
The development software used in this design is CCS (code composer studio), a professional development software for TMS320 series DSPs. Its main features are as follows:
(1) It can be used to write C, assembly, cmd files, etc. through its visual code editing interface;
(2) Integrate code generation tools such as assemblers, optimized C compilers, and linkers to complete functions such as code editing, compiling, linking, and debugging;
(3) The data can be displayed graphically and automatically refreshed;
(4) It can set hardware breakpoints, software breakpoints, and conditional breakpoints during the debugging process;
(5) Supports simultaneous debugging of multiple DSPs;
(6) Capable of analyzing simulators and emulators, simulating the functions of monitoring software, and evaluating code execution clock;
(7) During the generation of target programs and libraries, establish different levels of tracking information to classify and manage different programs.
2. Basic functions of software
According to the design requirements of the household solar off-grid inverter system, two DSPs are used to achieve the control of the charging circuit and the control of the full-bridge inverter circuit.DSP1 determines the battery charging mode and the solar cell MPPT control according to the battery charging current, voltage, solar cell output voltage, and inverter circuit output power.DSP2 controls the inverter circuit output and determines whether the inverter circuit can work based on the operating status of the household solar off-grid inverter system.
3. Design of DSP1 program flowchart
Figure 1 is the main flowchart of DSP1, which is the inverter control chip. When the inverter circuit needs to work, if there is no fault signal in the household solar off-grid inverter system, check whether the voltage across the battery terminals is higher than the minimum allowable discharge voltage. If it meets the requirement, the inverter circuit will work, otherwise it will be disabled.

4. DSP2 program flowchart design
4.1 Maximum power tracking of solar cells
Solar cells have a unique maximum power output point under any environmental condition, and it is necessary to track and control the working state of solar cells to ensure that they always operate at the maximum power output point and maximize their utilization efficiency, which is known as Maximum Power Point Tracking (MPPT).Some classic and practical MPPT control algorithms include: ① disturbance observation method; ②constant voltage method;and ③ conductance increment method.
4.2 MPPT implementation principle
MPPT is achieved by continuously sampling the output voltage and current of the solar cell, transmitting the real-time data to the control chip, calculating the output power value at that moment, saving it, comparing it with the output power calculated by the sampling signal next time, and determining the change trend of the output power based on the difference between the two power values. The control direction of the next household solar off-grid inverter system is determined. By continuously changing the output state of the solar cell, until the output power reaches the maximum value or fluctuates within a small range around it, it is the maximum power output point under this environment.
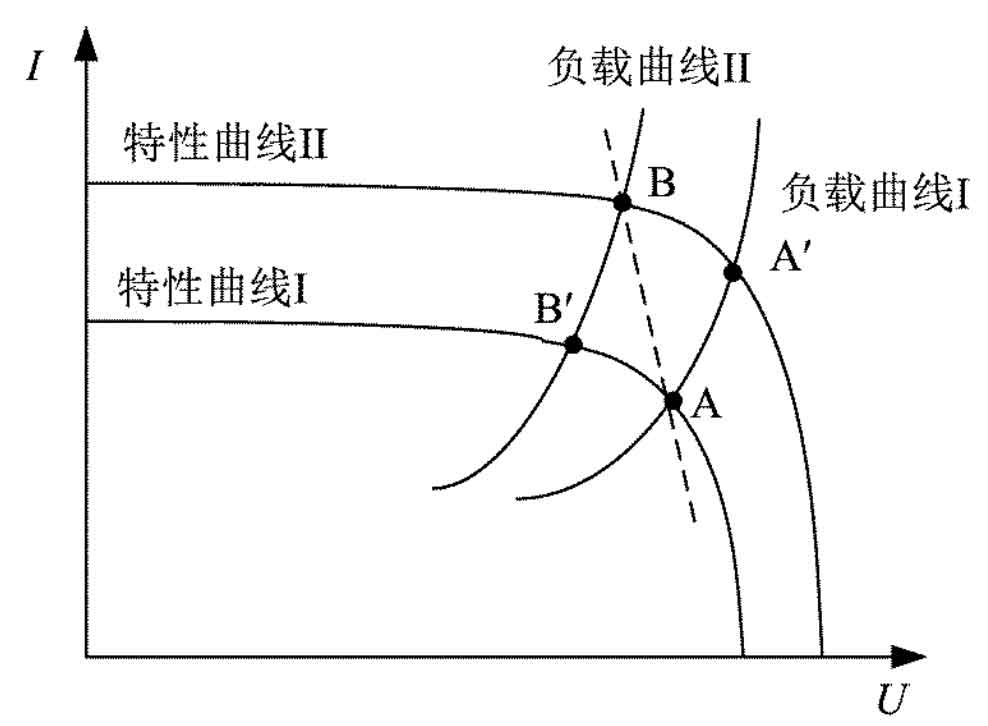
Figure 2 illustrates the working principle of MPPT by taking the I-U characteristic curves under two different light conditions as an example. When the solar panel is in a certain light condition and the output state is characteristic curve I, the solar cell operates at the maximum power point A, which corresponds to load curve I. When the light intensity is increased, the output of the solar panel changes to characteristic curve II, which intersects with the load curve at point A’, that is, the solar cell operates at point A’, rather than at the maximum power output point B of characteristic curve II.Similarly, when the solar panel begins to output characteristic curve II and operate at the maximum power point B, when the light intensity decreases to output characteristic curve I, it will operate at point B’, which also deviates from the maximum power point.Therefore, it is necessary to constantly change the load characteristics of the household solar off-grid inverter system to cope with changes in the maximum power point caused by external environmental changes.
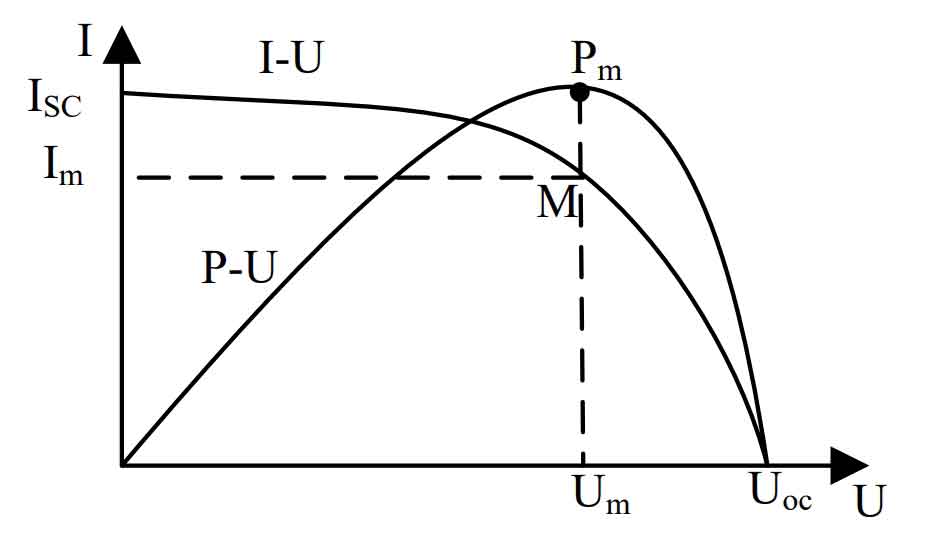
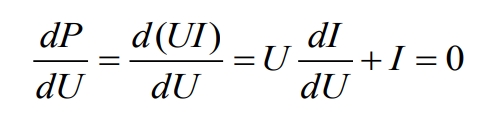
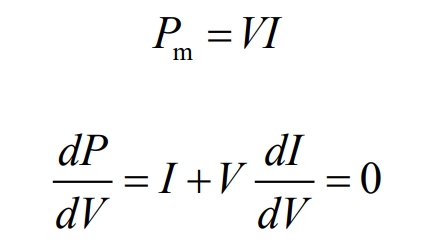
Figure 3 shows the P-U and I-U curves of a solar cell. When the solar cell is outputting at point M, the maximum output power is Pm, and the corresponding output current and voltage are Im and Um. This is where we need to control the operating point of the solar panel.It is difficult to determine point M through the output I-U curve, but point Pm can be determined through geometric methods. Because point Pm is the only extreme point of the P-U curve, we can determine point M by finding the point where the power change rate is 0, which is:
Simplifying:
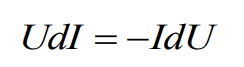
Many MPPT implementation methods are designed based on formulas as the starting point of thinking.
4.3 MPPT control method
The effectiveness of MPPT implementation directly affects the output efficiency of solar panels. Therefore, there has been increasing research on MPPT to minimize the cost of solar cells required for unit output power. Existing MPPT control algorithms have their own advantages and disadvantages.We can choose according to our needs in use, or improve existing algorithms to meet our needs.Here we analyze three classic algorithms.
(1) Constant voltage method
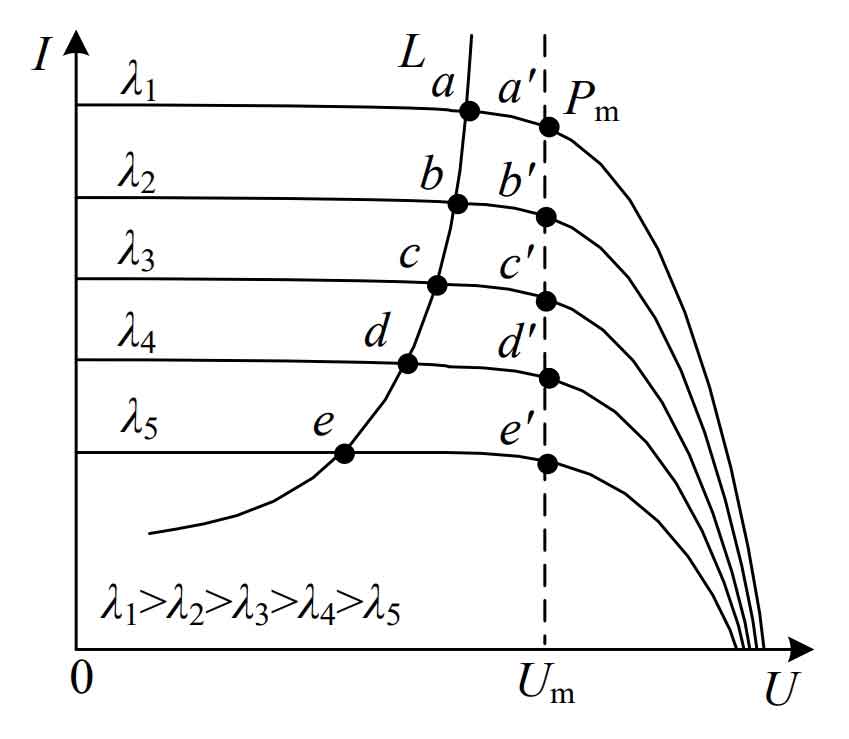
Constant voltage tracking has been designed and applied for a long time. Its main idea is that when the light intensity is high, the maximum power output point voltage of solar cells is basically in a very small voltage range (0.71-0.78 times of the open circuit voltage), so the maximum power output can be obtained by controlling the output voltage.Figure 4 is the I-U curve of solar cells under the same ambient temperature but varying light intensity. The corresponding maximum power output points are a’, b’, c’, d’, e’, which correspond to output voltage values near Um. When the load characteristic is represented by curve L, the intersection points a, b, c, d, e of L and the I-U curve under different light intensities all deviate from the corresponding maximum power point.If the solar cell operates under this state, its output efficiency is low, resulting in power loss.By changing the impedance characteristics of the load, the solar cell output voltage can be operated at Um, that is, the solar cell operates near the maximum power point, resulting in an increase in the output power of the solar cell. This method is called constant voltage method.This method is relatively easy to implement, stable to operate, and has high reliability, but it does not consider the impact of ambient temperature on solar cell output, resulting in an inability to accurately control the solar cell output at the maximum power point.
(2) Disturbance observation method
The Perturbation and Observation Algorithm is the best method for implementing MPPT in the current generation. This method has good real-time performance.Since the Perturbation and Observation Algorithm was designed and applied by American scientists Z. Salameh, W. A. Lynch, F. Dagher, and others, people have continuously improved it, and many design schemes have been proposed based on it.
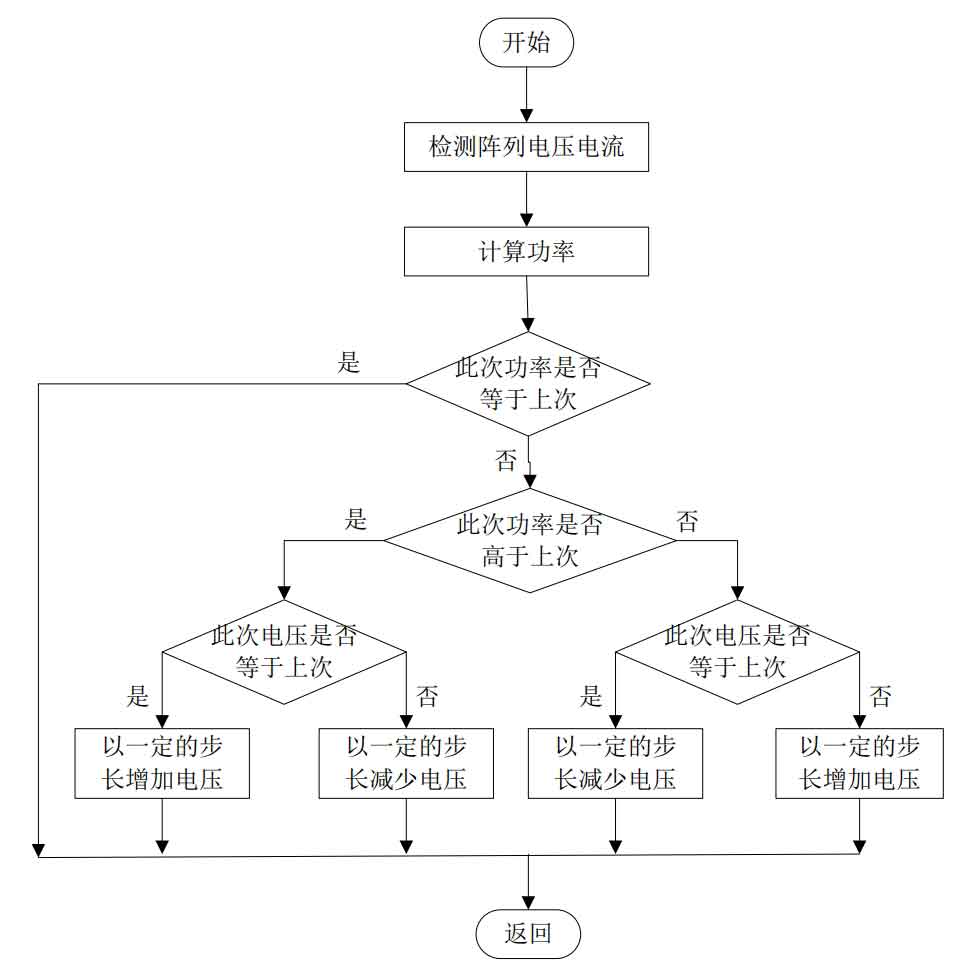
The principle of the disturbance observation method is shown in Figure 5: When the solar cell is working, the output power at that moment is calculated by detecting the output voltage and current, and stored in the processor. Then, the load of the solar cell is changed, so that the output voltage will have a corresponding change. The output power at that moment is calculated based on the detected output voltage and current at that moment.By comparing the output power at that moment with the previously stored power, it is determined whether the output power has increased.If the output power has increased, the load direction is continued to change according to the previous change direction;if the output power has decreased compared to the previous output power, the load size is changed in the opposite direction.Repeatedly changing the load size until the output power reaches the maximum and stabilizes near the maximum power point.
(3) Conductance increment method
At the maximum power point of solar energy, its output characteristics can be expressed by a formula:
The conductance increment method is designed based on the idea that the power change rate at the maximum power point of the solar cell is 0.
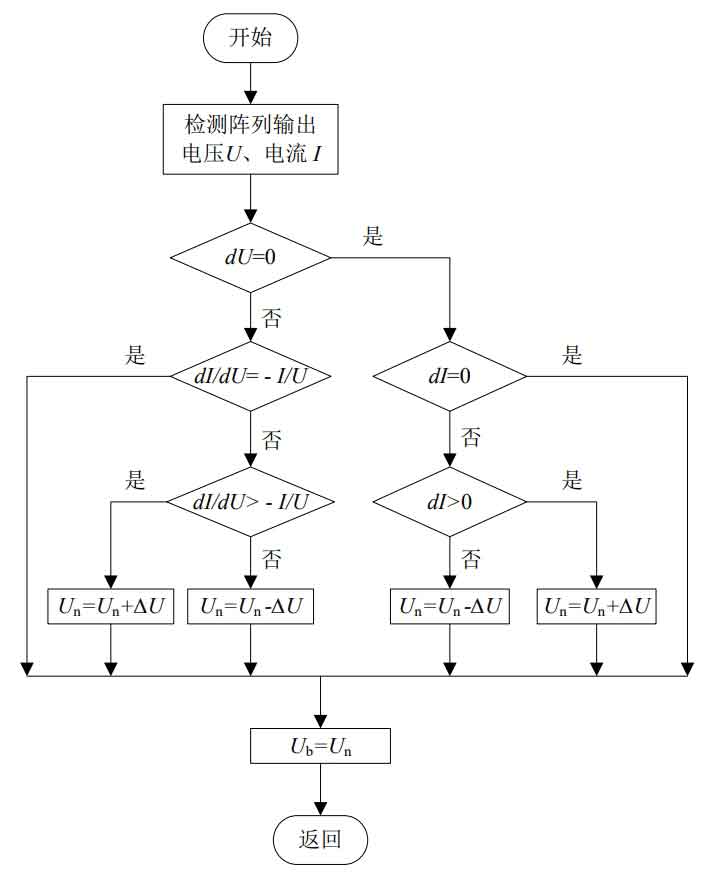
By comparing I+V dl/dV with 0, we can determine the positional relationship between the operating point and the maximum power point of the solar cell at this time, and decide which direction to change the output voltage of the solar cell. The criterion is:
(1) If I+V dI/dV > 0, the output voltage increases by ΔU;
(2) If I+V dI/dV < 0, the output voltage decreases by ΔU;
(3) If I+V dI/dV = 0, the output voltage remains unchanged.
Where ΔU is the magnitude of each voltage change, and Figure 6 is the control flowchart of the conductance incremental method.
The conductance incremental method has good control performance and can better control the solar cell to operate at the maximum power point, with a small voltage disturbance range and high operational stability of the household solar off-grid inverter system. However, it requires a complex control algorithm and is difficult to design.
4.4 Proposed disturbance observation method to prevent “misjudgment”
The design of the disturbance observation method is not complicated, the control idea is relatively clear, the measured parameters are few, and it is relatively easy to implement, so it is widely used.However, due to the fact that the change in the output power of solar cells is not only affected by the load resistance, but also by the ambient temperature and light intensity, this method is prone to “misjudgment”. If a “misjudgment” occurs, it may lead to the disturbance changing the load resistance in the opposite direction, resulting in a slowdown in the maximum power tracking speed and power loss.
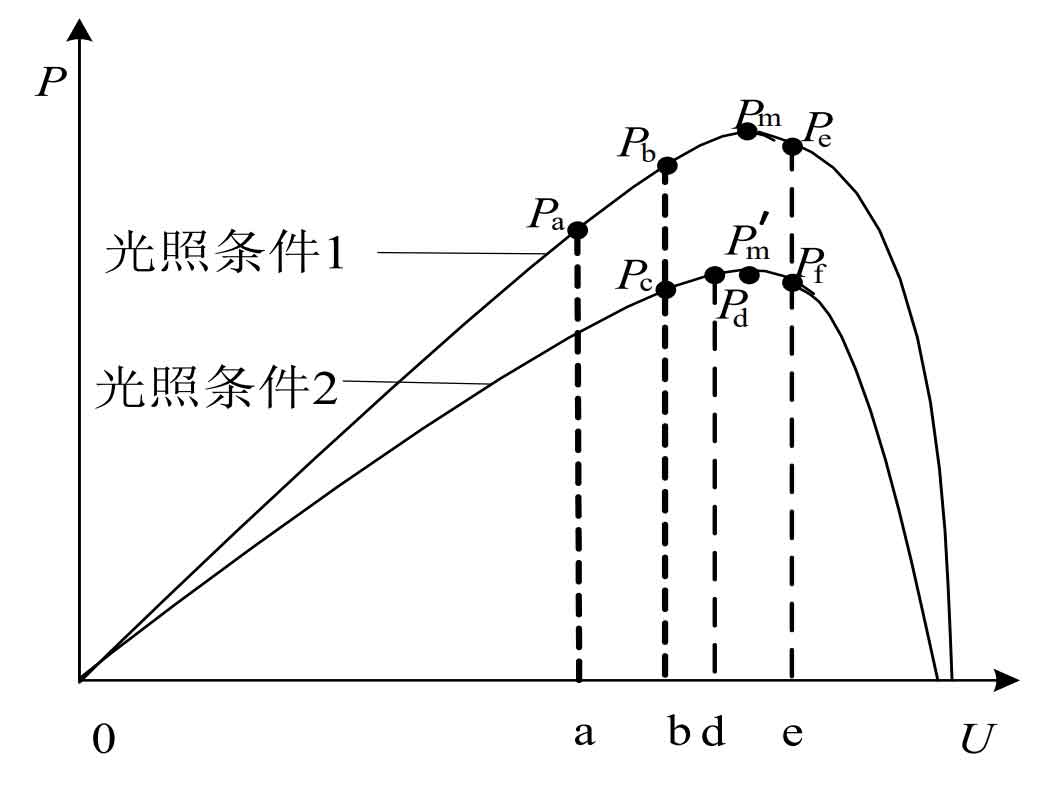
The mechanism of the “false judgment” phenomenon can be explained in detail through Figure 7: This figure is the P-U curve of the solar cell under light condition 1 and light condition 2. In the case of light condition 1, when the solar cell is working at point a, a disturbance is given to the load. At this time, the solar cell is working at point b. If the external environment does not change, the detected powers are Pb>Pa, and the direction of the disturbance is correct.If the light intensity drops to light condition 2 at this moment, resulting in a decrease in output power to Pc, it will be “false judged” as the direction of the disturbance is incorrect.If the light intensity continues to decrease, the household solar off-grid inverter system will continue to disturb in the wrong direction until the solar cell working point moves left to stop working;Similarly, when the solar cell is working at point d near the maximum power point of illumination condition 2, if a disturbance is applied to the load, and the illumination intensity remains unchanged, the solar cell will work at point e, where Pd>Pf. If during this process, the illumination intensity changes to illumination condition 1, the detected output power will be Pe, which will result in a “false positive”. If the illumination intensity continues to increase, it will cause the household solar off-grid inverter system to continue to be perturbed to the right until it stops working.
The disturbance observation method proposes that the household solar off-grid inverter system is prone to “misjudgment” under the influence of external environment, resulting in the household solar off-grid inverter system undergoing disturbances in the wrong direction under continuous environmental changes, slowing down tracking speed and causing power loss.The disturbance observation method for preventing “misjudgment” is to prevent the solar cell from continuously deviating from the maximum power point when the environment changes greatly. Figure 8 is a flowchart of the proposed disturbance observation method for preventing “misjudgment”.
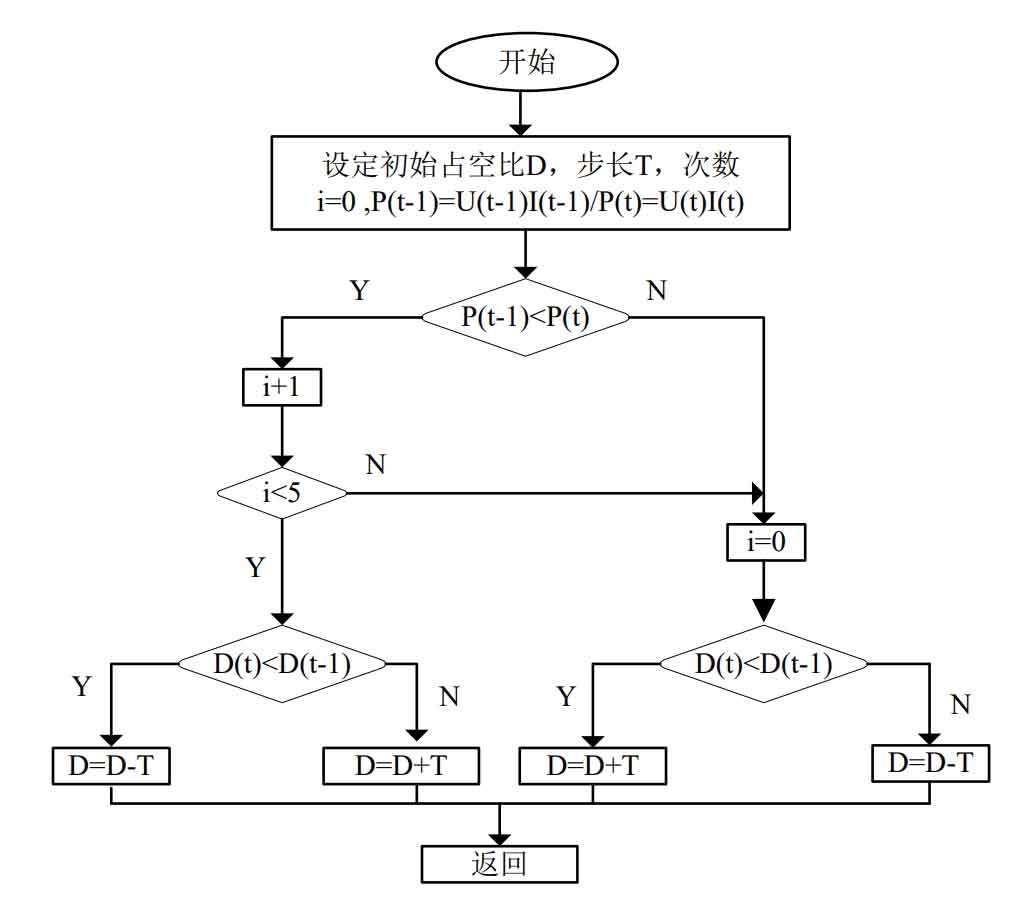
The circuit designed to change the resistive load characteristics is a Buck-type circuit, which is achieved by changing the output duty cycle. The principle is described in detail in Section 2.4.The flowchart shown in Figure 7 is the working principle of preventing “false judgments”: Compared with the unimproved disturbance observation method, after comparing the detected output powers P(t-1) and P(t) before and after the two times, we count the number of comparisons i. When the household solar off-grid inverter system is disturbed in one direction and the output power increases, we add 1 to the number i. When the output power decreases, the number i is reset. When the count reaches 5, that is, when the output power increases continuously in one direction for 5 times, the count is reset. Whenever the number i is reset, the direction of disturbance is reversed and the above control is restarted.Therefore, during the disturbance process, when the output power increases in both directions, the system will operate near the original working point.Assuming that the solar cell output is the characteristic curve I in Figure 2, when operating under the load curve I, if the solar cell is disturbed due to changes in the external environment, which causes the output maximum power point to change, resulting in a “false judgment”, if this method is used for disturbance, the load characteristic curve will change near the curve I without causing continuous disturbance in the wrong direction.
4.5 Lead-acid battery charging
Batteries are an important component of off-grid photovoltaic power generation systems. When using solar cells to charge batteries, if only the maximum output power of solar cells is used to charge the batteries without designing a reasonable charging method, it will damage the internal structure of the batteries and reduce their service life.Below are some common charging methods currently in use, and improvements to these methods are proposed. Combined with maximum power tracking of solar cells, a charging method with MPPT function for batteries is designed.
Common battery charging methods:
(1) Constant current charging method
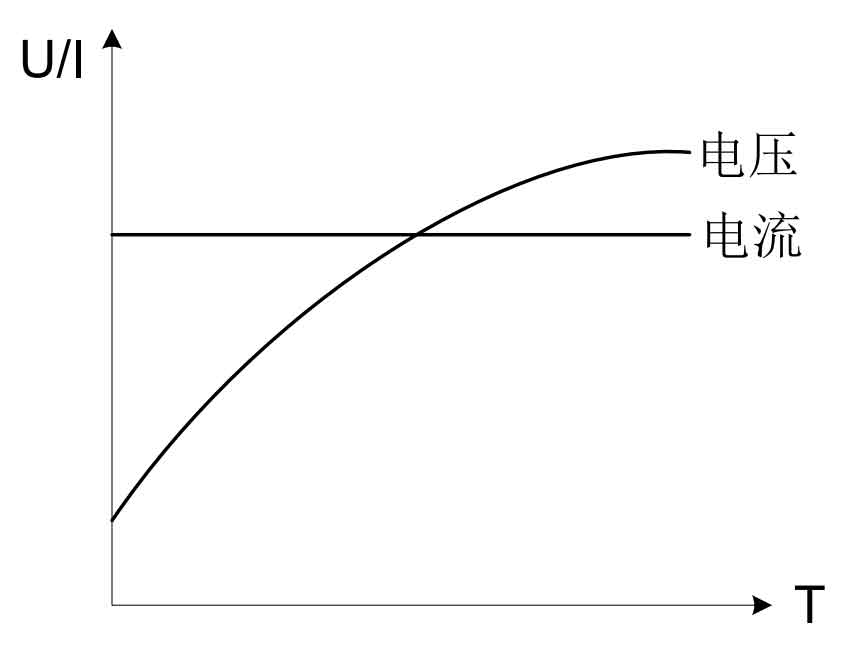
The constant current method for charging batteries requires increasing the charging voltage during the charging process to maintain a constant charging current.During the charging process of the battery, its internal resistance increases continuously, requiring the charger to adjust the charging voltage based on the detected charging current. Therefore, it requires high intelligence of the charger.If the charging current is selected to be the maximum charging current that the battery can withstand, although it can improve the charging rate, if the charging current is not reduced when the battery power reaches a certain level, it will cause a lot of gas to be generated inside the battery, resulting in battery heating, plate deformation, and other hazards, reducing the battery life and greatly limiting the use of this method.Figure 9 is the U/I curve of the constant current charging method.
(2) Constant voltage charging
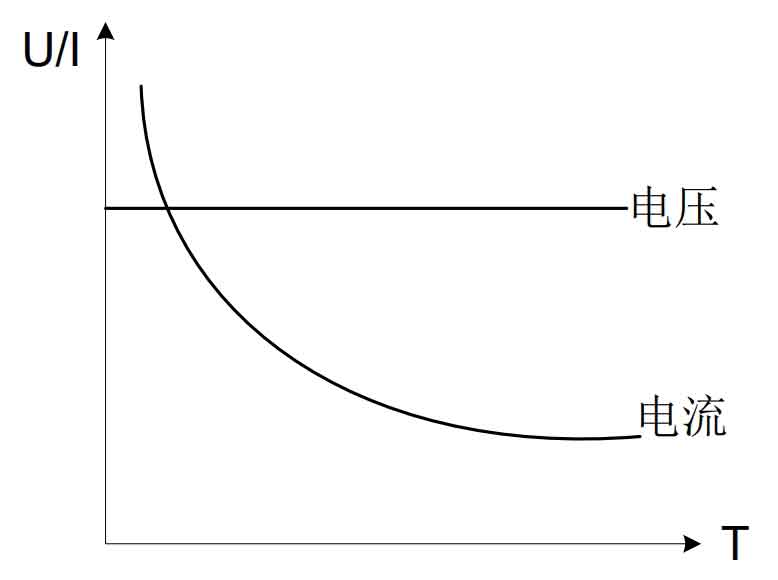
Charging the battery with a constant voltage, the charging current decreases continuously as the charging progresses. This method can generate a large charging current in the early stage due to the low internal resistance of the battery, but the charging current decreases as the battery capacity increases and the internal resistance increases in the later stage. When the battery port voltage reaches the charging voltage, the battery will no longer be charged.Although this method will not damage the battery in the later stage of charging, it may cause damage to the battery in the early stage of charging due to the charging current that may be greater than the maximum charging current that the battery can withstand. Moreover, due to the small charging current in the later stage of charging, the internal chemical reaction of charging and discharging cannot be carried out for a long time, resulting in the continuous decrease of battery capacity.Especially when this method is applied to charge multiple batteries in series, due to the different charging capacities of each battery, the battery with less power will receive very little charging.Figure 10 shows the U/I curve of constant voltage charging.
(3) Multi-stage charging
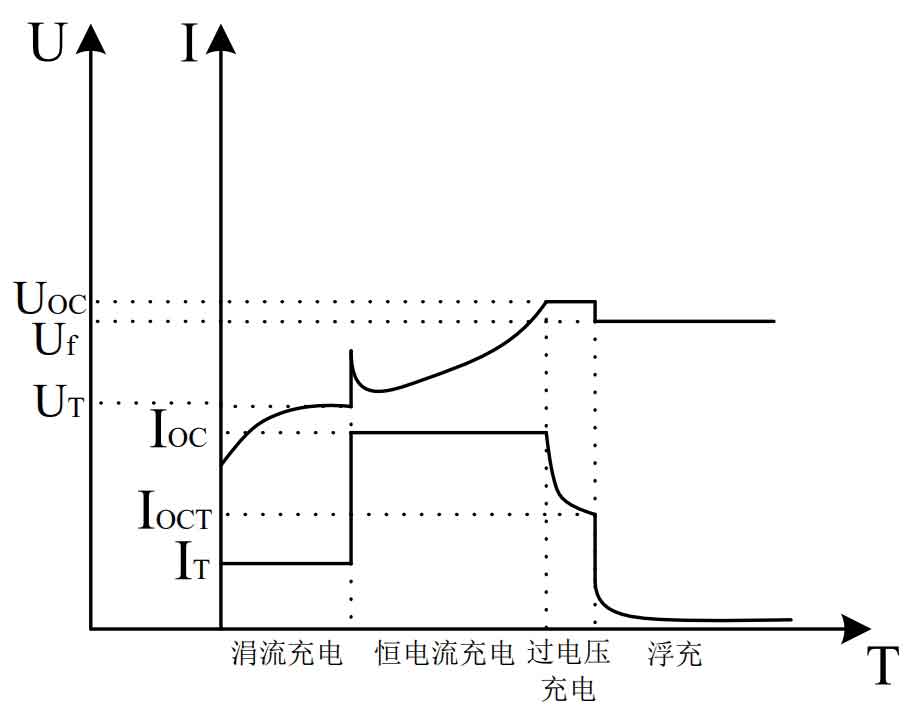
The multi-stage charging method has undergone two, three, and four stages of development, with the basic idea of combining constant current and constant voltage charging to improve the two methods. Two-stage charging uses constant current IOC for charging in the early stages of charging, and when the battery voltage reaches a certain value UOC, it changes to constant voltage charging.Three-stage charging is based on two-stage charging, when the constant voltage charging reduces the charging current to a certain value IOCT, the charging enters the float charging stage, with voltage Uf;Four-stage charging adds trickle charging before the constant current charging stage in the three-stage charging, trickle charging is mainly used when the battery is discharged too much, and the battery port voltage is lower than the minimum discharge voltage. In order to prevent the charging current from exceeding the initial charging current that the battery can withstand, a smaller charging current IT needs to be used to charge the battery until the battery port voltage reaches the enabling voltage UT, and then the constant current charging can be used.Figure 11 shows the U/I curve of four-stage charging.
4.6 Battery charging process
Integrating MPPT into the three-stage charging method to charge the battery. Due to the lead-acid battery pack with a capacity of 24V300AH selected in this article, according to the maximum current acceptable for constant current charging of the battery, which is 0.1C, the charging power can withstand at least 720W. Since the maximum output power of the solar cell is 520W, the MPPT charging of the solar cell is used in the constant current charging stage, and the constant voltage charging and floating charging stages are entered after the constant current charging stage is completed.
4.7 DSP2 main flowchart
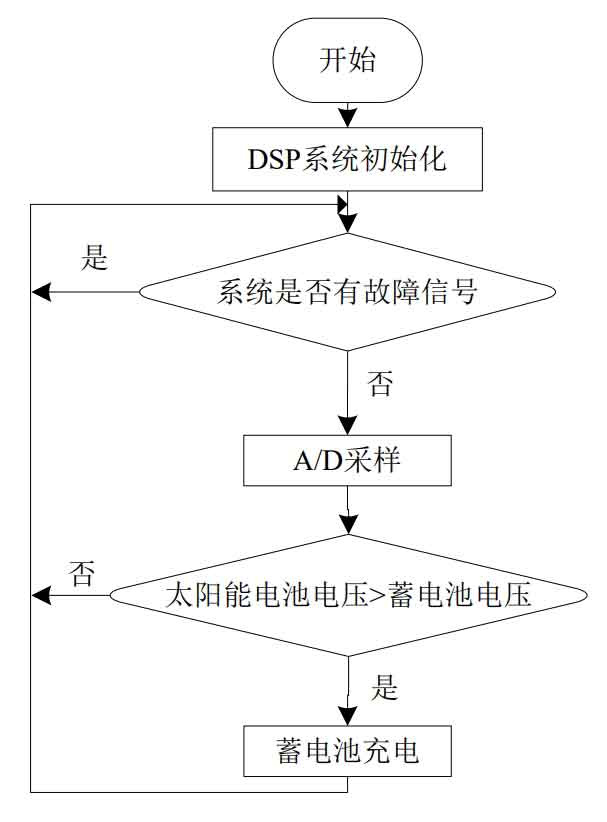
Figure 12 is the main flowchart of the DSP2 program. The DSP2 controls the charging circuit. When it detects that the output voltage of the solar cell is higher than the battery voltage, it starts the battery charging circuit, selects the corresponding charging mode based on the state of the battery’s stored energy, and controls the output of the charging circuit.
4.8 Battery charging flow chart
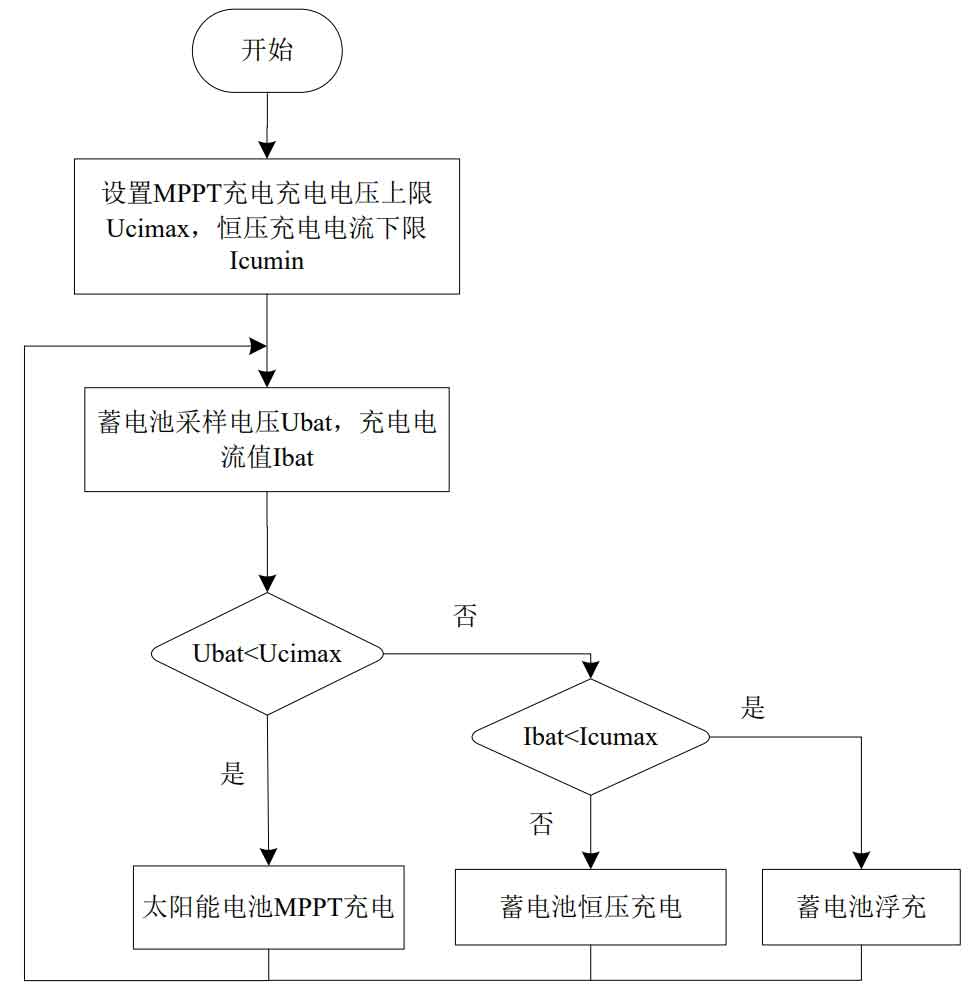
Figure 13 shows the battery charging process. The upper limit of MPPT charging voltage and the lower limit of constant voltage charging current for the battery are preferably set. The battery charging status is determined based on the detected voltage and current of the battery charging, and the battery is charged to ensure optimal charging of the battery and maximum utilization of the solar cell output power.
5. Interrupt flow chart
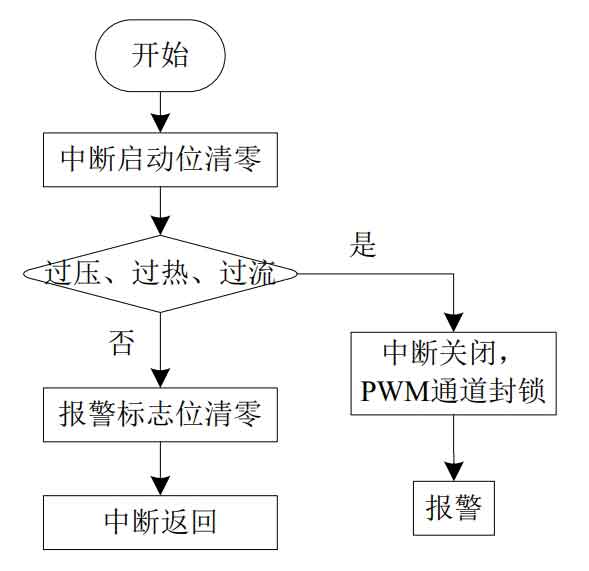
Figure 14 shows that to ensure the safe and stable operation of the household solar off-grid inverter system, when the system fails, such as short circuit, overheating, overvoltage, etc., the control chip will immediately or delay a certain period of time to stop the output of the drive signal according to the fault information, and send an alarm signal until the fault is detected and the system resumes normal operation.
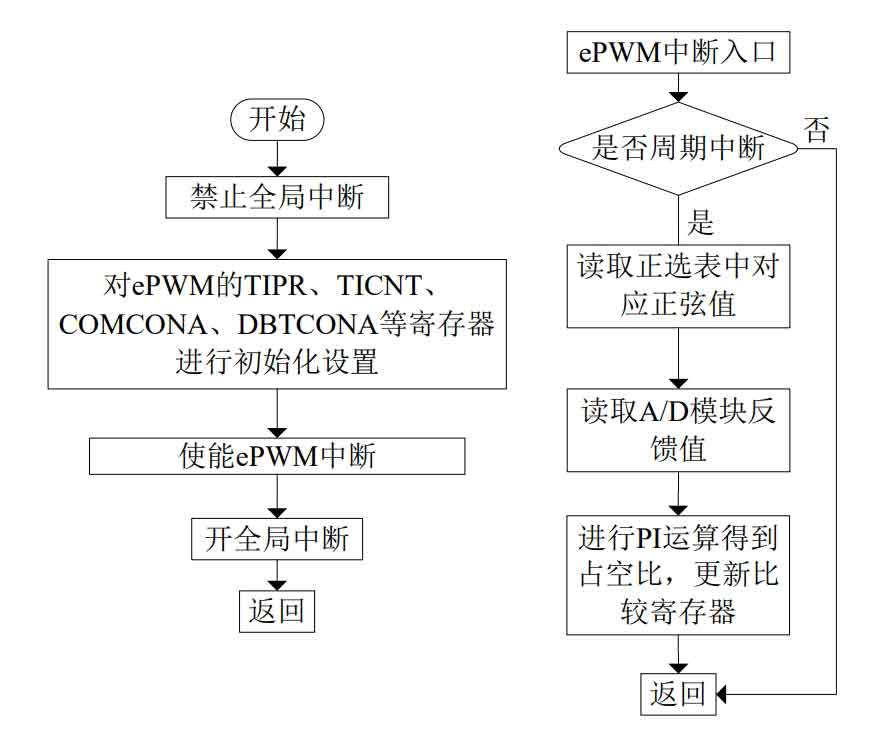
6. SPWM generation flowchart
Figure 15 is a flowchart of SPWM generation. The carrier frequency used to modulate the SPWM waveform is 10KHz. When the DSP internal general timer is set to continuous up/down counting mode, a symmetrical waveform, known as a triangular carrier wave, is generated.By comparing the sine modulation wave stored in the comparison register with the triangular wave, the SPWM wave is modulated.During program execution, the feedback value is compared with the value in the sine table every time an interrupt occurs, and the duty cycle obtained after PI operation is updated to the comparison register to achieve control of the SPWM duty cycle.
7. Summary
Firstly, the software development environment is introduced. According to the control requirements of the household solar off-grid inverter system, the main flowchart, interrupt flowchart, and PWM generation flowchart of DSP1 are given and introduced accordingly.Through research on the maximum power point tracking of solar cells and the charging method of batteries, the main flowchart and battery charging flowchart of DSP2 are designed.