
Facing the goal of “carbon peaking and carbon neutrality”, the form of the power system is gradually transforming, and the characteristics of high power electronics and the proportion of high-tech energy are becoming increasingly evident. Faced with issues such as frequency fluctuations, voltage instability, and insufficient inertia in the “dual high” power grid, there is an urgent need for a large amount of flexible and rapid adjustment resources to maintain stable operation of the power grid. Electrochemical energy storage power plants have the advantages of rapid response, flexibility and controllability, and no geographical constraints, making them one of the important adjustable resources for new power systems.
The imbalance of SOC in the actual operation of energy storage power plants will affect their capacity and power output, and at the same time, the energy efficiency of charging and discharging under non rated conditions will also significantly decrease. To address the issue of SOC inconsistency, optimization is mainly carried out from two aspects: active and passive balancing between battery modules and power distribution between energy storage units. The balance between modules is mainly achieved by consuming high capacity battery energy or exchanging battery energy. The SOC balance problem between energy storage units is mainly optimized through power allocation strategies. Cuiping Li et al. achieved adaptive multi energy storage dynamic power allocation by setting energy storage state partitions. Duan Shuangming et al. proposed a combination of charging and discharging priority sorting and adaptive mutation particle swarm optimization algorithm to improve the SOC consistency of energy storage units. The above studies have all focused on SOC equilibrium as a single optimization objective, without considering the issue of power plant energy efficiency. Under the control of such strategies, the consistency of power plant SOC has been improved, but there are problems such as low energy consumption and poor economic efficiency in power plants. Regarding the calculation and optimization of energy efficiency in energy storage plants, Tian Gangling and others analyzed the energy consumption distribution of energy storage plants and established the optimal power allocation strategy for energy efficiency. Liu Chang and others focused on the high-voltage direct mounted large capacity energy storage system as the research object, established a battery cluster energy utilization model, and optimized the power module number of the high-voltage direct mounted energy storage system with the goal of improving the efficiency and safety of the energy storage system. Existing research often sets the efficiency of converters and batteries as fixed values, or calculates the energy consumption of power plants through the steady-state internal resistance of batteries, without considering the electrochemical characteristics inside energy storage power plants, and neglecting the dynamic characteristics of battery internal resistance under different SOC states, operating times, and other conditions.
This article is based on electrochemical impedance spectroscopy analysis of the ohmic internal resistance and polarization internal resistance of energy storage subsystems, constructing a battery energy consumption model, and studying the energy consumption characteristics of energy storage units and subsystems under different charging and discharging powers. Building a two-layer power allocation strategy architecture based on SOC consistency, including energy storage unit optimization layer and subsystem optimization layer. Establish a double-layer multi-objective optimization model with the goal of SOC equilibrium and optimal energy efficiency, and finally simulate and analyze the actual operating conditions of energy storage power plants.
1.Power allocation strategy framework
The existing large-scale energy storage power plants generally include multiple energy storage units, and each energy storage unit’s low-voltage side is composed of multiple energy storage subsystems in parallel. The energy storage subsystem includes a power conversion system (PCS) and a battery system.
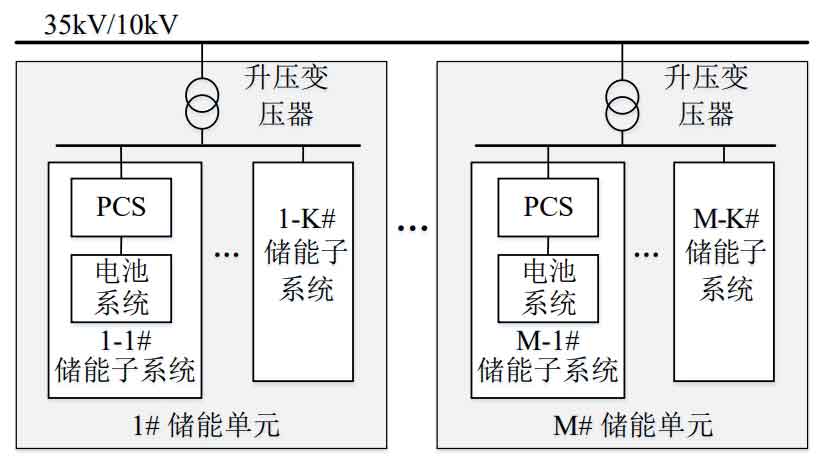
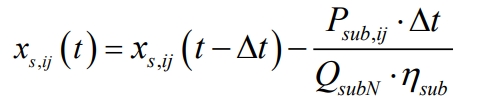
This article conducts research on the power allocation strategy of energy storage power plants under the aforementioned topology, and the proposed power allocation strategy framework is shown in Figure 2.
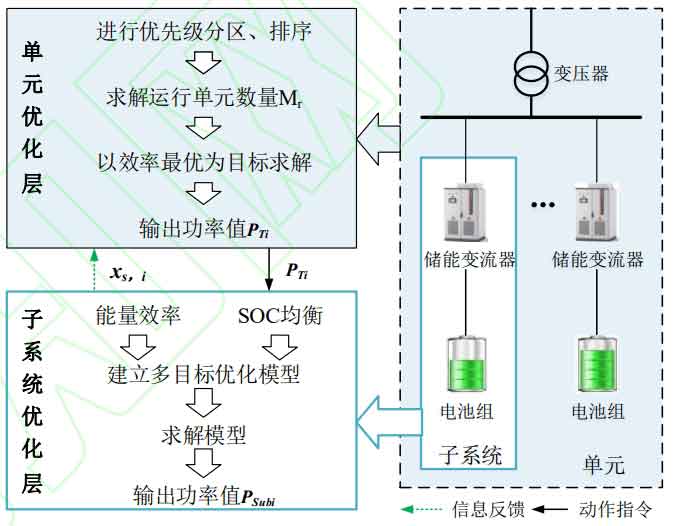
The power allocation strategy includes a unit optimization layer and a subsystem optimization layer. The specific description is as follows: when the power instruction PREF is issued to the power coordinator, the energy storage unit is first divided into charging/discharging priority zones based on the SOC state of the energy storage unit. The optimization model parameters are defined based on the number of zones to obtain the final allocation result of the unit layer. The subsystem optimization layer takes the energy consumption model and SOC equilibrium degree of the energy storage subsystem as the objectives, and introduces the optimization results of the unit layer as constraints to establish a multi-objective optimization model, solving to obtain the power allocation results of each subsystem.
2. Energy consumption characteristics of energy storage power plants
Energy storage power stations are different from other electrical equipment or power generation equipment in the power system. They have multiple dynamic evolution characteristics that intersect electrochemical and electrical aspects, and it is necessary to analyze the factors that affect their operation optimization based on their characteristics. The energy storage unit mainly considers the energy consumption characteristics of the distribution system, with transformers being a sensitive factor in the distribution system. This article will use transformer losses to equivalent distribution losses. Transformer losses are mainly divided into load losses and no-load losses, with load rate as the main influencing factor. This article applies the existing transformer efficiency function for subsequent calculations.
The energy consumption of the energy storage subsystem mainly includes the energy consumption of the battery pack, PCS, and battery energy management system. The energy consumption of the battery management system is about a fixed value and accounts for a relatively small proportion. This article mainly considers the energy consumption of the battery pack and PCS. The energy consumption of a battery pack is mainly generated by internal resistance, which generally includes ohmic internal resistance, electrochemical polarization internal resistance, concentration polarization internal resistance, etc. Conduct battery AC impedance experiments on 280A ∙ h lithium battery cells using an electrochemical workstation, and conduct three tests under the same experimental conditions, with a testing frequency range of 1MHz to 10 μ Hz, the electrochemical impedance spectra of the polarization internal resistance of the battery under different states are shown in Figure 3.
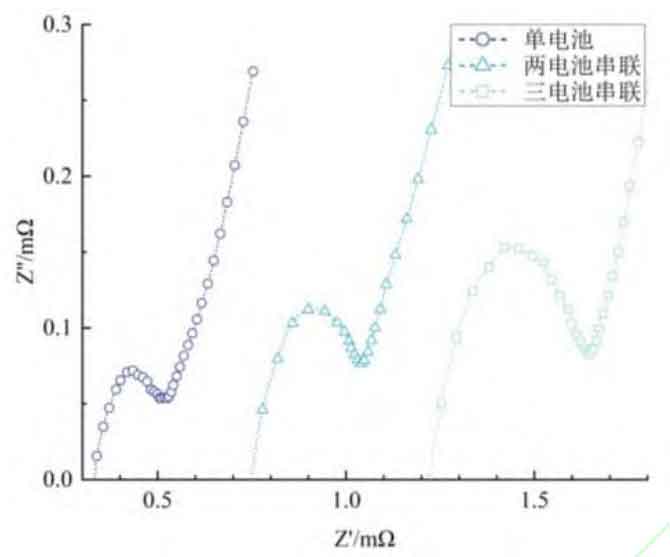
The intersection point between the measured curve and the real axis in the electrochemical impedance spectrum is the Ohmic internal resistance of the battery. Figure 3 shows that the Ohmic internal resistance of the battery gradually increases, and the semicircle radius in the curve is the size of the polarization internal resistance. Figure 3 shows that the polarization internal resistance increases with the increase of the number of series connections.
| Battery status | Conditions | Polarization internal resistance/m Ω maximum value | Polarization internal resistance/m Ω minimum value | Polarization internal resistance/m Ω average value |
| Quiet | Single battery | 0.254 | 0.230 | 0.245 |
| Quiet | Two single batteries in series | 0.416 | 0.396 | 0.404 |
| Quiet | Three single batteries in series | 0.649 | 0.635 | 0.641 |
| Work | Single battery SOC is 0-10% | 0.169 | 0.157 | 0.163 |
| Work | Single battery SOC is 10% -90% | 0.401 | 0.389 | 0.396 |
| Work | Single battery SOC is 90% -100% | 0.700 | 0.689 | 0.693 |
Polarization internal resistance includes electrochemical polarization internal resistance and concentration polarization internal resistance. The impedance spectrum obtained from the test was analyzed using Zview software for the evolution law of polarization internal resistance. The fitting results are shown in Table 1. The results show that the electrochemical polarization internal resistance decreases with the increase of SOC. When SOC is in the range of 10% -90%, concentration polarization is less affected by SOC. In this article, the two are added and analyzed, except for SOC in the range of 0-10% and 90% -100%, The overall variation of polarization internal resistance is relatively small, fluctuating slightly around 0.396m Ω. When the battery is charged, the evolution characteristics of polarization resistance are basically the same as during discharge. The internal electrochemical reaction process during battery charging and discharging is opposite, and changes in battery operating state also have an impact on polarization resistance. Therefore, in the battery energy consumption model, correction factors such as battery series connection, SOC state, and working time need to be added. n batteries are connected in series to form a battery string, and m batteries are connected in series to form a battery system. The power loss and efficiency of the battery system are calculated as shown in equation.
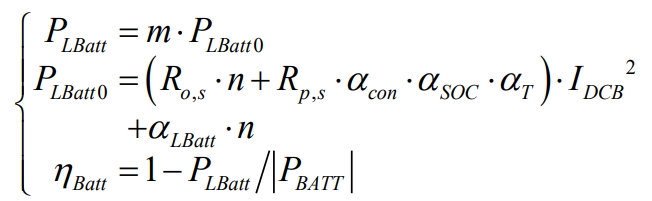
In the formula: m is the number of parallel battery strings in the battery system, n is the number of individual batteries in the battery string, Ro s, Rp s, respectively, are the Ohmic and Polarizing Internal Resistance of the individual batteries, and IDCB is the current value flowing through the battery strings in the subsystem, α LBatt is the loss of the battery when the current flowing through it is 0, α Con is the correction factor for the composition of the battery string, α SOC is the correction factor for the SOC state of the battery. Based on experimental data, when the SOC exceeds 90% during battery charging or is lower than 10% during discharge, the corresponding amplification factor is taken. According to actual data, 1.75 is taken in the text; α T is the correction coefficient for the working state of the battery. When the charging state of the battery is the same at the previous time, it is taken as 1.05, and when it is the opposite, it is taken as 0.95; η BATT is the efficiency of the battery system, and PBATT is the output power value of the battery system.
The power loss and efficiency model of the battery system in the article was validated using test data of a 10kV level energy storage unit in a certain region. The capacity of the energy storage unit is 630kW/1428kWh, and the battery system consists of 6 clusters of 240 series and 2 parallel battery clusters. Test the power transmission under different load rates (0, 20%, 40%, 60%, 80%, 100%) using a power analyzer and current clamp. Evaluate the model based on the test data and corresponding recorded data in the battery management system. The validation results are shown in Figure 4, and the model accuracy is described using R2 and MAPE.
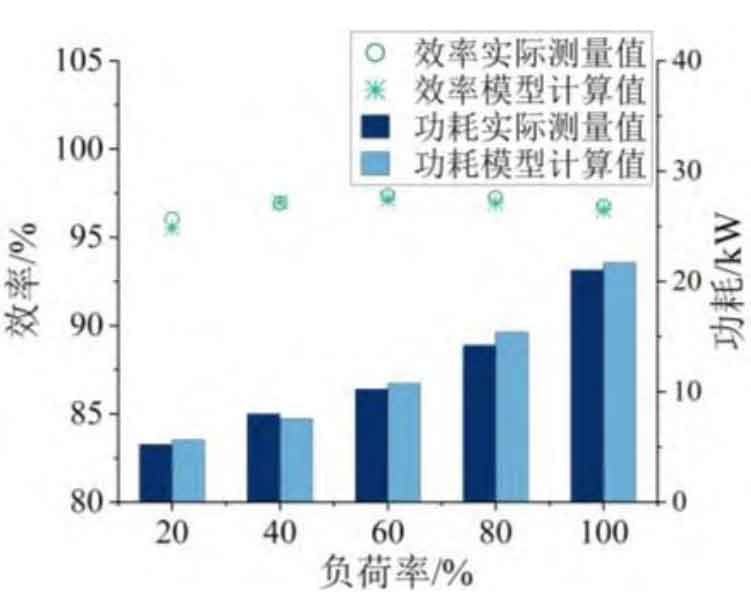
The power loss of the battery system gradually increases with the load rate, and the efficiency characteristics show a distribution pattern of first increasing and then slowly decreasing. The model calculation data and test data show consistent power loss and efficiency characteristics. The evaluation indicators for power loss and efficiency of the battery system were calculated separately, with R square greater than 0.99 and MAPE of 3, 57% and 0.23%, respectively.
The above results indicate that the proposed model can accurately describe the power loss and efficiency characteristics of the battery system in the full load rate range. PCS energy consumption mainly includes switch losses in the converter, filter inductance and capacitor losses, etc. The efficiency of the energy storage subsystem is calculated by multiplying the efficiency of the battery and PCS using the DC side current and load rate, as shown in the formula.
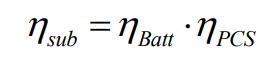
In the equation: β Sub is the load rate of the energy storage subsystem, which is the ratio of actual output power to rated power; η PCS η Sub refers to the efficiency of PCS and energy storage subsystems.
3. Double layer allocation strategy
The double-layer multi-objective allocation strategy framework for energy storage power plants is shown in Figure 2, which includes a unit optimization layer and a subsystem optimization layer. Energy efficiency optimization is achieved simultaneously in the energy storage unit and subsystem, and SOC balancing is achieved through priority partitioning in the energy storage unit layer to select charging and discharging units. Among them, units with higher SOC discharge first, and units with lower SOC charge first. Implemented in the optimization solution at the subsystem level, where each subsystem is set with upper and lower limits for operation based on SOC, that is, charging is prohibited when SOC exceeds 90%, and discharging is prohibited when SOC is below 10%.
3.1 Unit optimization layer
The unit optimization layer is a single objective optimization layer that considers the energy efficiency of energy storage units. Currently, the transformer model parameters configured in energy storage power plants are consistent, so their transformer efficiency will show similar or even the same situation. Based on this situation, this article adds preprocessing steps for unit SOC state partitioning to achieve a certain degree of SOC equilibrium for the operating power plant while meeting the optimal efficiency.
According to the experiment of battery charging and discharging characteristics, it can be seen that when the battery is charged to SOC above 90% and discharged to SOC below 10%, there may be performance and safety issues caused by polarization reactions inside the battery. Therefore, in this article, charging is prohibited when the SOC exceeds 90%, and discharging is prohibited when the SOC is below 10%. At the same time, in order to achieve SOC equilibrium, units with low SOC are selected for charging priority, while units with high SOC are selected for discharging priority. The expression is shown in the formula.
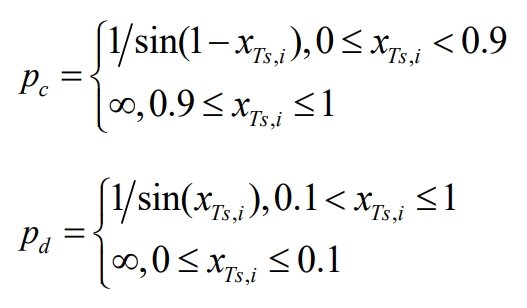
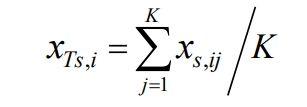
In the formula, dp and dp are the priority values for the charging and discharging of the energy storage unit, with the smaller the value, the higher the priority; K is the number of units in each unit; Ts i, x is the SOC of the i-th energy storage unit; S ij, x is the SOC of the jth subsystem of the i-th energy storage unit.
In the article, SOC is defined using the ampere hour integration method, where SOC is calculated based on battery capacity and current electricity level. According to the strategy framework shown in Figure 2, the actual number of units running, Mr., needs to be calculated. The calculation method is shown in equation (6), which is determined by the total demand power.
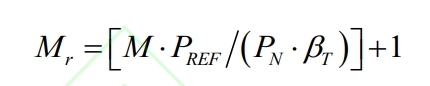
In the formula: PREF is the total required power of the energy storage power station; M is the number of transformers (energy storage units); PN is the rated power of the energy storage station; β T is the minimum optimal load rate of the transformer; [x] To perform rounding calculations on x.
Based on the transformer energy consumption model, establish a unit optimization layer optimization model, with the objective function F as shown in the formula.
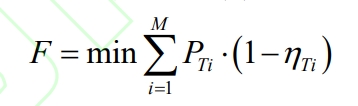
In the equation: η Ti is the efficiency of the i-th transformer; PTi is the output power value of the i-th transformer in the energy storage station.
The operation of energy storage power plants needs to meet various constraints such as power and SOC, as shown in the formula.
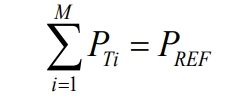
The energy storage power station is allocated to each energy storage unit based on output instructions, and then to each energy storage subsystem. The total output power must meet the total demand power PREF of the energy storage power station, which can be obtained by summing the output power of each transformer, as shown in the formula.
Each transformer in the energy storage power station has output limitations, and power distribution needs to meet its output constraints, as shown in the formula.
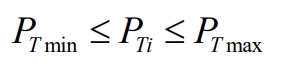
In the formula, PTmin and PTmax are the minimum and maximum limits for the output power of the transformer in the energy storage station.
3.2 Subsystem optimization layer
The subsystem optimization layer is a multi-objective optimization layer that considers the energy efficiency and SOC balance of the energy storage subsystem. It is mainly based on the energy consumption model of the energy storage subsystem proposed in this article, and the results of the unit layer are further allocated to each subsystem. The objective function is shown in the formula.
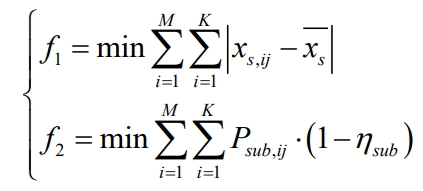
In the formula: sx is the SOC setting value of the energy storage subsystem; Psub, ij is the output power value of the jth subsystem of the i-th energy storage unit. During the operation of energy storage power plants, various constraints such as power and SOC need to be met, as shown in the formula:
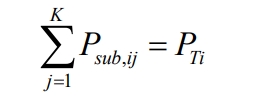
The energy storage station is allocated to each energy storage unit based on output instructions, and then to each energy storage subsystem. The total output power must meet the total demand power PREF of the energy storage station, which can be obtained from the total output power of each transformer and the total output power of each energy storage subsystem. At the same time, the output power of the subsystems within the unit must be equal to the output power of the unit, as shown in the formula.
The power transmission limit of PCS needs to meet its output constraints during power allocation, as shown in the formula.
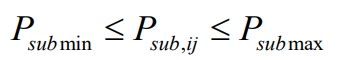
In the formula, Psubmin and Psubmax are the minimum and maximum output limits of the energy storage subsystem, mainly considering the PCS transmission power limit.
The operation of the power station needs to meet the SOC constraints of each energy storage subsystem, such as the formula.
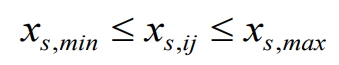
In the formula, X, s min, X, s max are the minimum and maximum SOC limits of the subsystem, which correspond to different limits during charging and discharging processes, as shown in the formula.
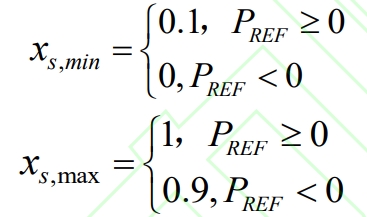
The SOC calculation of the energy storage subsystem is based on the formula, defined by the ampere-hour integration method, which is the ratio of the current electricity level to the nominal battery capacity. The current capacity is calculated by subtracting the time period from the initial capacity Δ The capacity is calculated using power and time, and the nominal capacity is based on the rated capacity of the battery pack. Considering the time period in the text Δ The energy storage output within t remains unchanged, while considering the efficiency loss of the subsystem.
In the formula: Xs, ij (t) is the SOC of the jth energy storage subsystem of unit i at time t; Xs, ij (t- Δ t) For t- Δ The SOC of the jth energy storage subsystem of unit i at time t; QsubN is the rated capacity of the energy storage subsystem.
3.3 Solving Algorithm
Genetic algorithm (GA), based on the principle of survival of the fittest in nature, continuously adapts the offspring population to the environment and ultimately reaches or approaches the optimal solution. Non dominated Sorting Genetic Algorithms – II (NSGA – II) has two main parts compared to traditional GA: one is fast non dominated sorting, and the other is the definition of crowding distance and elite retention strategy, Make NSGA – II more suitable for solving multi-objective problems, with faster calculation speed and more objective results. However, the above two types of genetic algorithms have randomness in their solution and are prone to local optima. In this paper, the mutation probability is adjusted to reduce the occurrence of such situations.
The two-level optimization strategy includes two processes: single objective and double objective optimization, both of which are nonlinear optimization problems. Compared to traditional solving algorithms, intelligent algorithms are more prone to obtaining feasible solutions to nonlinear problems, while reducing the mathematical processing of objective functions and constraint conditions. Therefore, this article selects GA to solve the unit level optimization results, and NSGA – II with elite strategy to solve the subsystem level multi-objective optimal solution set. The final solution is evaluated through the distance method of superior and inferior solutions, and the overall process is shown in Figure 5.
4. Simulation analysis
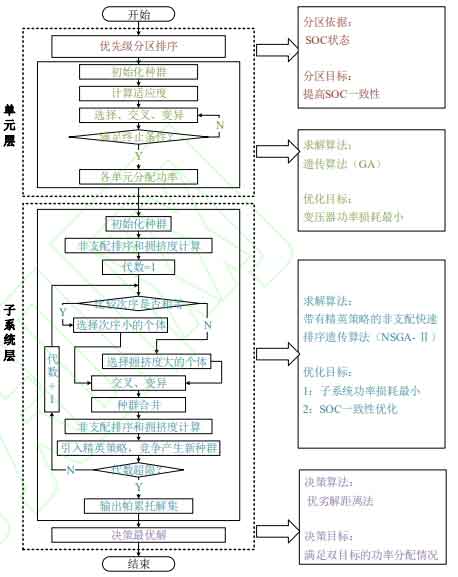
Simulate and analyze the energy storage power plant shown in Figure 6 through MatlabR2022a. The lithium battery energy storage power station has a capacity of 10MW/20MW ∙ h, consisting of four energy storage units, each consisting of four energy storage subsystems. The specific parameters are shown in Table 2, and the initial SOC values of each energy storage subsystem are shown in Table 3. The numbers in the table correspond one-to-one with the numbers in Figure 6 topology. The basic parameters of the algorithm in the article are set as follows: unit level: initial population size is 100, iteration number is 300, crossover ratio is 0.2, and mutation probability is 0.3. Subsystem layer: The initial population size is 100, the number of iterations is 250, the crossover ratio is 0.2, and the mutation probability is 0.3.
The SOC balance effect is expressed and evaluated by the SOC balance degree, and the closer the value is to 0, the better. The expression is shown in the formula.
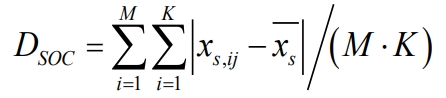
In the formula, xs represents the mean SOC of all subsystems.
| Parameters | Value |
| Rated power/MW energy storage power station | 10 |
| Rated power/MW energy storage unit | 2.5 |
| Rated power/MW energy storage subsystem | 0.625 |
| Rated capacity/(MW ∙ h) – Energy storage power plant | 20 |
| Rated capacity/(MW ∙ h) – Energy storage unit | 5 |
| Rated capacity/(MW ∙ h) – Energy storage subsystem | 1.25 |
| Transformer capacity/kVA | 2500 |
| Rated power of energy storage PCS/kW | 630 |
| Battery Ohmic Internal Resistance/Ω 2.0 × 10 ^ -4 | 2.0X10^4 |
| Polarization internal resistance of battery/Ω 3.96 × 10 ^ -4 | 3.96X10^-4 |
| Number | 1-1 | 1-2 | 1-3 | 1-4 | 2-1 | 2-2 | 2-3 | 2-4 |
| SOC initial value/% | 40 | 38 | 51 | 54 | 60 | 55 | 69 | 45 |
| Number | 3-1 | 3-2 | 3-3 | 3-4 | 4-1 | 4-2 | 4-3 | 4-4 |
| SOC initial value/% | 47 | 52 | 51 | 62 | 51 | 54 | 61 | 40 |
4.1 Simulation Results and Analysis of Different Command Values
According to the actual application scenario of energy storage power plants, under the same initial state, calculate the power distribution of energy storage power plants when the command power is 0-10MW. The simulation results are shown in Figure 6.
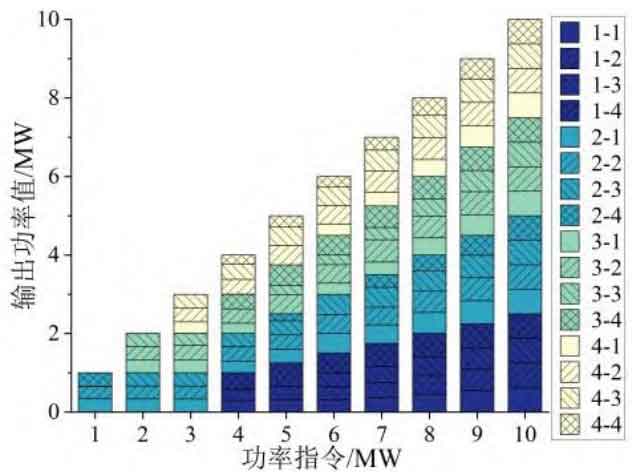
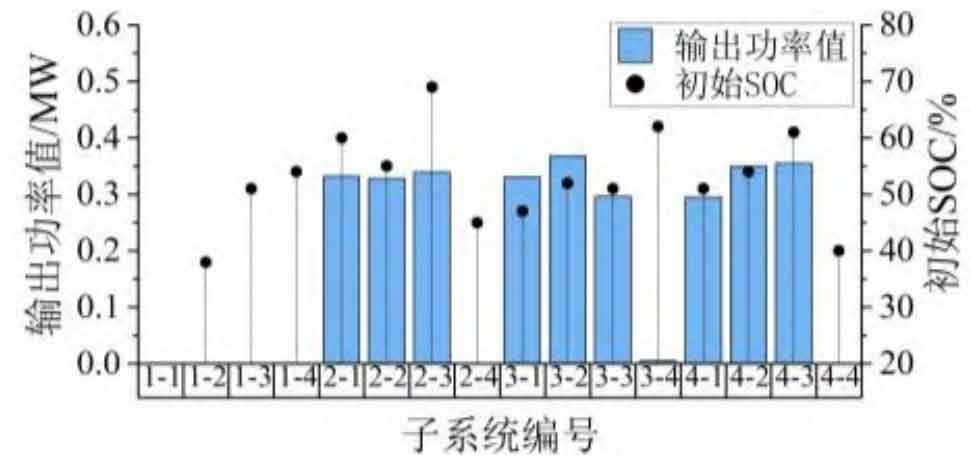
The legend numbers in Figure 7 correspond one-to-one with the numbers in Table 3, indicating the energy storage unit and subsystem numbers. After receiving the command power value, the energy storage power station will discharge the energy storage units in the order of 2, 3, 4, and 1 according to the unit SOC state, as shown in Figure 6. Within each unit, subsystems with larger SOC are also responsible for more power tasks. For example, when the power command is 3MW, the response of the energy storage plant is shown in Figure 7. The actual operation is for units 2 #, 3 #, and 4 #, where the initial SOC of the fourth subsystem in unit 2 # is 0.45, which is the lowest value within the unit. Therefore, after optimization and solution, the allocated power is 0, thereby ensuring the consistent optimization effect of SOC within the unit. During the solution process, it is also necessary to consider the optimization of energy efficiency in energy storage power plants, as the distribution law of allocated power and initial SOC values is not completely consistent.
From Figure 9, it can be seen that the final value of SOC balance degree under different power commands has decreased compared to the initial value of SOC balance degree, from 6.5% to 6.29% to 6.472%. When the power command is less than 3MW, based on the charging and discharging priority of the energy storage unit, only the actual operation of the energy storage unit with higher SOC is required, significantly reducing the difference in SOC between units. As the power command increases, the number of operating units increases, and the optimization effect of SOC consistency weakens. After optimizing through a double-layer power allocation strategy, the efficiency of energy storage power plants is greater than 90%.
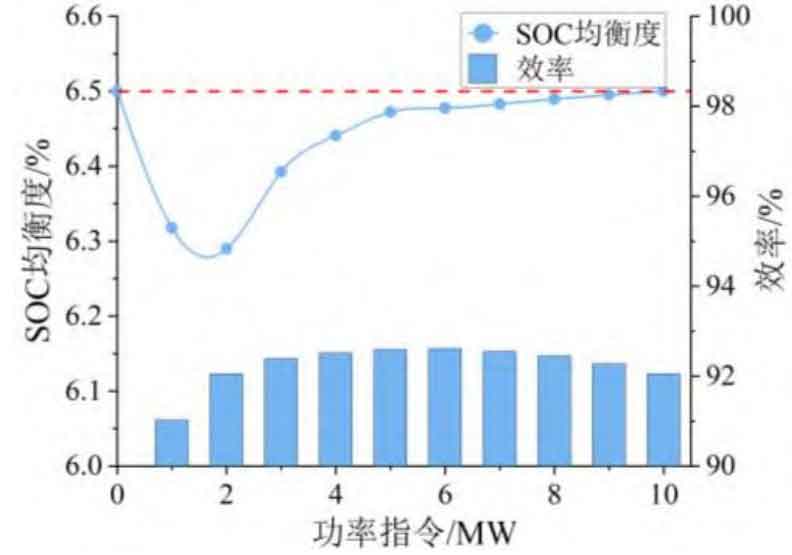
In summary, the proposed two-layer power allocation optimization model can balance the low energy consumption and high SOC consistency of energy storage plants, and can improve the bidirectional regulation ability and economy of energy storage plants.
4.2 Simulation Results and Analysis of Continuous Instructions
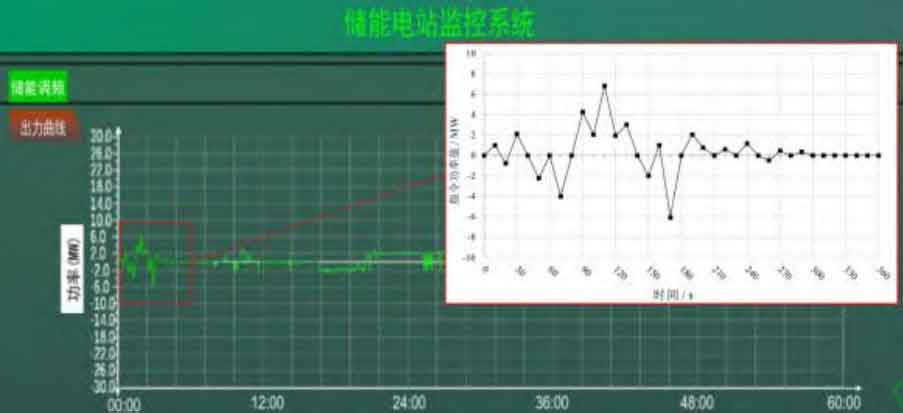
The above simulation verification shows that the strategy responds to a single command by extracting a set of continuous power command values based on the actual command information during a frequency modulation of a certain power station. As shown in Figure 10, the time for intercepting the command information is 360s, and the command action cycle is set to 10s.
The power distribution of energy storage power plants under this strategy is shown in Figure 11.
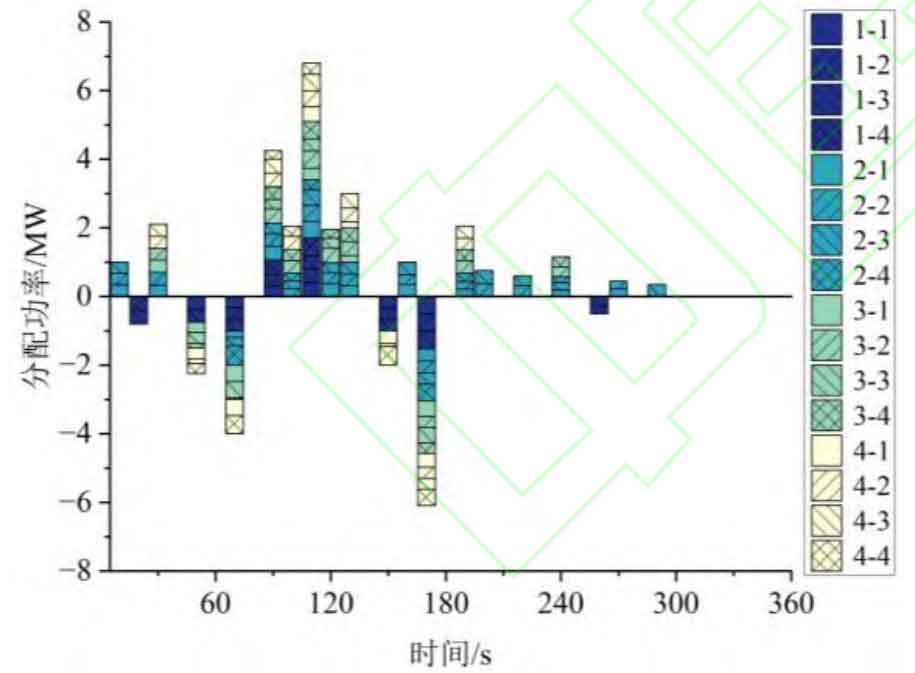
From Figure 11, it can be seen that when the energy storage station receives different command power values, the actual number and number of units in operation are different. The number of operating units is calculated based on the optimal load rate interval of the unit and subsystem, and the number of operating units is determined by the SOC status. At the 20th second in Figure 10, the command power value is -0.8MW, and the 1 # energy storage unit undertakes all power tasks; At the 120th second, the command power value is 1.95MW, and the 2 # and 3 # energy storage units jointly undertake the power task. Therefore, the dual layer power allocation strategy proposed in this article can reduce the energy consumption of energy storage stations by increasing the load rate of energy storage units to its optimal range and reducing the number of action units.
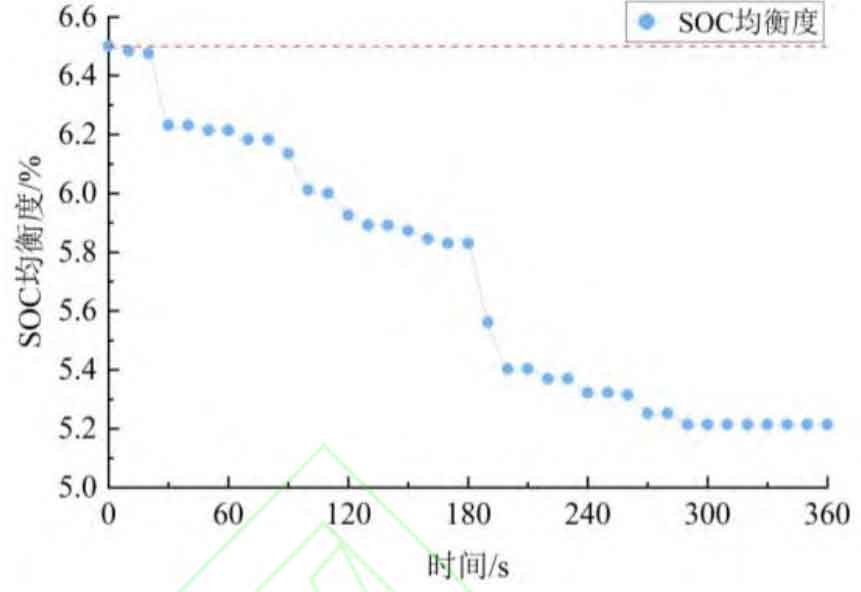
From Figure 12, it can be seen that using a dual layer power allocation strategy reduces the actual number of energy storage units in operation at low load rates, which can reduce the overall energy consumption of the power plant. The SOC balance of the energy storage subsystem significantly decreased during operation, from 6.5% to 5.21%.
In addition, this article compares the efficiency optimization and SOC balance effects of three different strategies for controlling energy storage power plants. The strategy ideas are summarized as follows:
Strategy 1: SOC proportional allocation strategy, which aims to balance SOC and does not consider the energy consumption characteristics of energy storage plants;
Strategy 2: Single layer multi-objective allocation strategy, only solving unit level optimization in this paper, and optimizing energy consumption based on SOC priority partitioning;
Strategy 3: This article’s strategy.
The specific allocation and solution methods for strategies 1 and 2 are shown in Appendix A.
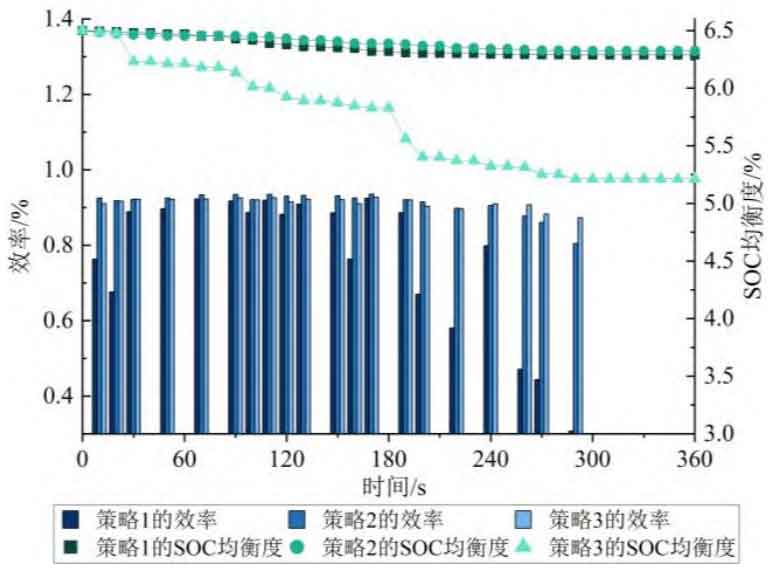
The SOC indicators and power consumption under different strategies are shown in Figure 13. The SOC consistency optimization effect of Strategy 3 has significantly improved compared to Strategy 1 and Strategy 2, and the power loss of Strategy 3 has significantly decreased compared to Strategy 1. Below, we will analyze the specific changes in strategy ideas, SOC, and efficiency.
| Time/s | Command power/MW | Efficiency/% Strategy 1 | Efficiency/% Strategy 2 | Efficiency/% Strategy 3 |
| 0 | 0 | / | / | / |
| 10 | 1 | 76.31 | 92.52 | 91.06 |
| 20 | -0.8 | 67.64 | 91.80 | 91.69 |
| 30 | 2.1 | 88.90 | 92.19 | 92.21 |
| 40 | 0 | / | / | / |
| 50 | -2.25 | 89.68 | 92.52 | 92.21 |
| 60 | 60 | / | / | / |
| 70 | -4 | 92.24 | 93.38 | 92.26 |
| 80 | 0 | / | / | / |
| 90 | 4.25 | 91.77 | 93.46 | 92.53 |
| 100 | 2.05 | 88.65 | 92.07 | 92.00 |
| 110 | 6.8 | 91.93 | 93.49 | 92.57 |
| 120 | 1.95 | 88.19 | 93.02 | 91.48 |
| 130 | 3 | 90.91 | 93.26 | 92.22 |
| 140 | 0 | / | / | / |
| 150 | -2 | 88.58 | 93.10 | 92.05 |
| 160 | 1 | 76.32 | 92.52 | 91.06 |
| 170 | -6.0 | 92.47 | 93.55 | 92.71 |
| 180 | 0 | / | / | / |
| 190 | 2.05 | 88.67 | 92.07 | 92.03 |
| 200 | 0.75 | 67.04 | 91.47 | 90.35 |
| 210 | 0 | / | / | / |
| 220 | 0.6 | 58.06 | 89.83 | 89.65 |
| 230 | 0 | / | / | / |
| 240 | 1.15 | 79.84 | 90.49 | 90.96 |
| 250 | 0 | / | / | / |
| 260 | -0.5 | 47.07 | 87.79 | 90.71 |
| 270 | 0.45 | 44.37 | 86.09 | 88.29 |
| 280 | 0 | / | / | / |
| 290 | 0.35 | 30.69 | 80.47 | 87.28 |
| 300-360 | 0 | / | / | / |
The efficiency of energy storage power plants under different strategies is shown in Table 4. Strategy 1 allocates output power proportionally without considering the energy consumption characteristics of energy storage plants, resulting in significant power loss. When the subsystem load rate is below 10%, the power consumption accounts for over 50%; Strategy 2 has been optimized for energy consumption under the premise of SOC priority partitioning, and its power loss is significantly reduced compared to Strategy 1. Its efficiency can reach over 80%. When the load rate is greater than 50%, Strategy 2 has the best energy consumption optimization effect, but when the load rate is less than 10%, its efficiency is significantly reduced compared to Strategy 3; Strategy 3 has conducted energy efficiency optimization solutions at both the unit and subsystem optimization levels, resulting in an efficiency of over 87% in the full load rate range. This has achieved energy consumption optimization for energy storage plants under power fluctuations such as frequency regulation and voltage regulation.
The SOC changes of the energy storage subsystem under different strategies are shown in Table 5. Strategy 1 achieves proportional allocation of output power according to the SOC situation, but it requires all subsystems to share corresponding power instructions, so the optimization amplitude of SOC is relatively small; Strategy 2 only performs SOC priority partitioning before optimization solving, which to some extent ensures SOC balance, but the optimization effect is poor; Strategy 3 optimizes power allocation at both the unit and subsystem optimization levels based on SOC status, resulting in the optimal SOC balance after operation. The changes in balance of energy storage power plants under different strategies are shown in Table 5.
| Time/s | Command power/MW | Efficiency/% Strategy 1 | Efficiency/% Strategy 2 | Efficiency/% Strategy 3 |
| 0 | 0 | 6.500 | 6.500 | 6.500 |
| 10 | 1 | 6.495 | 6.486 | 6.484 |
| 20 | -0.8 | 6.491 | 6.474 | 6.476 |
| 30 | 2.1 | 6.480 | 6.465 | 6.232 |
| 40 | 0 | 6.480 | 6.465 | 6.232 |
| 50 | -2.25 | 6.470 | 6.454 | 6.214 |
| 60 | 0 | 6.470 | 6.454 | 6.214 |
| 70 | -4 | 6.452 | 6.454 | 6.183 |
| 80 | 0 | 6.452 | 6.454 | 6.183 |
| 90 | 4.25 | 6.429 | 6.454 | 6.135 |
| 100 | 2.05 | 6.418 | 6.444 | 6.012 |
| 110 | 6.8 | 6.387 | 6.444 | 6.000 |
| 120 | 1.95 | 6.377 | 6.430 | 5.925 |
| 130 | 3 | 6.361 | 6.416 | 5.892 |
| 140 | 0 | 6.361 | 6.416 | 5.892 |
| 150 | -2 | 6.352 | 6.406 | 5.873 |
| 160 | 1 | 6.346 | 6.388 | 5.846 |
| 170 | -6.1 | 6.320 | 6.388 | 5.830 |
| 180 | 0 | 6.320 | 6.388 | 5.830 |
| 190 | 2.05 | 6.309 | 6.381 | 5.561 |
| 200 | 0.75 | 6.304 | 6.368 | 5.404 |
| 210 | 0 | 6.304 | 6.368 | 5.404 |
| 220 | 0.6 | 6.301 | 6.348 | 5.370 |
| 230 | 0 | 6.301 | 6.348 | 5.370 |
| 240 | 1.15 | 6.295 | 6.340 | 5.322 |
| 250 | 0 | 6.295 | 6.340 | 5.322 |
| 260 | -0.5 | 6.293 | 6.334 | 5.315 |
| 270 | 0.45 | 6.290 | 6.327 | 5.252 |
| 280 | 0 | 6.290 | 6.327 | 5.252 |
| 290 | 0.35 | 6.288 | 6.322 | 5.214 |
| 300-360 | 0 | 6.288 | 6.322 | 5.214 |
According to Table 5, the SOC balance of Strategy 1 was optimized by 0.212%, Strategy 2 by 0.178%, and Strategy 3 by 1.286%; Strategy 3 optimized 1.074% and 1.108% more than Strategy 1 and Strategy 2, respectively, significantly enhancing the bidirectional regulation capability of the energy storage plant.
| Strategy | 1 | 2 | 3 |
| SOC balance at the end of operation/% | 6.288 | 6.322 | 5.214 |
| SOC balance difference between beginning and end/% | 0.212 | 0.178 | 1.286 |
5. Conclusion
In the context of the large-scale development and application of energy storage resources, facing severe power fluctuations, energy storage power stations have high energy consumption costs and poor SOC consistency. This article proposes a dual layer power allocation strategy for battery storage power stations that considers energy efficiency and SOC balance, and conducts simulation verification to obtain the following conclusions:
1) The model proposed in this article allocates power based on the energy consumption characteristics of energy storage power plants, so that each unit and subsystem operates in the optimal load rate range. The simulation results show that for energy storage power plants with a capacity of 10MW/20MW ∙ h, the energy consumption optimization effect is the best after adopting a double-layer power allocation strategy. The efficiency of energy storage power plants is optimized to over 87% in the full load rate range.
2) The model proposed in this article can restore the SOC of the energy storage subsystem while balancing energy consumption optimization, making the SOC of the power plant as close as possible to the set value. The simulation results show that within 6 minutes, the SOC balance degree of the power plant with a capacity of 10MW/20MW ∙ h was optimized by 0.212%, 0.178%, and 1.286%, respectively, using the SOC proportional balance strategy, single-layer allocation strategy, and double-layer allocation strategy. Compared with the SOC proportional balance strategy and the single-layer allocation strategy, the double-layer allocation strategy is optimized to 6.07 and 7.22 times its value, significantly enhancing the bidirectional regulation ability of the energy storage station.
3) In the battery energy consumption model, correction coefficients related to battery connection mode, SOC state, and working time were introduced. The coefficient assignment is based on the variation pattern of battery ohmic internal resistance and polarization internal resistance. The ohmic internal resistance of the battery is almost unaffected by its operating state, and the polarization internal resistance increases at a rate of 1.75 times that of other regions in the first and last stages of SOC. During a period of time, the continuous charging or discharging of the battery intensifies the polarization reaction, leading to an increase in polarization internal resistance. On the contrary, the polarization internal resistance decreases after the charging and discharging state transitions.
Appendix A
Strategy 1 in the article is a commonly used SOC proportional allocation strategy in engineering, which allocates the output power values of each subsystem through the subsystem SOC proportional allocation factor. The calculation process is mainly shown in equations (A1) and (A2). It is easy to see that under the control of this strategy, all energy storage subsystems need to operate frequently, and when the power command amplitude is small, the power output of each subsystem is very small, resulting in the operation of energy storage power plants in lower efficiency intervals, Increased power loss.
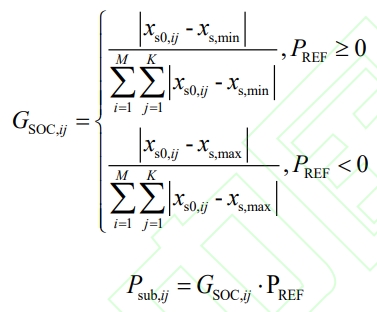
In the formula: GSOC, ij is the SOC proportional distribution factor of the jth subsystem of the i-th unit, s0, ij x is the initial SOC value of the jth subsystem of the i-th unit, s, max x, s, min x are the maximum and minimum SOC values.
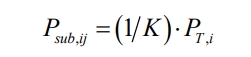
Strategy 2 in the article is a single-layer multi-objective allocation strategy that only considers unit level optimization. Only the unit level optimization solution is carried out in this article, and energy consumption optimization is carried out based on SOC priority partitioning. The solving algorithm used is the same as the two-layer power allocation strategy unit layer proposed in the article, which is a genetic algorithm. The subsystem layer distributes power evenly based on the number of subsystems within the unit, as shown in Equation A3.