
The construction of new power systems will gradually rely on new energy generation as the main power source, but the intermittency and volatility of new energy will have an impact on the frequency stability of the power system, making it increasingly difficult for traditional thermal power units to meet frequency regulation needs. During the 14th Five Year Plan period in China, it is planned to complete the flexibility transformation of thermal power units by 200 GW and increase the system regulation capacity by 30-40 GW. However, it is still difficult to meet the frequency regulation needs of the new power system. Compared to thermal power units, electrochemical energy storage has a fast, accurate response, and adjustable capacity. On average, the frequency modulation effect of electrochemical energy storage is more than 20 times that of thermal power units. Energy storage assisted frequency regulation of thermal power units can effectively improve the frequency regulation performance of the unit, improve the operating efficiency of the generator, and promote the consumption of renewable energy. However, how to balance the excellent frequency regulation characteristics of electrochemical energy storage and the high cost of determining its reasonable configuration is the key to promoting its large-scale application.
Energy storage can be divided into two types according to its working characteristics: energy based energy storage and power based energy storage. Energy based energy storage mainly consists of electrochemical energy storage, which generally has characteristics such as short lifespan and high energy density. The power type energy storage represented by flywheels and supercapacitors has a high power density, but a low energy density and high investment cost. Energy based energy storage and power based energy storage can complement each other’s advantages. While improving the frequency regulation performance of the power grid, they can reduce the battery energy storage life loss, thereby reducing the full life cycle cost of energy storage. Proved that mixed energy storage is more economical than single energy storage. Considering the difference in response speed between different energy storage systems, a frequency division method was used to allocate the frequency modulation demand signal to different energy storage systems. Based on this, an optimized configuration model was established to provide reference for the frequency modulation of hybrid energy storage assisted thermal power units.
Many scholars have studied the configuration of frequency regulation capacity for hybrid energy storage assisted thermal power units. Based on the different frequency regulation states, energy storage charging states, and charging and discharging powers of traditional units, different charging and discharging strategies are designed. On the basis of improving the frequency regulation effect of automatic generation control (AGC), the constraints of energy storage device investment, maintenance costs, and participation in AGC compensation and regulation benefits are considered, Using optimization algorithms to calculate the optimal energy storage capacity. Using a first-order filter, the regional frequency modulation control signal is divided into high-frequency components, intermediate frequency components, and low-frequency components. Then, using the filter filtering time constant as the optimization variable, the particle swarm optimization algorithm is used to obtain the most cost-effective energy storage capacity configuration and power allocation. Propose the use of empirical mode decomposition (EMD) to decompose and reconstruct the target power of energy storage, thereby determining the hybrid energy storage configuration, and then determining the planned capacity of the energy storage system with the goal of normalized cost.
In order to balance the issues of energy storage configuration planning and operational requirements, some scholars have constructed a dual layer optimization model for energy storage: a dual layer optimization model for electrochemical/hydrogen energy storage system configuration has been established, taking into account the daily investment cost of hybrid energy storage in the upper layer model, and solving the problem of different lifespans of hybrid energy storage; A dual layer collaborative optimization model for energy storage capacity has been established, which considers both energy storage capacity planning and energy storage operation optimization. A capacity allocation plan and a system scheduling operation plan have been proposed to maximize the comprehensive benefits of the system; A hybrid energy storage dual layer optimization configuration model based on metamodel has been proposed, which improves the optimization solution speed; An energy management strategy considering the state of charge was proposed, with the goal of minimizing the sum of full life cycle costs and electricity trading costs as the objective of a hybrid energy storage double-layer optimization model. However, capacity optimization configuration is based on improving the hybrid energy storage energy management strategy, without considering the coupling relationship between the energy storage system output and the hybrid energy storage capacity.
Currently, most studies have configured hybrid energy storage based on the output of existing thermal power units, without considering the impact of energy storage on reducing frequency regulation losses of thermal power units. Some traditional filters are used to decompose the frequency modulation signal into low-frequency components of the thermal motor response and medium to high frequency components of the mixed energy storage response. However, the delay generated by traditional filters during the filtering process can cause the configuration results to be too large. In addition, the frequency domain decomposition method also has two drawbacks: firstly, it cannot continue to respond to the assigned instructions when the energy storage is overcharged or discharged; The second is that the charging and discharging times of the energy storage system will vary with the fluctuation strength of the frequency modulation signal, which is detrimental to the energy storage life. At present, most of the energy storage capacity configuration for thermal storage combined with frequency regulation considers economic and technical indicators. Most studies have converted technical indicators into economic benefits and added them to the objective function. However, due to the limitations of energy storage costs and thermal economic benefits, the energy storage configuration may be too low, which may not achieve the goal of improving frequency regulation performance.
1) A dual layer control strategy for hybrid energy storage assisted thermal power AGC based on EMD decomposition and considering state of charge (SOC) recovery is proposed, which reduces frequency modulation losses of thermal power units while avoiding the impact of frequency domain decomposition on energy storage life.
2) Taking into account the economic and technical aspects of hybrid energy storage assisted thermal power AGC, a multi-objective hybrid energy storage dual layer optimization configuration model was established that takes into account the full life cycle cost benefit and AGC comprehensive evaluation index Kp. This model not only improves the AGC regulation performance of thermal power units, but also enhances the economic efficiency of the hybrid energy storage system.
3) The introduction of the technique for order preference by similarity to an ideal solution (TOPSIS) method in multi-objective particle swarm optimization algorithm avoids the chance of selecting the optimal particle in the Pareto solution set in traditional multi-objective particle swarm optimization algorithms.
Firstly, the structure of the thermal power hybrid energy storage joint frequency modulation system is presented. Secondly, the AGC instruction allocation method between thermal power hybrid energy storage and the hybrid energy storage control strategy considering SOC recovery in the underlying model are proposed; Then, a multi-objective hybrid energy storage optimization configuration model was established as the upper layer model, taking into account the cost benefit and AGC comprehensive evaluation index Kp throughout the entire life cycle. The model was solved using an improved multi-objective particle swarm optimization algorithm; Finally, the effectiveness and economy of the method were verified using actual operating data from a power plant in North China.
1. Thermal power hybrid energy storage combined frequency modulation system
At present, the power system adjusts the frequency changes of the system through automatic generation control. Thermal power hybrid energy storage combined frequency modulation model.
Hybrid energy storage assists in AGC regulation of thermal power units through active intervention. The dispatch center generates AGC commands by detecting real-time data such as grid frequency and tie line power. The AGC commands are first decomposed into thermal power unit frequency modulation commands and hybrid energy storage frequency modulation commands through the thermal power hybrid energy storage collaborative control system. The hybrid energy storage frequency modulation commands are then distributed to the flywheel energy storage and battery energy storage systems through the hybrid energy storage control system to achieve the output allocation of various frequency modulation resources.
The high cost of energy storage systems limits their large-scale application, so it is necessary to configure energy storage reasonably in order to comprehensively improve the frequency modulation effect and economy of frequency modulation systems. The control strategy of energy storage affects the SOC of energy storage, which in turn affects its life cycle, and the results of energy storage configuration bring power and energy constraints to the control strategy. Therefore, energy storage configuration and control strategy are closely coupled; The allocation of energy storage capacity belongs to a long-term planning problem, while the control strategy belongs to a short-term operational problem. To address these issues, it is necessary to conduct hierarchical research on the strategy and configuration issues. Therefore, this paper establishes a two-layer model for energy storage optimization configuration.
2. Dual layer model for hybrid energy storage configuration
Considering the coupling and different time scales between the control strategies and configurations of hybrid energy storage systems, a two-layer model for optimizing the configuration of hybrid energy storage is established.
On the basis of not affecting the economic operation of thermal power units, reducing the frequency regulation mileage of thermal power units, the factory level AGC instructions are first decomposed and reconstructed into n thermal power hybrid energy storage frequency regulation instruction allocation schemes through EMD decomposition. Secondly, input each allocation scheme into the underlying model to solve the output curve of each frequency modulation resource and the mixed energy storage SOC change curve. The upper level model calculates the benefits and costs over the entire life cycle, as well as the Kp index, based on the output curves of various frequency modulation resources and energy storage SOC changes from the lower level model, combined with the currently configured hybrid energy storage capacity and power. Then, the hybrid energy storage configuration value is updated based on the calculation results, and the updated configuration value is transmitted to the lower level model as a power and capacity constraint for hybrid energy storage. Repeat the above steps until the optimal configuration of hybrid energy storage is obtained for all thermal power hybrid energy storage frequency modulation command allocation schemes. Finally, the TOPSIS method is used to select the optimal configuration among all configuration schemes.
2.1 Thermal Power – Hybrid Energy Storage Control Strategy
2.1.1 Thermal Power – Hybrid Energy Storage AGC Command Allocation
The plant level AGC instruction contains the operating base value of thermal power units, so it is necessary to decompose the plant level AGC instruction into low-frequency components containing the operating base point of thermal power units and high-frequency components oscillating near zero. At present, the decomposition of frequency modulation instructions usually uses filters, window Fourier transform, wavelet transform, etc. These methods have human interference factors when processing non-stationary signals, such as selecting window width and selecting basis functions, which cannot accurately extract high and low frequency feature mode components. Therefore, this article uses empirical mode decomposition method to decompose the factory level AGC instructions into several intrinsic mode functions (IMF) and residuals, and then recombines the IMF and residuals into low-frequency and high-frequency components. The low-frequency component is responded to by the thermal power unit. Due to the slow response speed and low response accuracy of thermal power units, incomplete response may occur when tracking AGC low-frequency commands. Therefore, it is necessary to add the power that the thermal power unit fails to track to the high-frequency components of AGC to obtain the frequency regulation demand command of the hybrid energy storage system, and then allocate it to various frequency regulation resources through the second layer control strategy. The process of AGC instruction allocation between thermal power and hybrid energy storage and the process of AGC instruction allocation between hybrid energy storage.
2.1.2 Constraints of the underlying model
1) Battery charging and discharging power constraints
To avoid the lifespan loss caused by excessive charging and discharging of the battery, a dual logistic function is used to reflect the output constraints of the battery at different SOC for energy storage, as shown in Figure A1 in Appendix A. The function expression is:
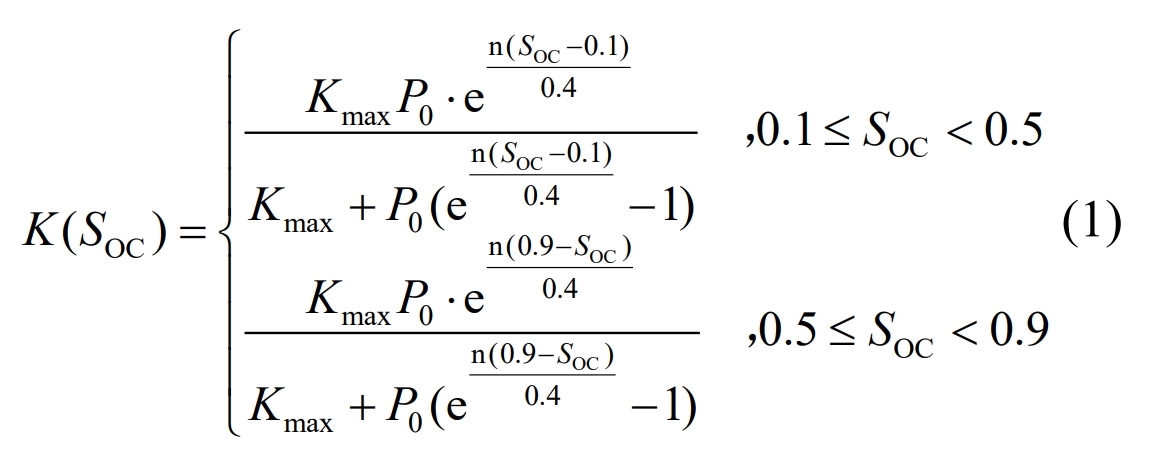
When SOC<0.1 or SOC ≥ 0.9, K (SOC)=0. In the formula, P0 is taken as 0.01; Take 1 for Kmax; The speed of describing curve changes is taken as 15;
SOC is the state of energy storage SOC, defined as follows.
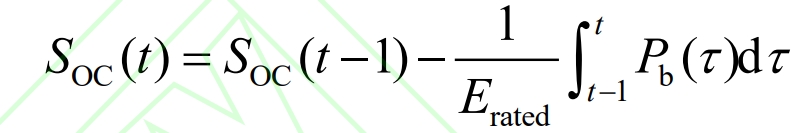
In the formula: Erated is the rated energy storage capacity; Pb is the energy storage and discharge power of the lithium battery; The range of SOC is between 0 and 1.
2) Power balance constraints
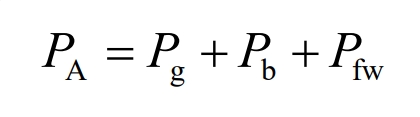
In the formula: PA is the AGC power command; Pg is the output of the thermal power unit; Pfw is the flywheel energy storage output.
3) Energy storage SOC constraints

In the formula, SOCL and SOCH are the maximum and minimum values of SOC, with values taken as 0.1 and 0.9 respectively; SOCb (t) and SOCf (t) are the SOC of battery energy storage at time t and the SOC of flywheel energy storage, respectively.
4) Energy storage power constraint
The power constraint of lithium batteries is:
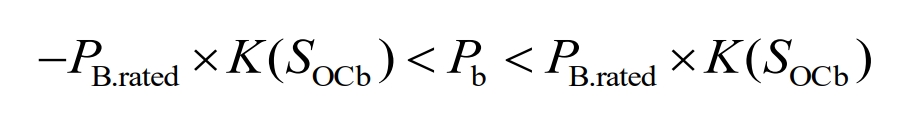
The flywheel energy storage power constraint is:
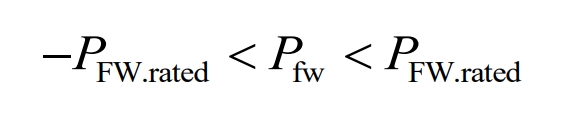
In the formula, PB. rated and PFW. rated represent the rated power of battery energy storage and flywheel energy storage, respectively.
2.1.3 Hybrid energy storage control strategy considering SOC recovery
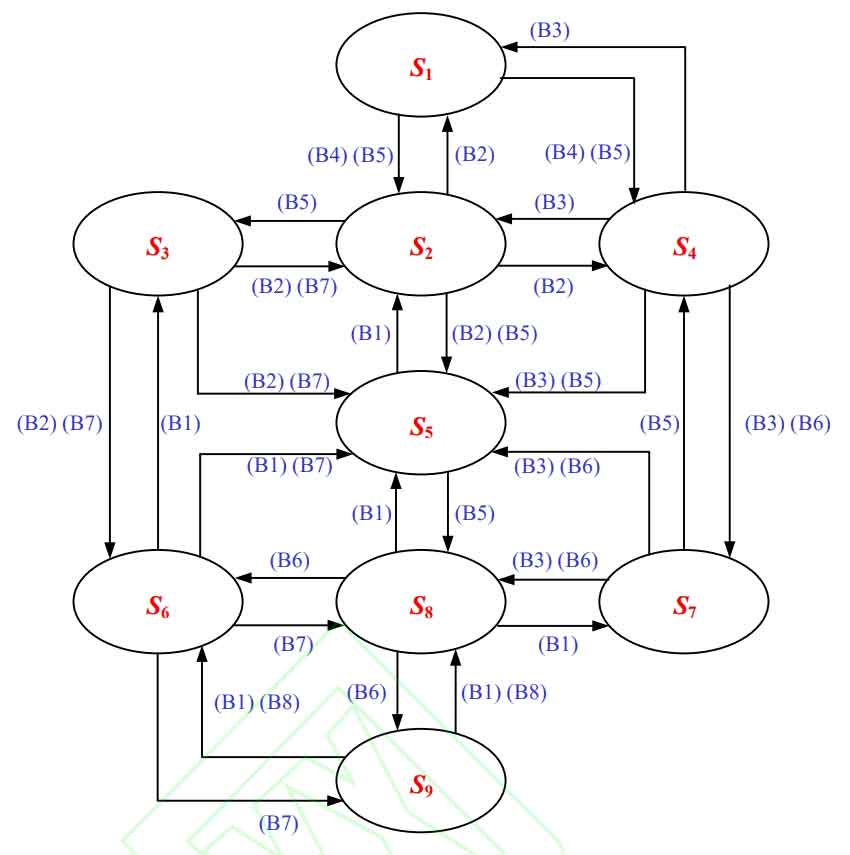
The maximum number of charging and discharging cycles for flywheel energy storage is independent of the charging and discharging rate, while the service life of lithium-ion batteries is related to the depth of charging and discharging. Therefore, a hybrid energy storage frequency control strategy was designed that takes into account the recovery of energy storage SOC and prioritizes flywheel energy storage adjustment. The aim is to improve the service life of lithium-ion batteries and reduce their replacement times throughout the entire life cycle of hybrid energy storage. Firstly, determine the operating condition Sn of the hybrid energy storage system based on its SOC state, as shown in Table 1. Take 0.1 as SOCL in Table 1; SOCH takes 0.9.
| SOC Range | 0<SOCb<SOCL | SOCL<SOCb<SOCH | SOCH<SOCb<1 |
| 0<SOCf<SOCL | S1 | S2 | S3 |
| SOCL<SOCf<SOCH | S4 | S5 | S6 |
| SOCH<SOCf<1 | S7 | S8 | S9 |
Then, combined with hybrid energy storage regulation demand PHY_ C and the real-time SOC state of hybrid energy storage establish transfer equations for each operating state. The transition between each operating state is shown in Figure 1, where (B1) – (B8) are the transfer equations for hybrid energy storage operating state. The specific equations are shown in equations (B1) – (B8) in Appendix B.
2.2 Upper level model for optimized configuration of hybrid energy storage
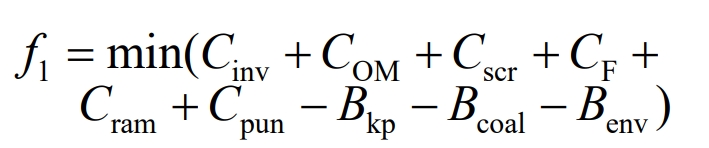
In order to solve the problem of high energy storage costs and low energy storage configuration results caused by the economic benefits of thermal power units themselves, which cannot improve the frequency regulation effect, two objective functions are set in the upper layer model of hybrid energy storage optimization configuration, namely the difference between cost and benefit over the entire life cycle of hybrid energy storage and the Kp index, as shown in the formula. Among them, the cost includes the full life cycle cost of hybrid energy storage, other costs of thermal power hybrid energy storage AGC regulation, and the benefits include the direct benefits of AGC frequency modulation mileage and the indirect benefits of reducing the system’s coal burning cost and power generation pollution discharge cost.
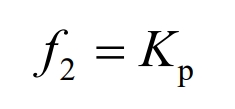
The calculation method for Kp index is:
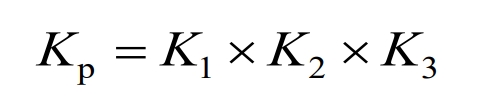
In the formula, Cinv represents the investment cost of hybrid energy storage; COM represents the operating cost of hybrid energy storage; Cscr is the cost of scrapping and disposing of lithium batteries; CF is the cost of failure losses; Cram and Cpun are the cost of frequency regulation loss and the penalty cost of regulating offset electricity for thermal power units, respectively; Bkp represents the AGC FM mileage revenue; Bcoal is an indirect benefit of reducing the system’s coal burning costs; Benv aims to reduce the indirect benefits of system power generation and pollution discharge costs. K1 is the regulation rate indicator; K2 is the adjustment accuracy index; K3 is a response time indicator, and the calculation methods for the above cost and benefit parameters will be introduced in sections 2.2.1, 2.2.2, and 2.2.3. The specific calculation formulas for K1, K2, and K3 are shown in Appendix C.
2.2.1 Full Life Cycle Cost of Hybrid Energy Storage
According to the definition of the International Electrotechnical Commission, life cycle cost (LCC) refers to all direct, indirect, derivative, and non derivative expenses of the entire system during its life cycle. For energy storage, it mainly includes investment costs, operation and maintenance costs, scrap disposal costs, and fault loss costs.
1) Lifetime model of lithium-ion batteries
Combining lithium-ion batteries with flywheel energy storage as a hybrid energy storage system, flywheel energy storage belongs to the physical energy storage method, with a lifespan of 20 years and a charging and discharging cycle of over 10 million times. The lifespan of lithium-ion batteries is limited, and frequent and high rate charging and discharging can reduce their lifespan and increase the number of battery replacements throughout their entire lifespan. The operating life of lithium-ion batteries is closely related to the depth of charging and discharging. When the battery is charging, the state of charge increases from SOC (t0) to SOC (t1) at the end of the charging task, and then the discharge task decreases from SOC (t1) to SOC (t0), which is the depth of one charging and discharging cycle Δ SOC. The calculation formula for the depth of energy storage charge and discharge is:
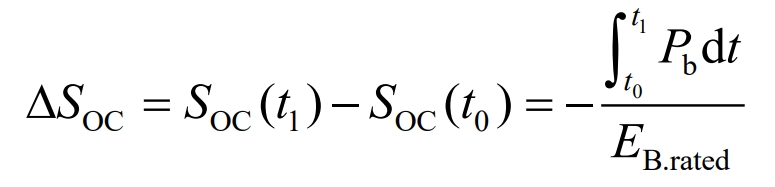
In the formula: EB.rated is the rated capacity of lithium-ion battery energy storage; Pb represents the energy storage and discharge power of the lithium battery.
According to the experimental data of charge and discharge depth and maximum charge and discharge times, the relationship function between energy storage charge and discharge depth and maximum charge and discharge times is fitted as follows:
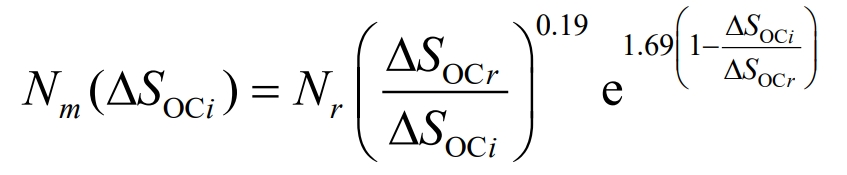
In the equation: Δ SOCi is the depth of the i-th charge and discharge; Δ SOCr is the rated depth of charge and discharge, generally taken as 1; Nr is the maximum number of charges and discharges at the rated depth, taken as 4500.
Define equivalent charge discharge coefficient α At the depth of charge and discharge Δ When SOC is x, one charge and discharge is equivalent to the number of charges and discharges under complete charge and discharge, with a value range of (0,1).
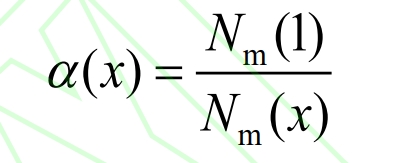
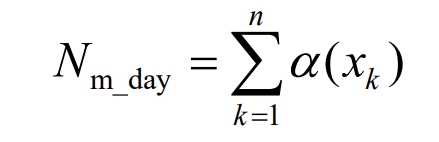
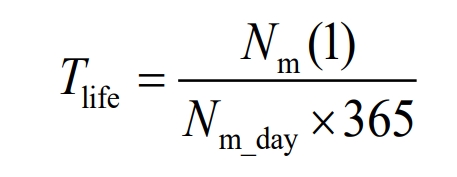
In the formula, Nm (x) is the depth of charge and discharge Δ The maximum number of charges and discharges when SOC=x; Nm (1) is the maximum number of charging and discharging times under complete charging and discharging conditions. Using the rain flow counting method to calculate the depth of charging and discharging for a day, combined with the formula, the equivalent number of charging and discharging times per day is:
The battery service life is:
2) Investment cost
The investment cost of energy storage includes initial investment cost and replacement investment cost. The initial investment cost consists of the power cost determined by the rated power of energy storage and the energy cost determined by the rated capacity. Power cost refers to the cost of equipment and construction related to power in energy storage systems, such as converters, transformers, and other equipment in battery energy storage systems. Energy cost refers to the cost of equipment and construction related to energy storage capacity in the energy storage system, such as equipment costs and corresponding construction costs for batteries, battery containers, etc. in battery energy storage. Replacement investment cost refers to the cost of replacing battery energy storage equipment during energy storage operation. The cost calculation formula for energy storage investment is:
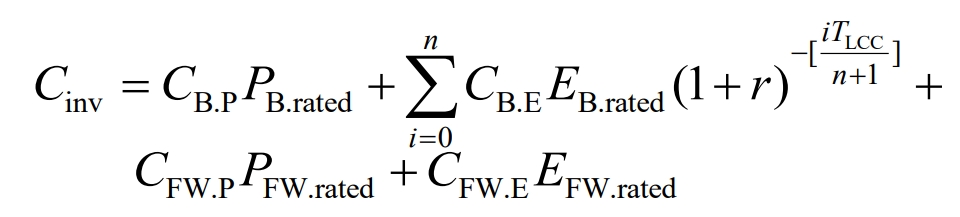
In the formula, CB. P and CFW. P represent the unit power cost of battery energy storage and flywheel energy storage, respectively; CB. E and CFW. E represent the unit capacity cost of battery energy storage and flywheel energy storage, respectively; PB. rated and PFW. rated are the rated power of battery energy storage and flywheel energy storage, respectively, in MW; EB. rated and EFW. rated are the rated capacities of battery energy storage and flywheel energy storage, MWh; R is the discount rate; TLCC is the full life cycle, taken as 20 years; N is the number of replacements, n=TLCC/Life, plus a total of (n+1) energy storage equipment inputs for the initial installation; Tlife is the service life of lithium-ion batteries.
3) Operation and maintenance costs
Operation and maintenance costs refer to the funds invested in maintaining the normal operation of the energy storage system during its service life, including power maintenance costs and energy maintenance costs. The calculation formula for operation and maintenance costs is:
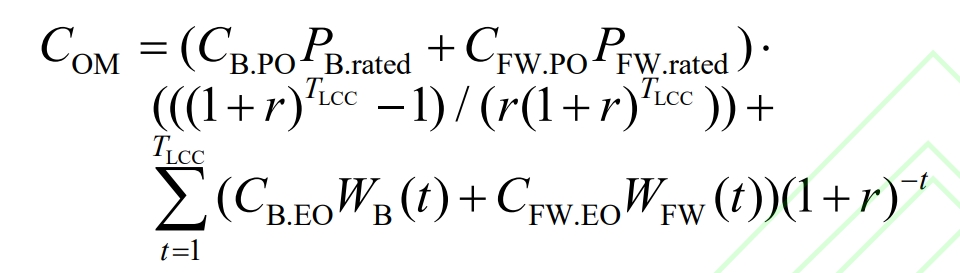
In the formula: CB. PO is the unit power operation and maintenance cost of the battery; CFW.PO is the unit power operation and maintenance cost of the flywheel; CB. EO is the unit energy operation and maintenance cost of the battery; CFW.EO is the unit energy operation and maintenance cost of the flywheel; WB (t) and WFW (t) are the annual charging and discharging capacities of the battery and flywheel, respectively.
4) Scrap processing cost
The cost of scrapping refers to the cost of harmless treatment and recycling of battery equipment after scrapping throughout the entire life cycle of hybrid energy storage. Flywheel energy storage operates in a friendly environment and is a green energy storage method, so there is no scrap disposal cost for flywheel energy storage. The calculation formula for the cost of scrapping battery energy storage is:
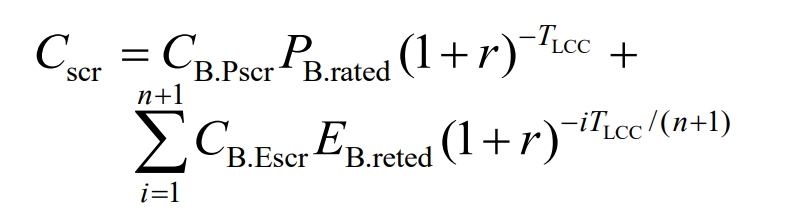
In the formula, CB. Pscr and CB. Escr represent the cost of battery unit power disposal and battery unit energy disposal, respectively.
5) Cost of energy storage failure losses
The cost of energy storage failure losses refers to the cost of losses incurred by energy storage equipment in the event of failure, including fault handling costs and power outage losses. The cost of failure loss refers to the cost of repairing the energy storage system after it malfunctions; The cost of power outage loss refers to the loss of frequency modulation revenue caused by the inability of the energy storage system to participate in frequency modulation during the fault handling stage. The calculation formula for failure loss cost is:
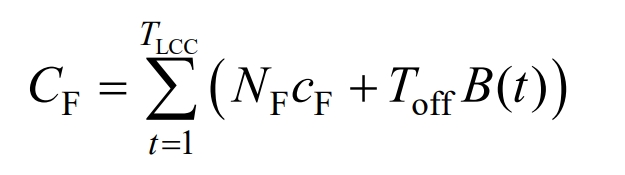
In the formula: NF is the average annual failure frequency of energy storage equipment; CF is the average cost of fault handling; Toff is the average annual power outage time of the energy storage equipment; B (t) represents the total revenue from energy storage participating in AGC regulation in year t, including the revenue from thermal power hybrid energy storage AGC frequency regulation, indirect revenue from reducing system coal costs, and indirect revenue from reducing system power generation and pollution discharge costs. The above benefits will be introduced in section 2.2.3.
2.2.2 Thermal Power – Hybrid Energy Storage AGC Regulation Other Costs
In addition to the full life cycle cost of hybrid energy storage, it also includes the frequency regulation wear cost and frequency regulation offset electricity penalty cost of thermal power units.
1) Frequency regulation loss and wear of thermal power units
When participating in frequency regulation, thermal power units may experience certain losses due to frequent climbing. The formula for calculating the frequency regulation loss of thermal power units is:
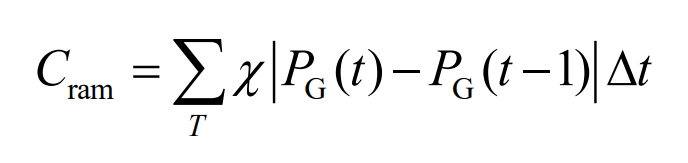
2) Frequency modulation offset power penalty cost
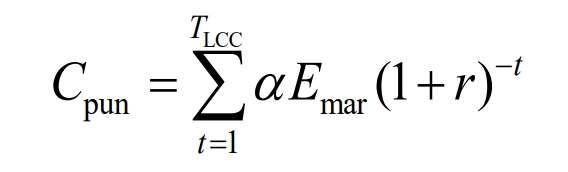
In the equation: χ Cost of climbing loss for the unit; PG (t) is the output of the unit at time t; Emar is the annual deviation electricity quantity; α Is the penalty coefficient, taken as 30 yuan/MWh.
2.2.3 Thermal Power – Hybrid Energy Storage AGC Frequency Modulation Benefits
The frequency modulation benefits of the thermal power hybrid energy storage combined frequency modulation system include the direct benefits of frequency modulation mileage and the indirect benefits of reducing the system’s coal burning cost and reducing the cost of power generation and pollution discharge.
1) AGC FM mileage revenue
In response to the economic losses caused by the participation of thermal power plants in AGC, the market will provide certain AGC economic compensation to AGC units. The calculation formula for the daily compensation fee for AGC service contribution is:
In the formula: YAGC is the AGC compensation price; KPd is the adjustment performance indicator for the day, and D is the daily adjustment depth, which is the sum of daily adjustment amounts. The expression is:
In the formula, Di represents the i-th adjustment depth, and when receiving the next AGC command, Di=| PA Psi |. If the command value is not reached, Di=| PEi Psi |; Psi is the output of the system at the beginning of the i-th AGC regulation; PEi is the output of the system at the end of the i-th AGC adjustment; PA is the target power for the i-th AGC adjustment.
2) Indirect benefits of reducing system coal costs
Energy storage assisted frequency regulation of thermal power units can reduce the output of the units, thereby reducing the fuel cost of the units. The calculation formula is:
In the formula: Et is the discharge quantity of energy storage frequency modulation on that day; Cfuel is the unit price of fuel; Wfuel is the amount of fuel required per unit of power generation.
3) Indirect benefits of reducing system power generation and emission costs
Due to the reduction in the output of thermal power units, which in turn reduces greenhouse gas emissions, it can be equivalent to reducing the indirect cost of power generation emissions. The calculation formula is:
In the formula, CNOx, CSO2, and CCO2 respectively represent the emission costs of nitrogen oxides, sulfur dioxide, and carbon dioxide required per unit of power generation.
2.2.4 Optimization Configuration Model Constraints
It is pointed out that the discharge time scale of lithium-ion batteries is from minute level to hour level, so the constraint conditions for capacity configuration are as follows.
The flywheel energy storage system has a fixed ratio between power and capacity based on the different charging and discharging times of specific products.
3. Solution method for multi-objective hybrid energy storage optimization configuration model
The established hybrid energy storage optimization configuration model is solved using multi-objective particle swarm optimization algorithm. Among them, the AGC instruction is decomposed and reconstructed into 9 schemes as shown in Table 2. Among them, H represents the high-frequency component assigned to the hybrid energy storage system, and L represents the low-frequency component assigned to the thermal power unit.
| Number\ IMF | 1 | 2 | 3 | 4 | 5 | 6 | 7 | 8 | 9 | 10 |
| 1 | H | L | L | L | L | L | L | L | L | L |
| 2 | H | H | L | L | L | L | L | L | L | L |
| 3 | H | H | H | L | L | L | L | L | L | L |
| 4 | H | H | H | H | L | L | L | L | L | L |
| 5 | H | H | H | H | H | L | L | L | L | L |
| 6 | H | H | H | H | H | H | L | L | L | L |
| 7 | H | H | H | H | H | H | H | L | L | L |
| 8 | H | H | H | H | H | H | H | H | L | L |
| 9 | H | H | H | H | H | H | H | H | H | L |
The traditional multi-objective particle swarm optimization algorithm uses the adaptive mesh method to search for the global optimal solution in the Pareto solution set, which has certain randomness. Therefore, this article uses the TOPSIS method to search for the global optimal solution in the Pareto solution set. The specific process is shown in equations (B9) – (B16) in Appendix B.
4. Example analysis
Based on the typical daily AGC command data of a 300 MW unit in a power plant in North China, this paper configures a hybrid energy storage system on the thermal power unit side. The system parameters are shown in Table A1 of Appendix A. The flywheel product model is QFFL500-3600-2/15C.
4.1 Hybrid energy storage control strategy considering SOC recovery
Firstly, verify the effectiveness and economy of the hybrid energy storage control strategy considering SOC recovery, and set the flywheel configuration to 15 MW/15 MWh; The battery configuration is 10 MW/25 MWh; According to the results of Table A2 in Appendix A, the AGC command allocation between thermal power and hybrid energy storage adopts Scheme 3 in Table 2. The specific decomposition results are shown in Figure A2 in Appendix A.
Based on the above capacity configuration and power instructions, compare the differences between the two strategies with and without SOC recovery in frequency modulation resource response, energy storage SOC changes, and various economic indicators.
4.1.1 Response of various frequency modulation resources and changes in SOC
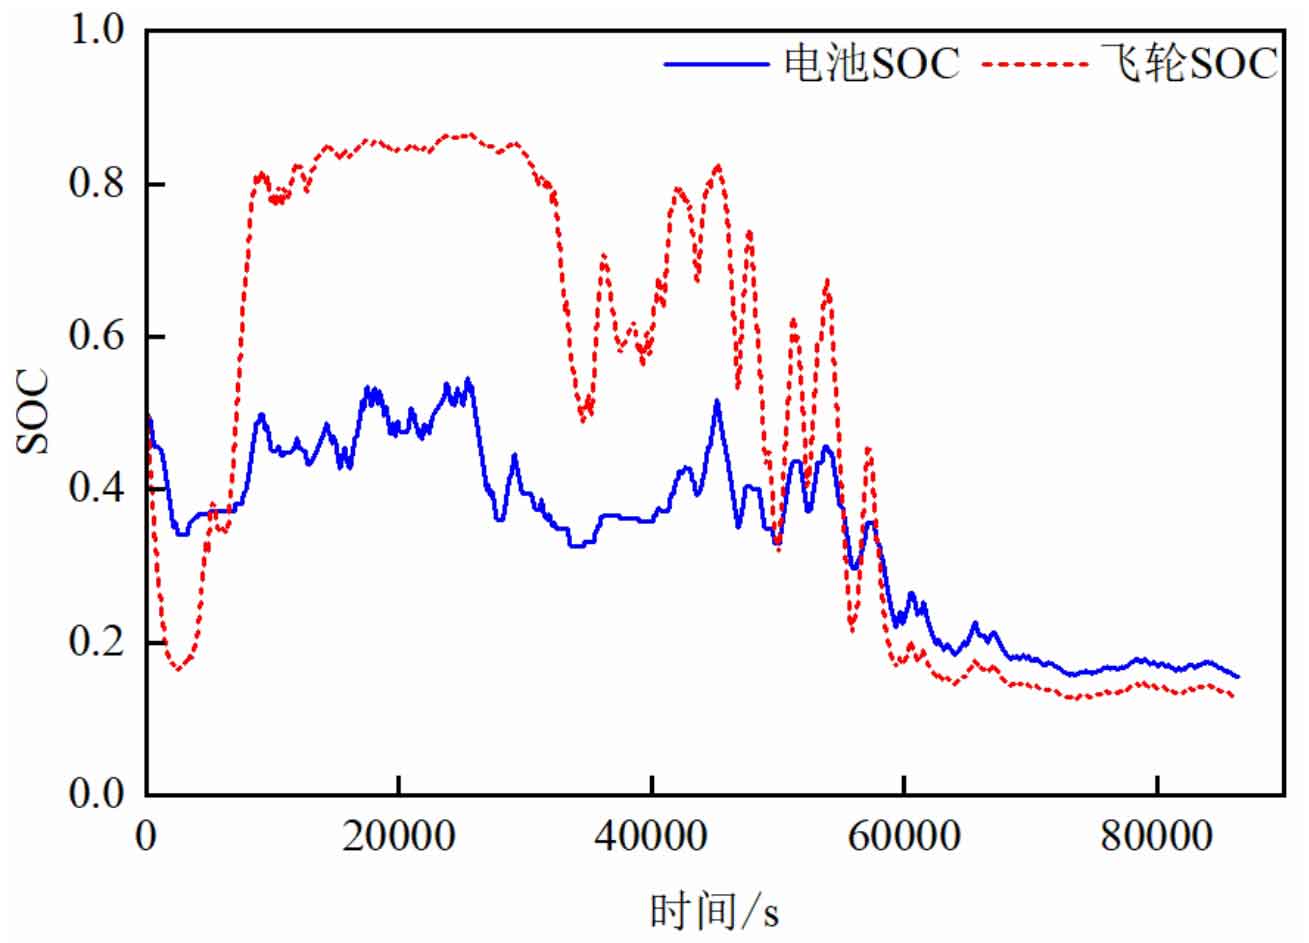
1) Excluding SOC recovery strategies
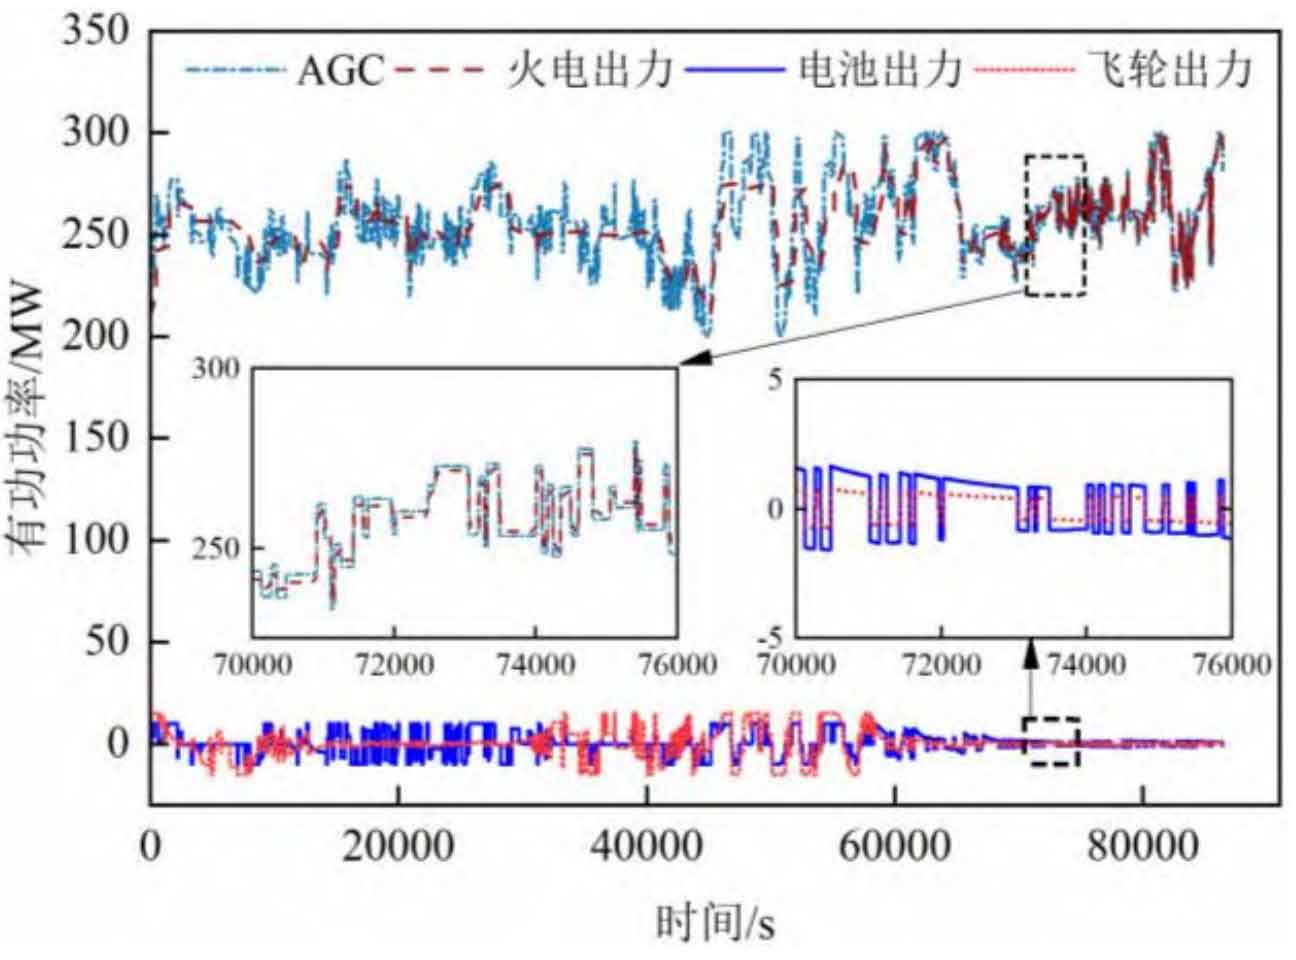
The output of each frequency modulation resource and the variation of mixed energy storage SOC without considering the SOC recovery strategy are shown in Figure 2 and Figure 3, respectively. From Figures 2 and 3, it can be seen that both the flywheel and battery SOC are in the optimal state at the beginning, with the flywheel acting first, the battery acting second, and the thermal power unit acting last, which can better track AGC commands. After approximately 60000 seconds, both the flywheel and battery SOC significantly decreased, and the output of the hybrid energy storage system decreased. The high and low frequency components of the AGC command were all responded to by the thermal power unit.
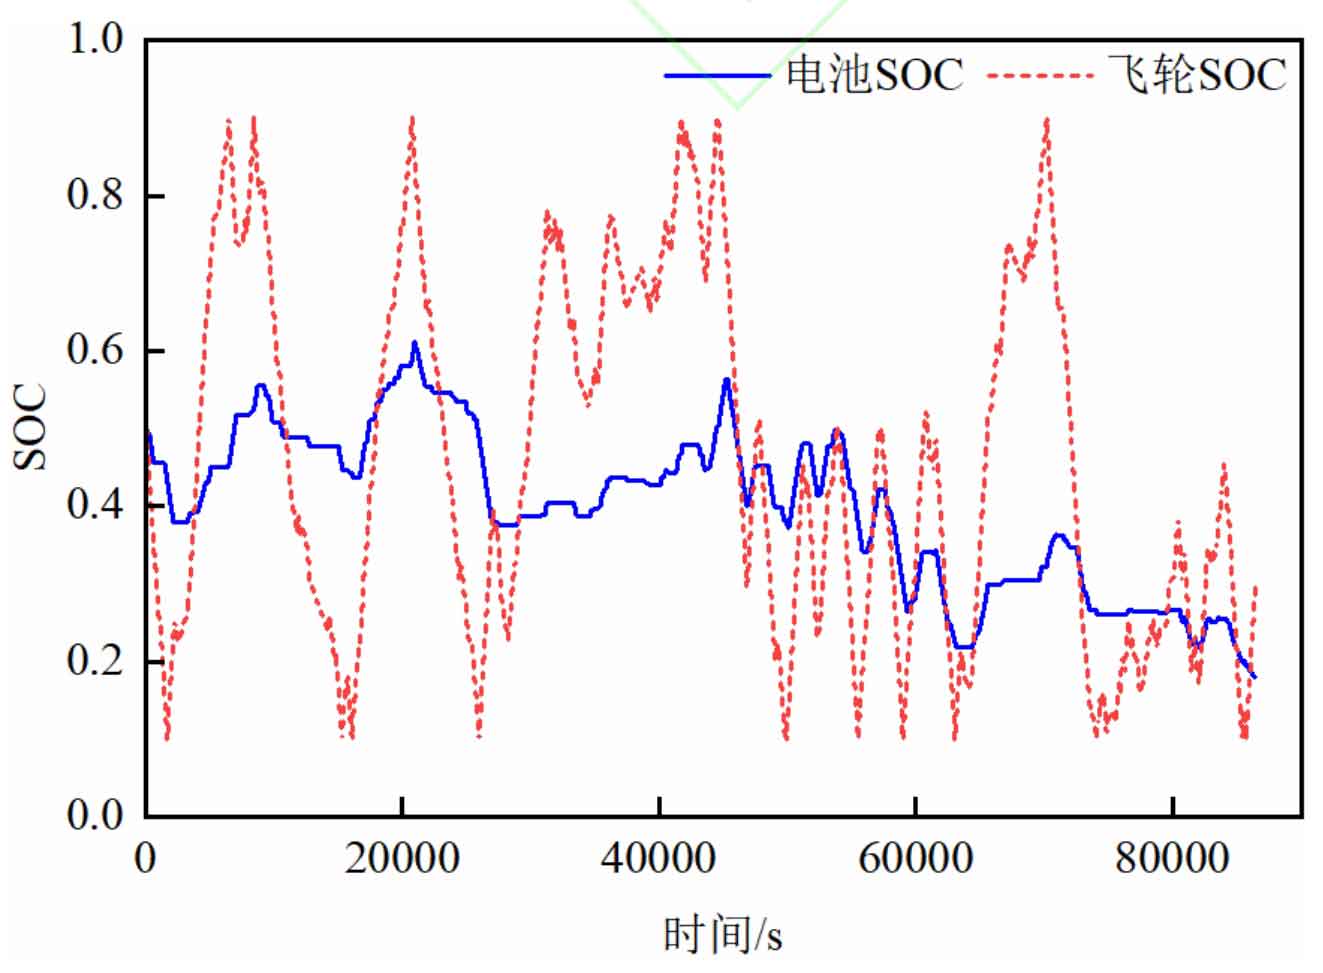
2) Considering the situation of SOC recovery strategy
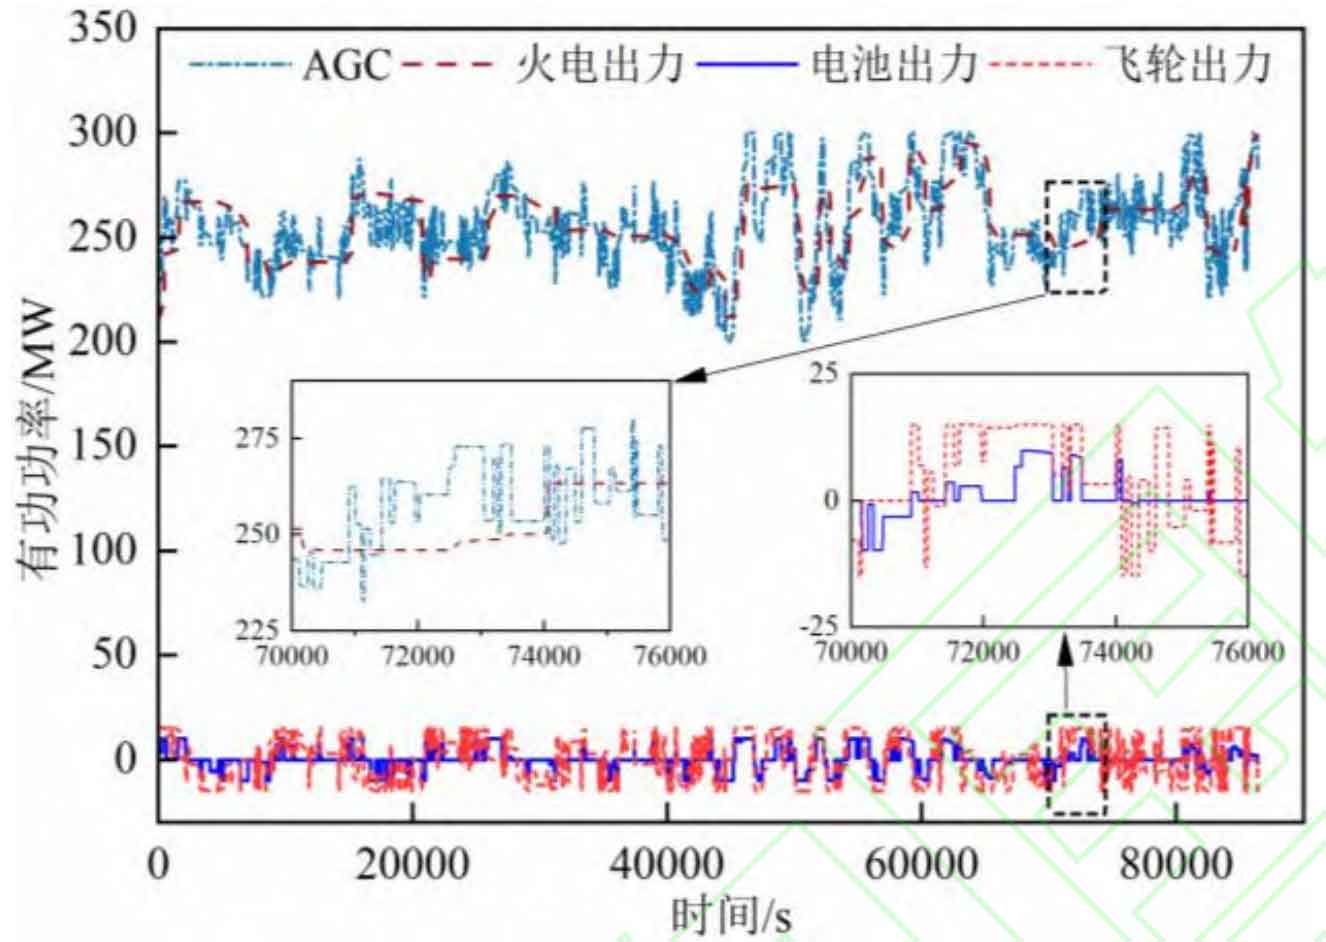
When considering the SOC recovery strategy, the output of each frequency modulation resource and the variation of mixed energy storage SOC are shown in Figure 4 and Figure 5, respectively. From Figures 4 and 5, it can be seen that the flywheel will pause response and begin to recover SOC when SOC is less than 0.1 or greater than 0.9, and the high-frequency component of AGC is responded to by the battery. The SOC state of the hybrid energy storage system did not show a monotonic decrease throughout the day as shown in Figure 3, and the output of the battery and flywheel did not show a decrease in output as shown in Figure 2. The above comparison proves the effectiveness of considering SOC recovery strategies.
3) Verification of the effectiveness of control strategies in the event of reverse regulation in thermal power units
In actual operation, when the output of traditional thermal power units approaches the target value again, there will be some oscillations, and even a reverse adjustment phenomenon. The effectiveness of the control strategy proposed in this paper during the reverse adjustment of thermal power units is demonstrated using the actual operating output and AGC instructions of the thermal power unit. The mixed energy storage output curve during the reverse adjustment of thermal power units is shown in Figure 6.
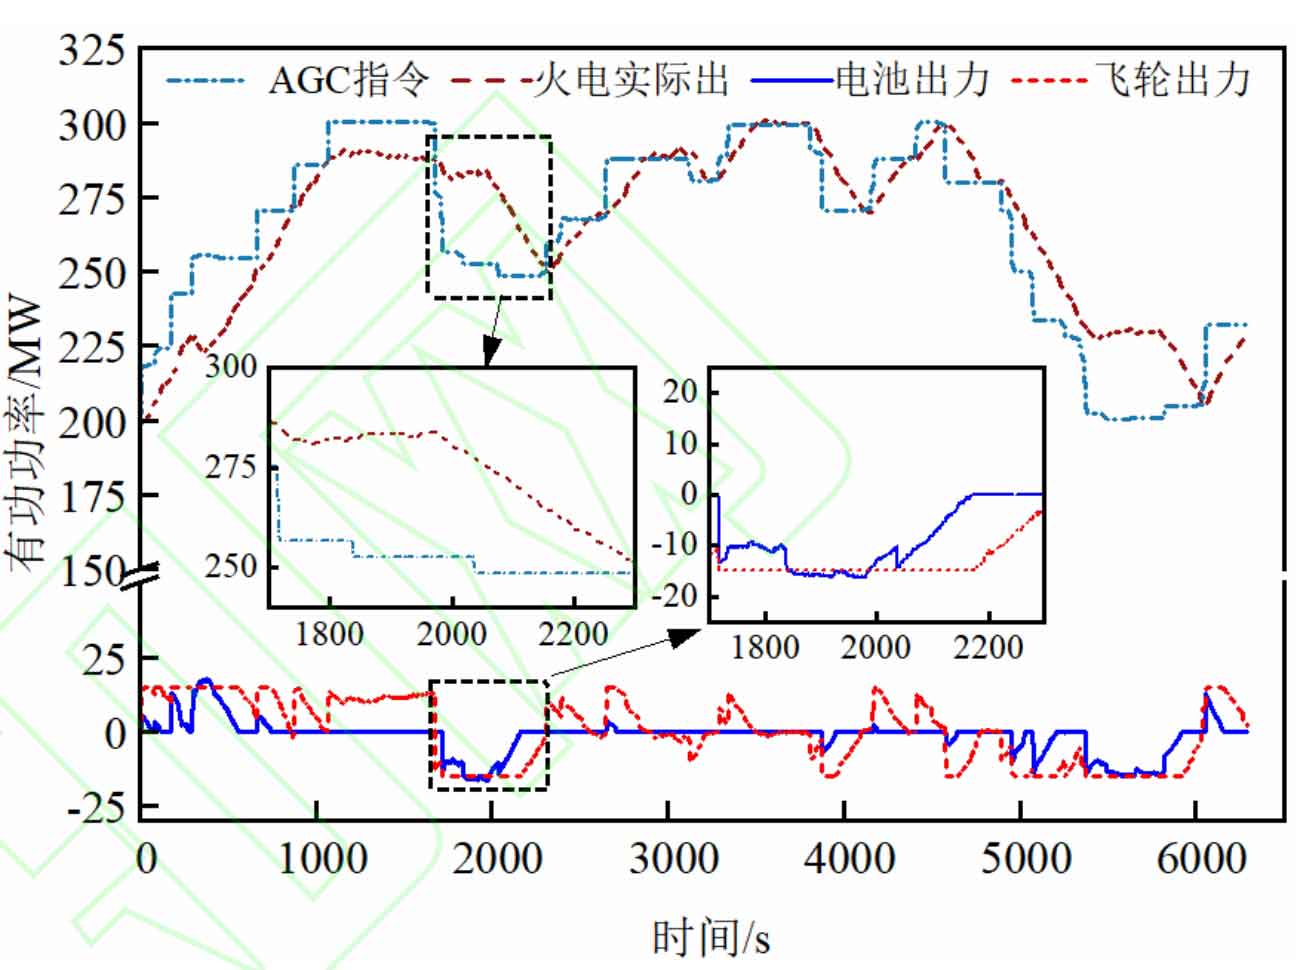
From Figure 6, it can be seen that the thermal power unit failed to track the AGC command in a timely manner between 1700 to 2300 seconds and 5400 to 6000 seconds, resulting in a reversal phenomenon. At this time, the hybrid energy storage system was charged in a timely manner, balancing the active power difference caused by the reversal in the thermal power unit. For example, the difference in maximum active power generated by reverse regulation between 1700 and 2300 seconds is 31.30 MW. At this time, the battery charging power is 16.05 MW, and the flywheel charging power is 15 MW, which can basically balance the deviation in active power generated by reverse regulation. This proves the effectiveness of the control strategy proposed in this paper in the case of reverse regulation of thermal power units.
4.1.2 Comparison of Key Economic Indicators
The comparison of key economic indicators with and without SOC recovery strategies is shown in Table 3.
| Cost | Mixed energy storage configuration with SOC recovery strategy | Hybrid energy storage configuration without SOC recovery strategy |
| Battery life/a | 6.21 | 2.34 |
| Frequency regulation loss of thermal power units/10000 yuan | 1.53 | 4.59 |
| Energy deviation penalty/10000 yuan | 22.22 | 62.86 |
| Total cost/100 million yuan | 2.47 | 3.35 |
| Total income/100 million yuan | 4.35 | 4.02 |
| Net income/10000 yuan | 18744 | 666.79 |
| Kp | 6.02 | 4.89 |
From Table 3, it can be seen that the control strategy that takes into account SOC recovery has increased the battery life from 2.34 years to 6.21 years compared to the control strategy that does not take into account SOC recovery; The frequency modulation performance index has been increased from 4.89 to 6.02; Net income increased from 6.6679 million yuan to 187 million yuan throughout the entire life cycle; In terms of reducing the loss of thermal power units, the control strategy proposed in this article reduces it by 67% compared to the strategy without considering SOC recovery. The above analysis proves that the control strategy proposed in this article can effectively improve the service life and economic benefits of batteries, and reduce frequency modulation losses of thermal power units.
4.2 Verification of Hybrid Energy Storage Capacity Configuration
According to Table 2, the AGC signal is decomposed and reconstructed into 9 schemes, and the hybrid energy storage optimization configuration model in this article is used for configuration. The fit degree of each scheme is calculated according to the TOPSIS method in Chapter 3, and the results are shown in Table A2 of Appendix A.
From the table, it can be seen that the highest fit degree of Scheme 3 is 0.59, so Scheme 3 is chosen as the best solution. The results of optimizing the configuration of a single energy storage using the same method are shown in Table 4, and compared with the strategies of no energy storage configuration and no SOC recovery, proving the effectiveness of the proposed method in this paper.
| Configuration method | Rated power of battery PbN/MW | Rated power of flywheel PfN/MW | Rated battery capacity Eb/MWh | Rated capacity of flywheel Ef/MWh |
| Hybrid energy storage configuration | 15.55 | 28 | 26.49 | 28 |
| Hybrid energy storage configuration without SOC recovery strategy | 48.11 | 64 | 12.92 | 64 |
| Single battery configuration | 58.13 | — | 42.92 | — |
| Single flywheel configuration | — | 44 | — | 44 |
The comparison of various economic indicators between energy storage configurations and non energy storage configurations, as well as the proportion of each cost in each configuration method, as well as the comparison of frequency regulation penalty costs and benefits, are shown in Tables 5 and 6, respectively. From Tables 5 and 6, it can be seen that:
| Economic indicators Single battery configuration | Single battery configuration | Single flywheel configuration | Hybrid energy storage configuration without SOC recovery strategy | Hybrid energy storage configuration in this article | No energy storage configuration |
| Battery life/a | 2.38 | 20.89 | 12.51 | ||
| Initial investment cost/100 million yuan | 0.81 | 2.31 | 3.76 | 1.87 | |
| Battery replacement cost/100 million yuan | 2.40 | 0 | 0.18 | ||
| Operation and maintenance cost/100 million yuan | 0.44 | 0.63 | 1.57 | 0.47 | |
| Battery scrap processing cost/10000 yuan | 166.90 | 13.70 | 20.09 | ||
| Cost of energy storage failure loss/10000 yuan | 2.07 | 2.08 | 2.10 | 2.08 | |
| Frequency regulation loss of thermal power units/10000 yuan | 0.96 | 0.94 | 0.19 | 0.68 | 12.15 |
| Energy deviation penalty/10000 yuan | 15.16 | 14.18 | 4.24 | 10.48 | 160.41 |
| Total cost/100 million yuan | 3.67 | 2.95 | 5.33 | 2.52 | 0.017 |
| Kp revenue/100 million yuan | 4.49 | 4.51 | 4.54 | 4.51 | 3.74 |
| Other income/10000 yuan | 13.00 | 73.70 | 91.93 | 0 | 0 |
| Total income/100 million yuan | 4.49 | 4.51 | 4.55 | 4.51 | 3.74 |
| Net income/100 million yuan | 0.83 | 1.57 | -0.78 | 2.00 | 3.72 |
| Kp | 6.71 | 6.77 | 6.92 | 6.76 | 4.12 |
| Cost and benefit indicators | Single battery | Single flywheel | Hybrid energy storage configuration without SOC recovery strategy | Hybrid energy storage configuration considering SOC recovery strategy |
| Initial investment cost/% | 22.08 | 78.53 | 70.52 | 74.11 |
| Battery replacement cost/% | 65.42 | 0 | 0 | 7.13 |
| Operation and maintenance cost/% | 11.99 | 21.42 | 29.45 | 18.63 |
| Battery scrap cost/% | 0.45 | 0 | 0.026 | 0.080 |
| Cost of energy storage failure loss/% | 0.0056 | 0.0071 | 0.0039 | 0.0082 |
| Thermal power frequency modulation loss/% | 0.0026 | 0.0032 | 0.00036 | 0.0027 |
| Energy deviation penalty/% | 0.041 | 0.048 | 0.0080 | 0.042 |
| Reduce the cost percentage of thermal power frequency modulation loss/% | 92.10 | 92.26 | 98.44 | 94.40 |
| Reduce energy offset cost percentage/% | 90.55 | 91.16 | 97.36 | 93.47 |
| Increase KP revenue percentage/% | 20.05 | 20.59 | 21.39 | 20.59 |
| Percentage decrease in net income/% | 77.69 | 57.79 | 120.97 | 46.24 |
1) Due to the high cost of hybrid energy storage systems, the net benefits of non energy storage configurations are still higher than those of other configurations even when the Kp frequency modulation benefits are less than the first four energy storage configurations. This indicates that the high cost of energy storage remains the main obstacle to its development. Under the same hybrid energy storage configuration, when the cost of lithium-ion batteries and flywheel energy storage is reduced to the level shown in Table 7, the net benefit is the same as that of the non energy storage configuration.
| Investment cost per unit power of battery/(10000 yuan · MW ^ -1) | Investment cost per unit energy of battery/(10000 yuan · MWh ^ -1) | Flywheel unit power investment cost/(10000 yuan · MW ^ 1) | Cost of a single flywheel/(10000 yuan · MWh ^ -1) |
| 20 | 28 | 15 | 48 |
2) Compared with the hybrid energy storage configuration without SOC recovery strategy, the total frequency regulation cost of the hybrid energy storage configuration in this article has decreased by 282 million yuan throughout its entire life cycle; Although the total revenue of FM decreased by 4.36 million yuan, the net revenue over the entire life cycle increased from -0.78 billion yuan to 200 million yuan. The main reason for this phenomenon is that the SOC free recovery strategy requires more energy storage to be configured while improving the frequency modulation Kp index. The high investment cost of hybrid energy storage results in its inability to make profits throughout its entire life cycle.
3) When using a single battery configuration, the replacement cost of the battery accounts for 65.42% of the total cost of full life frequency modulation. Compared with a single battery configuration, the hybrid energy storage configuration increases the lifespan of the lithium battery by about 5 times, effectively reducing the replacement cost of the battery. When a single flywheel configuration is used, the initial investment cost accounts for 78.53% of the total cost of full life frequency modulation. The lower investment cost of lithium batteries in hybrid energy storage results in a 45 million yuan decrease in the total cost of hybrid energy storage compared to a single flywheel configuration.
4) Due to the high frequency frequency regulation demand undertaken by the energy storage system, the output of thermal power units is smooth. A single battery and a single flywheel reduce the cost of thermal power frequency regulation by 92.10% and 92.26%, respectively, while hybrid energy storage reduces the cost of thermal power frequency regulation by 94.40%.
5) Each configuration scheme has increased the system Kp revenue by more than 20%. However, due to the limitations of high energy storage costs and the economic benefits of thermal power units themselves, compared to systems without energy storage configuration, each configuration energy storage scheme has reduced net revenue. Among them, the hybrid energy storage configuration without SOC recovery strategy has decreased the most, by 120.97%, while the hybrid energy storage configuration in this article has decreased the least, by 46.24%.
5. Conclusion
In response to the issue of improving the frequency regulation performance of thermal power plants and reducing the cost of energy storage configuration, this paper proposes a dual layer model for hybrid energy storage optimization configuration to assist the AGC of thermal power units. The main conclusions are as follows:
1) The thermal power hybrid energy storage AGC instruction allocation strategy based on EMD decomposition smoothes the output of thermal power units during the frequency regulation process, significantly reducing the frequency regulation loss of thermal power units; Compared with the control strategy that only limits energy storage output, the control strategy that takes into account SOC recovery improves frequency modulation performance while extending battery life.
2) The control strategy that takes into account SOC recovery can reduce the configuration capacity of hybrid energy storage, thereby improving the economy of the thermal power hybrid energy storage combined frequency modulation system.
3) Compared with a single battery configuration, the hybrid energy storage configuration improves the service life of the battery and reduces the replacement cost of the battery; Compared to a single flywheel configuration, it reduces the initial investment cost. While improving the Kp indicator, it also improves its economic efficiency.
4) At present, under the cost of energy storage, the net benefit of no energy storage configuration is still higher than that of thermal storage frequency modulation systems with energy storage. With the continuous reduction of energy storage costs, the economy of energy storage assisted frequency modulation for thermal power units will become better and better in the future.
Appendix A
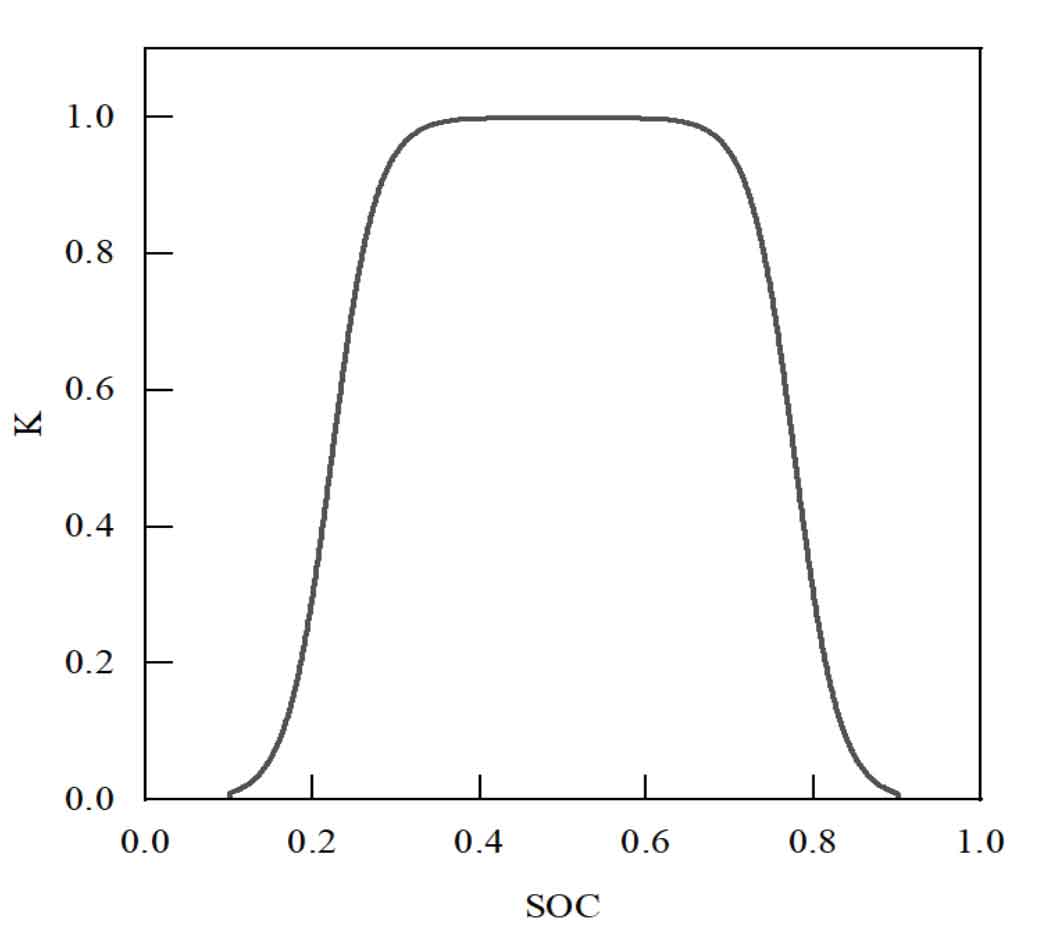
SOC in Figure A1 represents the state of charge of the battery for energy storage; K is the constraint coefficient of battery energy storage output.
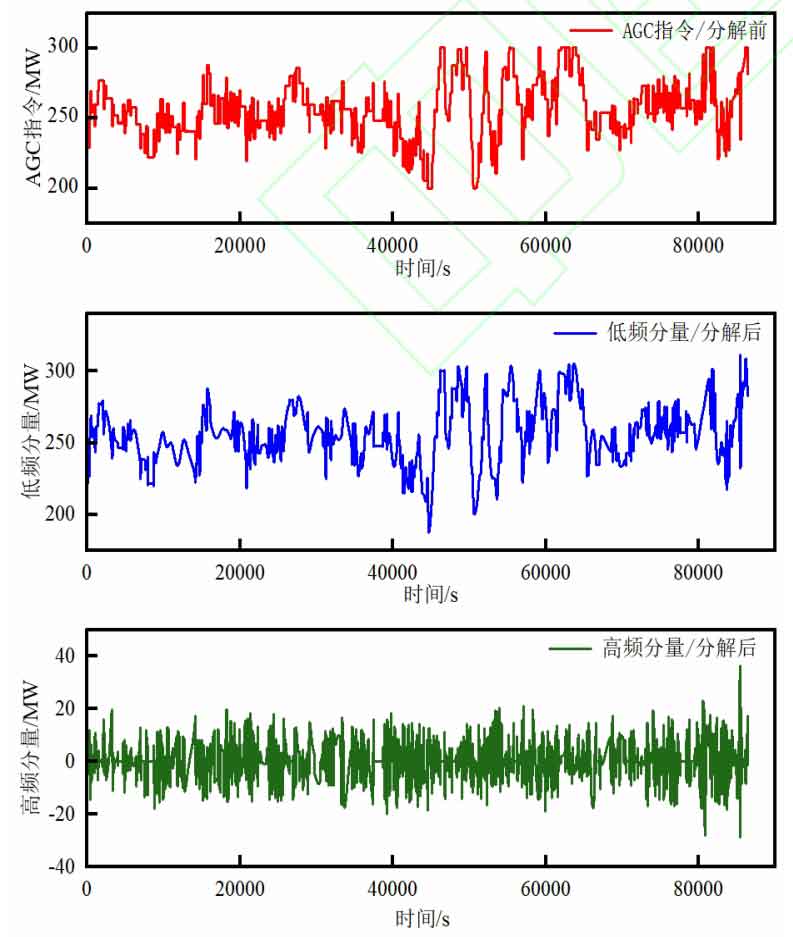
Figure A2 AGC signal EMD decomposition and reconstruction
| Parameter Name | Numerical value |
| Investment cost per unit power of battery CB P/(10000 yuan · MW ^ -1) | 50 |
| Investment cost per unit energy of battery CB E/(10000 yuan · MWh ^ -1) | 120 |
| Battery unit power operation and maintenance cost CB PO/(10000 yuan · MW ^ -1) | 6 |
| Battery unit energy operation and maintenance cost CB PO/(10000 yuan · MWh ^ -1) | 0.1 |
| Flywheel unit power operation and maintenance cost CFW PO/(10000 yuan · MW ^ -1) | 8 |
| Flywheel unit energy operation and maintenance cost CFW EO/(10000 yuan · MWh ^ -1) | 0.1 |
| Unit power scrap processing cost CPscr/(10000 yuan · MW ^ -1) | 0.72 |
| Unit energy scrap processing cost CEscr/(10000 yuan · MW ^ -1) | 0.72 |
| Annual average failure frequency of energy storage equipment NF/(times) | 0.033 |
| Average fault handling cost cF/(yuan · time ^ -1) | 600 |
| Annual power outage time of energy storage equipment Toff/(h) | 0.396 |
| Unit climbing loss cost χ/ (yuan · MWh ^ -1) | 63.5 |
| AGC compensation price YAGC/(yuan · MW ^ -1) | 5 |
| Penalty coefficient α/ (yuan · MWh ^ -1) | 30 |
| Unit price of fuel Cfuel/(yuan · t ^ -1) | 400 |
| Fuel required per unit power generation Wfuel (g · MWh ^ -1) | 350 |
| Unit discharge cost of nitrogen oxides CNOx/(yuan · MWh ^ -1) | 10.074 |
| Unit discharge cost of sulfur dioxide CSO2/(yuan · MWh ^ -1) | 2.671 |
| Carbon dioxide unit emission cost CCO2/(yuan · MWh ^ -1) | 18.669 |
| Serial number | PbN/MW | PfN/MW | Eb/MWh | Ef/MWh | Net income/100 million yuan | Kp indicator | Fit |
| 1 | 0.80 | 46 | 0.01 | 46 | 1.55 | 6.77 | 0.50 |
| 2 | 1.25 | 52 | 27.16 | 52 | 0.86 | 6.88 | 0.48 |
| 3 | 15.55 | 28 | 26.49 | 28 | 2.00 | 6.76 | 0.59 |
| 4 | 55.06 | 23 | 27.88 | 23 | 1.60 | 6.67 | 0.43 |
| 5 | 10.03 | 52 | 0.89 | 52 | 1.13 | 6.84 | 0.50 |
| 6 | 22.60 | 60 | 12.54 | 60 | 0.26 | 7.02 | 0.50 |
| 7 | 2.88 | 43 | 1.42 | 43 | 1.52 | 6.80 | 0.53 |
| 8 | 8.05 | 46 | 32.43 | 46 | 1.13 | 6.91 | 0.58 |
| 9 | 19.12 | 61 | 19.28 | 61 | 0.25 | 7.00 | 0.48 |
Appendix B
1.Mixed energy storage state transfer equation
1) Energy storage discharge status
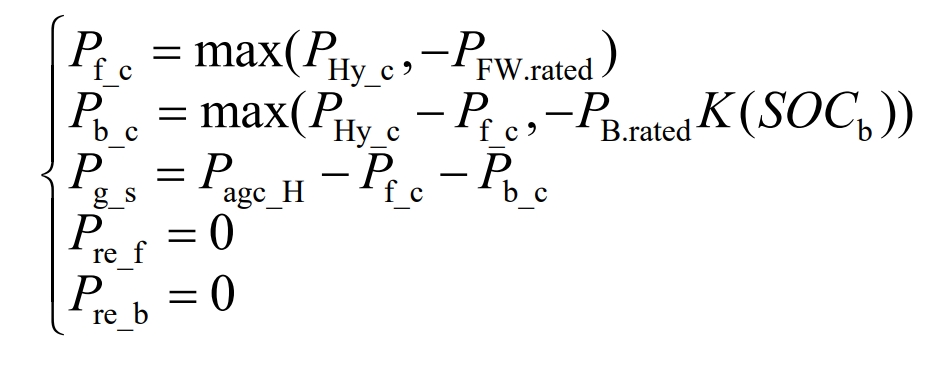
When the operating conditions of the hybrid energy storage system are S5, S6, S8, and S9, both the battery energy storage and flywheel energy storage have a large discharge capacity. At this time, the flywheel energy storage priority responds to the command. If the flywheel energy storage power is insufficient, the battery responds. If the flywheel and battery power are insufficient, the thermal motor unit adjusts them, which includes:
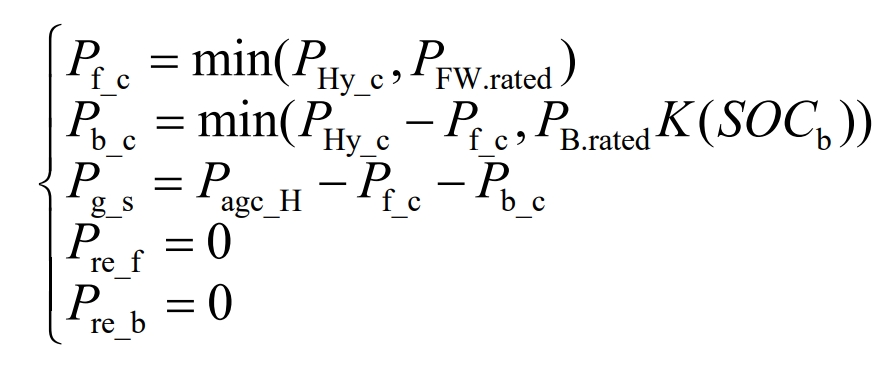
In the formula: Pf_ c. Pb_ c. Pg_ S is the flywheel energy storage output command, battery output command, and thermal power unit supplementary output command; Pre_ f. Pre_ B is the SOC recovery power command for flywheel energy storage and battery, respectively; PHy_ C represents the power command of the hybrid energy storage system in Figures 3 and 4.
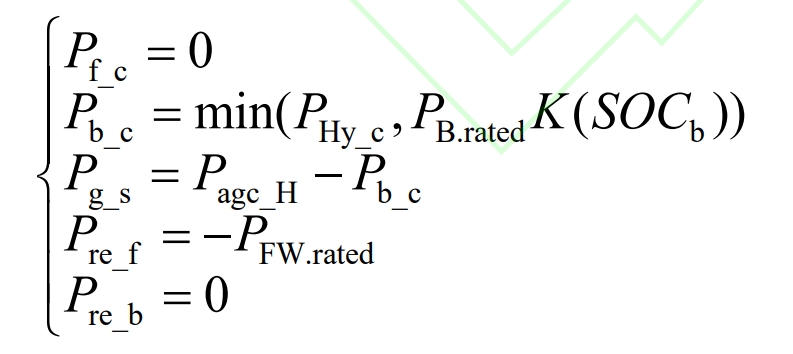
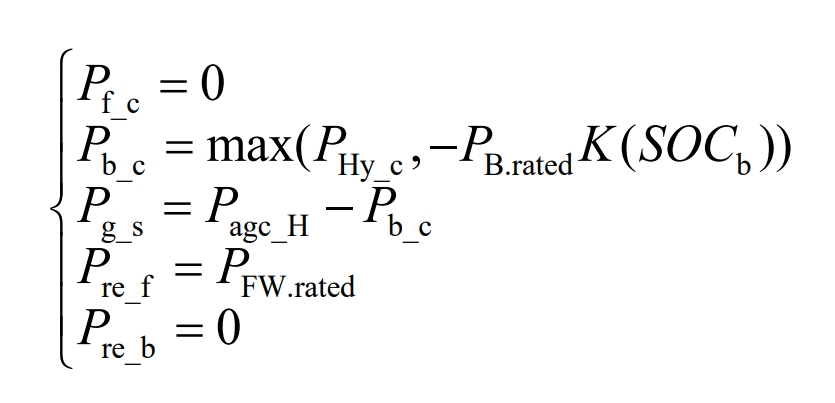
When the operating conditions of the hybrid energy storage system are S2 and S3, the battery has a large discharge capacity for energy storage, while the flywheel energy storage SOC is low. At this time, the battery prioritizes discharge, and the flywheel does not respond and recovers SOC at rated power through the thermal power unit. The thermal power unit participates in regulation when the battery discharge power is insufficient, namely:
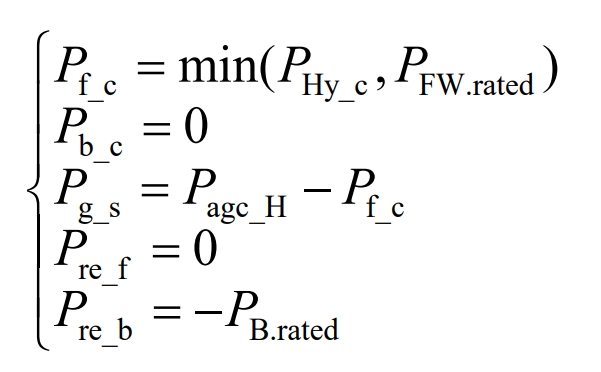
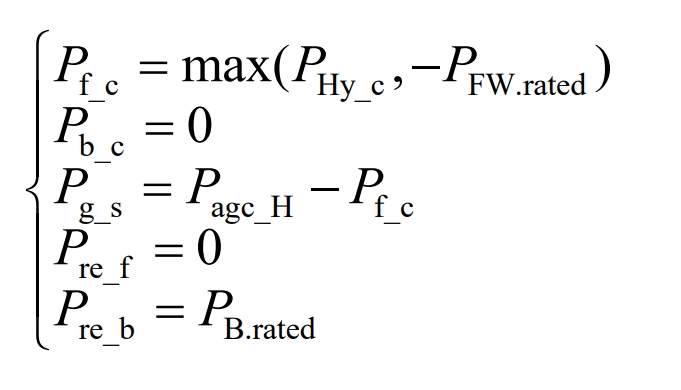
When the operating conditions of the hybrid energy storage system are S4 and S7, the flywheel energy storage has a large discharge capacity, while the battery SOC is low. At this time, the flywheel energy storage prioritizes discharge, and the battery does not respond and recovers SOC at rated power through the thermal power unit. The thermal power unit participates in regulation when the flywheel discharge power is insufficient, namely:
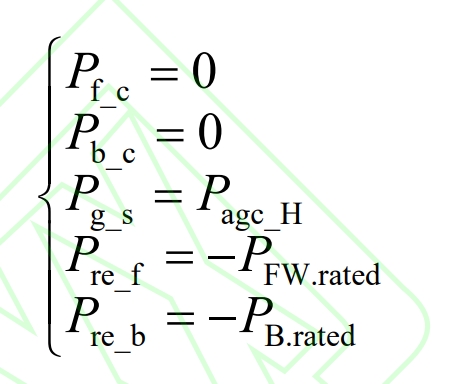
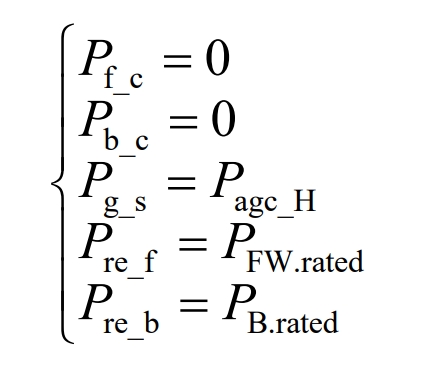
When the operating condition of mixed energy storage is S1, the SOC of the battery and flywheel are both low and cannot respond to discharge commands. The mixed energy storage is restored to SOC through the thermal power unit, and at this time, the power of the thermal power unit is increased for adjustment, namely:
2) Energy storage charging state
When the operating conditions of the hybrid energy storage system are S1, S2, S4, and S5, both the battery energy storage and flywheel energy storage have a large charging capacity. At this time, the flywheel energy storage priority responds to the command. If the charging power of the flywheel energy storage is insufficient, the battery responds. If the charging capacity of the flywheel and battery is insufficient, the thermal power unit adjusts it, namely:
When the operating conditions of the hybrid energy storage system are S7 and S8, the battery has a large charging capacity for energy storage, while the SOC of the flywheel energy storage is relatively high. At this time, the battery prioritizes charging, and the flywheel does not respond and recovers the SOC at rated power through a discharge resistor. Thermal power units participate in regulation when the battery charging power is insufficient, namely:
When the operating conditions of the hybrid energy storage system are S3 and S6, the flywheel energy storage has a large charging capacity, while the battery SOC is relatively high. At this time, the flywheel energy storage prioritizes charging, and the battery does not respond and recovers SOC at rated power through discharge resistance. Thermal power units participate in regulation when the flywheel charging power is insufficient, namely:
When the operating condition of the hybrid energy storage system is S9, both the battery and flywheel SOC are high and cannot continue to respond to charging commands. The hybrid energy storage recovers SOC through discharge resistance, and at this time, the power of the thermal power unit is reduced for adjustment, namely:
2. Method of distance between superior and inferior solutions
1) Convert all indicators into extremely large indicators and optimize them
Objective function 1 is:
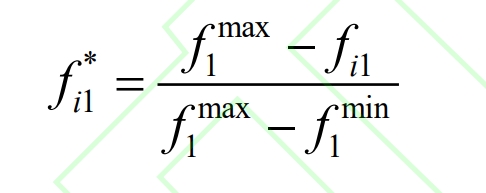
In the formula, fi1 is the value of the objective function 1 of the i-th scheme; F1max is the maximum value of objective function 1 in all schemes; F1min is the minimum value of objective function 1 in all schemes; Fi1 * is the converted value of objective function 1 for the i-th scheme.
Objective function 2 is:
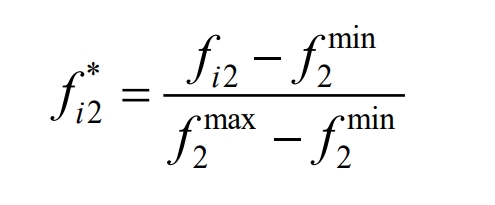
In the formula, fi2 is the value of objective function 2 for the i-th scheme; F2max is the maximum value of objective function 2 in all schemes; F2min is the minimum value of objective function 2 in all schemes; Fi2 * is the converted value of objective function 2 for the i-th scheme.
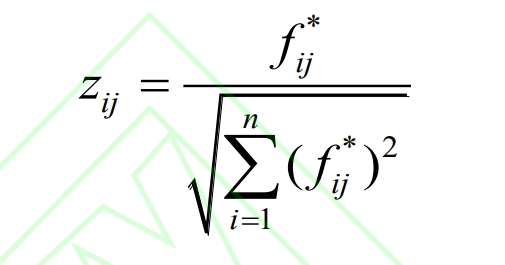
2) Standardize the forward matrix formed in the first step
The forward matrix is:
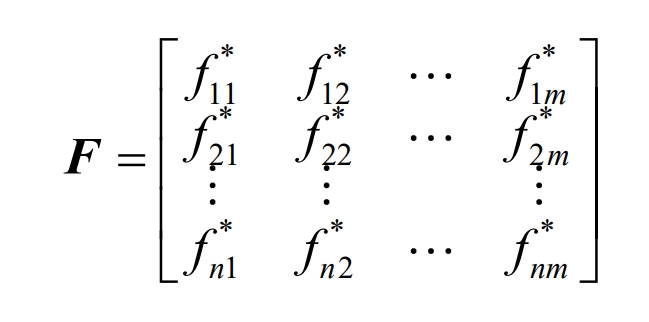
The standardized calculation formula is shown in equation (B12).
3) Calculate the distance between the index and the maximum and minimum values, as well as the fit of the index
Define maximum value:
Define minimum value:
The distance between the evaluation index and the maximum value is:
The distance between the evaluation index and the minimum value is:
The fit of each particle is:
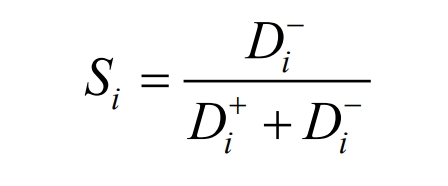
Calculate the fitting degree Si of each particle, and the larger the value, the better. Select the particle with the largest Si as the global optimal value.
Appendix C
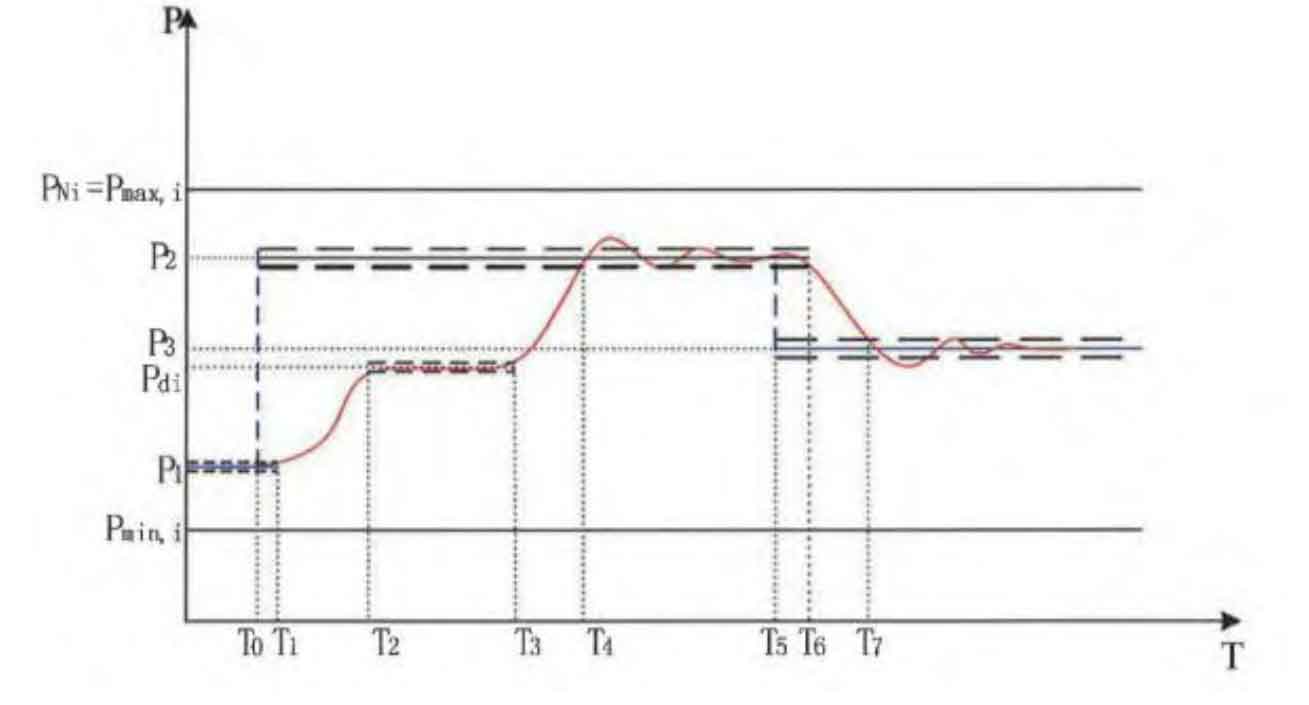
In Figure C1, Pmin and i are the adjustable lower limit output of the unit, Pmax and i are the adjustable upper limit output, PN and i are the rated output, and Pd and i are the critical point power for starting and stopping the mill.
(1) Frequency modulation rate
The adjustment rate refers to the rate at which the unit responds to the set point command, which can be divided into an increase rate and a decrease rate. The calculation process of the jth adjustment rate assessment index for the i-th unit is as follows:
The actual adjustment rate calculation formula is as follows:
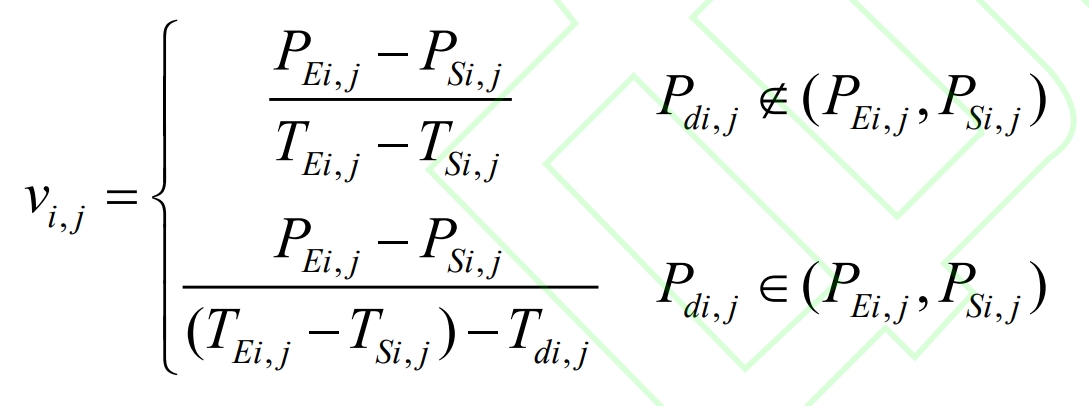
In the formula, vi, j are the jth adjustment rate (MW/minute) of unit i, PEi, j are the output (MW) of its end response process, PSi, j are the output (MW) of its start action, TEi, j are the end time, TSi, j are the start time, Pdi, j are the critical point power (MW) of the jth adjustment start stop grinding, Tdi, j are the actual consumption time of the jth adjustment start stop grinding. When the unit does not meet the typical AGC set point control process (when it fails to enter the target dead zone), the adjustment rate is the amount of active change in the unit output at the end of the command minus the output at the time of crossing the dead zone divided by the required time.
The calculation formula for the adjustment rate adjustment index is:
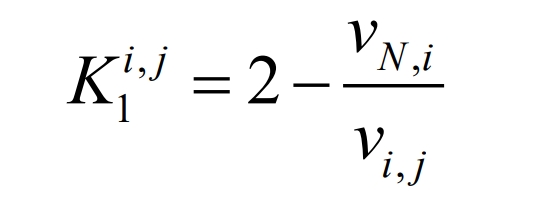
If the calculated values of K1i and j are less than 0.1, then take 0.1.
In the formula: vN, i is the standard adjustment rate of unit i, in MW/minute. If the unit enters deep adjustment conditions with rated output below 50%, the AGC adjustment rate is required to be 80% of the conventional adjustment rate.
(2) Adjusting accuracy
Adjustment accuracy refers to the difference between the actual output and the set point output after the unit responds stably. Integrate the absolute value of the difference between the actual output and the command, and then divide the integral by the integration time to obtain the adjustment deviation for that period.
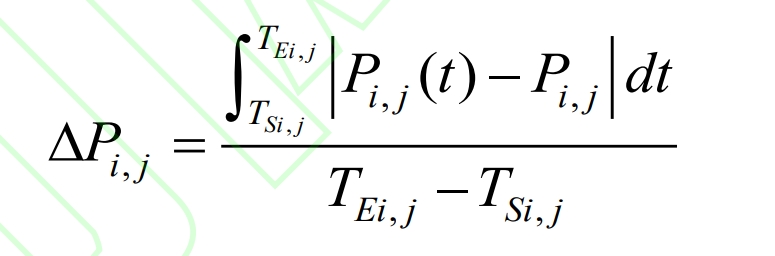
In the formula: Pi, j (t) are the actual output of the period, Pi, j are the set point instruction values obtained for the period, TEi, j are the end points of the period, TSi, j are the starting points of the period. If the unit fails to enter the target dead zone, the adjustment accuracy is the minimum deviation between the actual output and the target output during the time period from crossing the same direction dead zone to the end of the command.
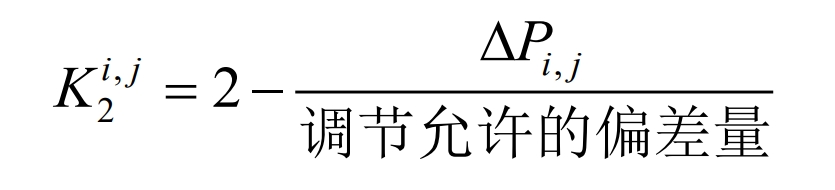
In the formula, the allowable deviation for adjustment is 1% of the rated active power of the unit. When the unit enters a deep regulation condition with a rated output of less than 50%, the AGC regulation accuracy is required to be 125% of the conventional regulation.
(3) Response time
Response time refers to the time it takes for the unit to reliably cross the frequency modulation dead band that is consistent with the regulation direction at the original output point after the EMS system issues a command.
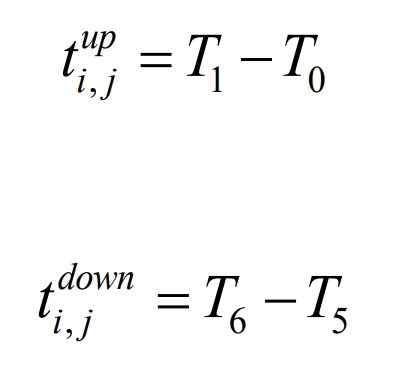
The AGC response time of thermal power units should be less than 1 minute. When the unit enters a deep regulation condition with a rated output of less than 50%, the AGC response time is 125% of that of a conventional unit.
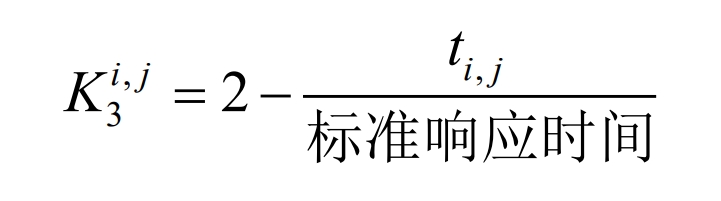
When the calculated values of K1, K2, and K3 are less than 0.1, they are all taken as 0.1.