
A simulation analysis was conducted on the air cooling and heat dissipation performance of a single-layer battery cabinet. This is based on the fact that each layer of the battery cabinet has independent air intakes, and the heat dissipation of each layer of the battery pack is the same, which can simplify the research content. This chapter proposes separate air supply for each battery cabinet, which means that each battery cabinet has only one air supply outlet. The advantage is that it can simplify the layout of the air duct, make it easier to control the airflow distribution, and reduce the number of fan devices. For multi-layer battery cabinets, experiments were first established to verify the flow field inside the cabinet, ensuring the accuracy of simulation results. Then, the effects of different air supply methods, the number of batteries in each layer, and the number of battery cabinet layers on heat dissipation performance were simulated and analyzed.
1. Air cooling and heat dissipation model for multi-layer battery cabinets
1.1 Physical model of battery cabinet
The battery cabinet is divided into three layers, with a battery pack module placed in the center of each layer. Each battery pack is composed of six individual lithium-ion batteries connected in series. The parameters of a single lithium-ion battery are the same as the above research. Due to the fact that the multi-layer battery cabinet contains a larger number of lithium-ion batteries, in order to simplify calculation, improve grid quality, and shorten calculation time, the pole part is ignored during 3D modeling, and the battery is simplified as a battery cell. Its thermophysical properties are shown in Table 2-1. Simplify the heat dissipation model of the battery cabinet as a velocity inlet and a pressure outlet. Due to the small impact of the battery rack and fastening bolts on the air flow field and heat transfer process, they are ignored in CFD simulation. The simplified model is shown in Figure 1.
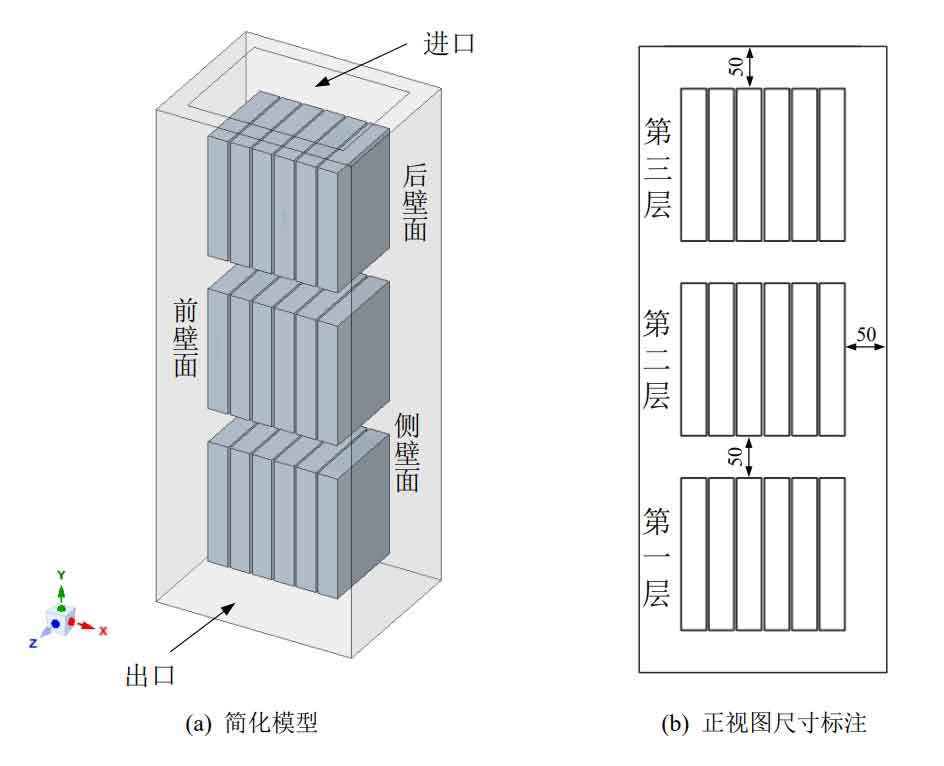
The battery cabinet is divided into the first layer, second layer, and third layer from bottom to top. The gap between individual batteries is 3mm, and the distance between the battery pack and the wall of the battery cabinet, as well as between the battery pack and the battery pack, is 50mm.
1.2 Numerical Calculation Settings
The three-dimensional geometric model is meshed, and due to the omission of the pole part of the lithium-ion battery, the model structure is simple, and unstructured mesh generation is used, resulting in high quality mesh generation. Import the grid model into CFD software for simulation calculation. The model is based on a pressure solver and is solved in a transient manner. The diffusion term is discretized using a second-order upwind scheme, while the transient term is discretized using a first-order implicit scheme. Considering the influence of gravity on heat dissipation, the gravity magnitude along the y-direction is -9.81m/s2, and the selection standard for turbulent flow is k- ε Model.
The air flow follows the laws of mass conservation, momentum conservation, and energy conservation. The mathematical expression of the control equation is shown in the formula, and the energy conservation equation during the discharge process of lithium batteries is shown in the formula. Due to the simplification of the modeling process in this chapter and the omission of the influence of heat generation by the battery poles, the heat calculation formula is used to define the battery heat source. The heat calculation formula is expressed as follows:
In the formula, Cp, b are the specific heat capacity of the battery, J/(kg Å K); M is the mass of the battery, kg; Δ T is the temperature difference before and after discharge, K; T is the discharge time, s; Q is the heat generation rate of the battery, W; Vb is the battery volume, m ^ 3; Q is the bulk heat source, W/m ^ 3.
The specific heat capacity Cp, b, mass m, and volume Vb of the battery are known. The temperature difference Δ T before and after discharge is determined by the discharge experiment of a single battery, and the discharge time t is determined by the discharge rate. The calculation results of the body heat source at 1C, 2C, and 3C discharge rates are shown in Table 1.
| Discharge rate | 1C | 2C | 3C |
| Q (W/m3) | 2819.9 | 14658.4 | 37959.2 |
The inlet is a velocity inlet boundary condition, the outlet is a pressure outlet boundary condition, and the outlet pressure is a standard atmospheric pressure. The wall surface of the battery cabinet is set to be insulated, ignoring heat exchange with the outside world; The wall surface is relatively non slip. The inlet temperature, ambient temperature, and the initial temperature of the entire battery cabinet and battery are all set to 25 ℃.
2. Battery Cabinet Flow Field Verification
2.1 Construction of Air Cooling and Heat Dissipation Experimental Platform for Battery Cabinet
In order to verify the accuracy of CFD simulation, an air-cooled heat dissipation experiment was conducted on the battery cabinet to verify the flow field and heat transfer inside the cabinet. Due to practical constraints, the discharge experiment of the battery pack is difficult to achieve. In this paper, an electric heating rod is used to heat the aluminum block to simulate the heat generation behavior of the battery discharge process. The experimental system diagram is shown in Figure 2.
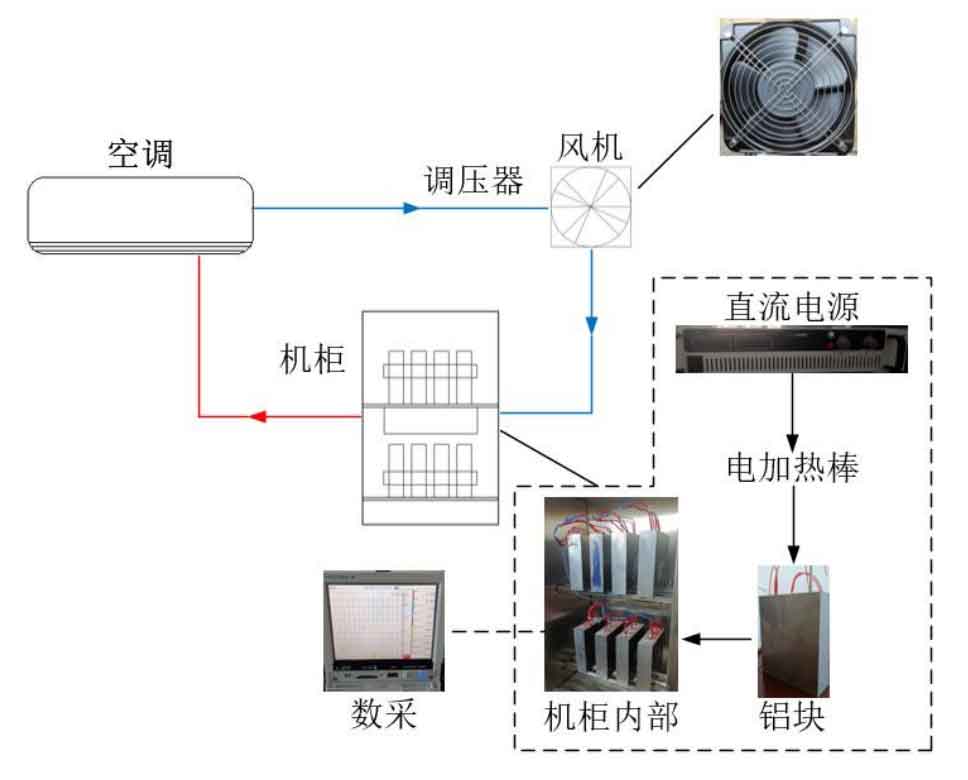
The cabinet is divided into two layers, with four aluminum blocks placed in the center of each layer, with an aluminum block size of 55mm × 175mm × 200mm, with a spacing of 30mm between adjacent aluminum blocks. The battery pack simulated by four aluminum blocks is 100mm away from each wall of the cabinet, and the distance between the battery pack and the cabinet is 150mm. The cabinet is equipped with two air intakes, each with a size of 50 × 350mm, air outlet located on the back of the battery cabinet, size 100 × 350mm. The cabinet is placed indoors, and the indoor temperature is adjusted by air conditioning with a control accuracy of ± 0.5 ℃. The fan blows cold air into the cabinet, exchanges heat with the aluminum block, and then exhausts it from the air outlet. The wind speed is adjusted by the voltage regulator. Insert three electric heating rods into each aluminum block, and the heating power is adjusted by a DC power supply.
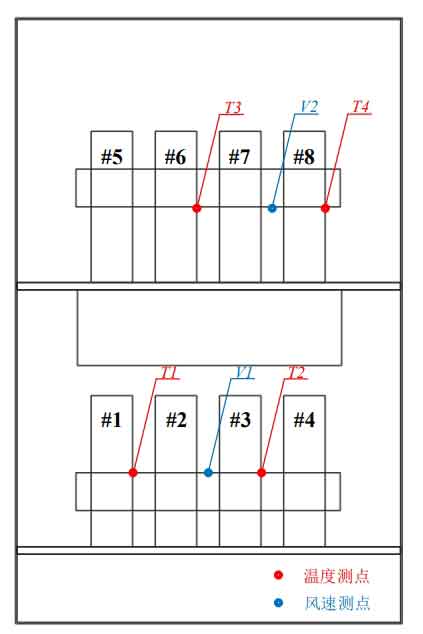
The location of cabinet temperature and wind speed measurement points is shown in Figure 3. The aluminum blocks inside the cabinet are numbered # 1~# 8 from left to right and from bottom to top, with thermocouples T1, T2, T3, and T4 arranged at the center of the right surface of batteries # 1, # 3, # 6, and # 8; The wind speed measurement points V1 and V2 are arranged in the center of the gap between batteries # 2- # 3 and # 7- # 8.
Adjust the indoor air conditioning to 20 ℃ and start the experiment when all temperature measurement points are at 20 ℃. Firstly, turn on the fan and adjust the inlet wind speed to 1m/s through a voltage regulator. Then, turn on the DC power supply and adjust it to a heating power of 25W for each aluminum block. Start recording data and record the temperature measurement points every 1s. After the wind speed measurement values stabilize, record the wind speed data. The verification time is 3600s. Change the inlet wind speed to 2m/s and 3m/s, repeat the experiment, and add a set of natural convection experiments, that is, turn off the fan, open the cabinet door, and also record the data of each temperature measurement point.
2.2 Verification Results of Air Cooling and Heat Dissipation Model for Battery Cabinet
Establish a three-dimensional geometric model based on the dimensions of the experimental cabinet and perform grid partitioning. The control equation and boundary conditions are the same as the description, and will not be elaborated here. Ensure that the experimental settings are the same, and the initial conditions are set at 20 ℃ for both the aluminum block and the air inside the cabinet. The comparison between the temperature variation curve of each measuring point measured in the experiment and the CFD simulation results is shown in Figure 4.
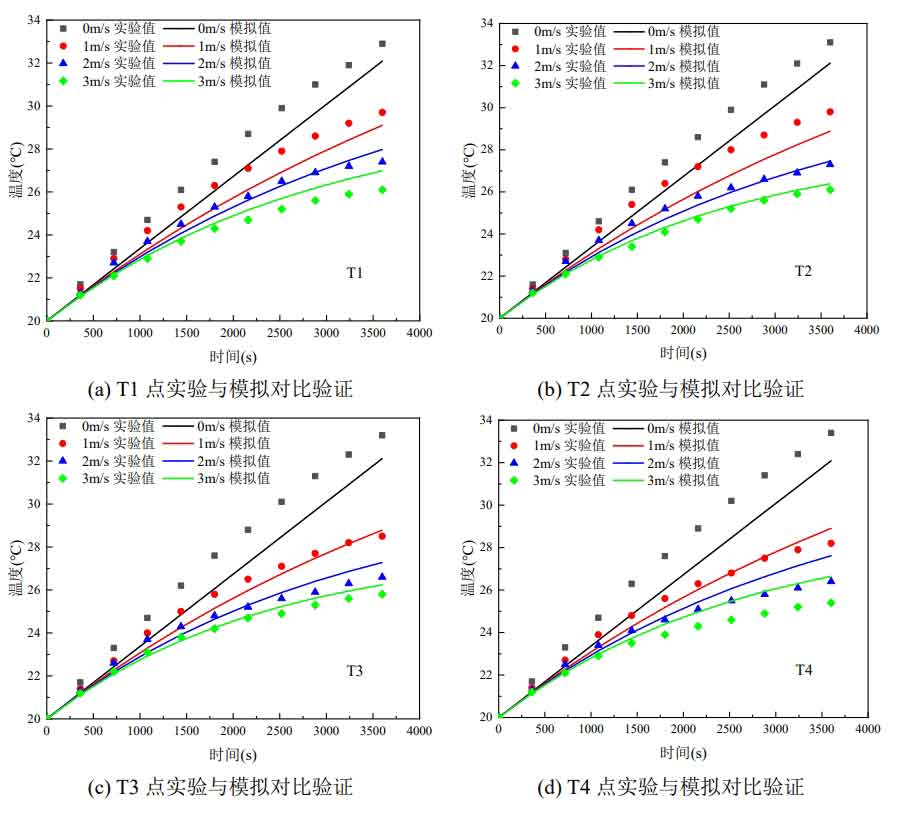
From Figure 4, it can be seen that the experimental results have the same trend as the CFD simulation curve. At each wind speed, the maximum error between the simulated and experimental values at each measurement point is only 1.2 ℃, which appears at the center of the geometric surface on the right side of battery # 8 at a wind speed of 3m/s. The experimental and simulation results of V1 and V2 measurement points at an inlet wind speed of 2m/s are listed in Table 2.
| Wind speed measuring point | Experimental value (m/s) | Analog value (m/s) | Relative error (%) |
| V1 | 1.822 | 1.729 | 5.1 |
| V2 | 1.618 | 1.691 | 4.5 |
From Table 2, it can be seen that the relative errors between the simulated and experimental values of the two wind speed measurement points are only 5.1% and 4.5%, respectively. The temperature and wind speed errors are within the allowable range, so it can be considered that the CFD simulation model for air-cooled battery cabinets is reasonable and effective.
3. Effects of different factors on heat dissipation performance
When measuring the heat dissipation performance of the battery cabinet, the main considerations are the maximum temperature and maximum temperature difference. In addition, due to the larger number of batteries in the battery cabinet, the average temperature of the battery cabinet can also reflect the overall heat dissipation performance. In addition, the volume energy density of different arrangements was also considered.
The maximum temperature Tmax of the battery cabinet is defined as the highest temperature of all batteries in the battery cabinet, and the expression is as follows:
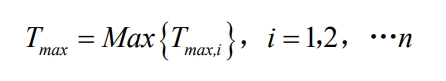
In the formula, Tmax, i is the highest temperature of all batteries in the i-layer battery pack, ℃; N is the number of battery cabinet layers.
Define maximum temperature difference Δ Tmax is the maximum temperature difference of each layer of battery pack, expressed as follows:
In the equation, Δ Tmax, i is the maximum temperature difference between all batteries in the i-th layer battery pack, ℃; N is the number of battery cabinet layers.
Define Tave as the average temperature of the battery cabinet, which is the average temperature of all batteries inside the cabinet. The volume energy density Ev of the battery cabinet is the same as described in the previous chapter. The lower the maximum temperature Tmax and average temperature Tave of the battery cabinet, the better the heat dissipation performance; Maximum temperature difference Δ The lower Tmax, the better the temperature consistency; The larger the volume energy density Ev, the smaller the occupied space.
3.1 The impact of different air supply methods on heat dissipation
Firstly, perform CFD simulation analysis on individual air supply for each layer and overall air supply for the battery cabinet, and compare the heat dissipation of the battery cabinet under three air supply methods: single-layer air supply, top air supply, and bottom air supply. The difference in the single-layer air supply model structure is that the pole part of the lithium-ion battery is omitted when modeling; The top air supply model is shown in Figure 1. The structure of the bottom air supply model and the top air supply model is the same, with the only difference being that the inlet of the bottom air supply model is located at the bottom of the battery cabinet, and the top of the battery cabinet is an air outlet. The dimensions of the inlet and outlet are the same as those of the top air supply model.
The discharge rate of the battery pack is set to 3C, the inlet flow rate of the single-layer air supply model is set to 0.1m ^ 3/s, and the top and bottom air supply models are 3-layer battery cabinets. To ensure effective comparison, the inlet flow rate should be kept the same, set to 0.3 m ^ 3/s. The battery cabinet walls are assumed to be insulated and do not undergo heat exchange with the outside world. The ambient temperature and inlet temperature are both set to 25 ℃. The simulation results of different air supply modes are shown in Table 3.
| Air supply method | Tmax/℃ | Δ Tmax/℃ | Tave/℃ |
| Single layer air supply | 36.9 | 5.6 | 35.1 |
| Top air supply | 39.9 | 9.2 | 36.0 |
| Bottom air supply | 39.9 | 9.4 | 35.7 |
From Table 3, it can be clearly seen that the single-layer air supply method has significant advantages in heat dissipation of the battery cabinet, with the highest temperature Tmax and maximum temperature difference Δ The Tmax is 3.0 ℃ and 3.6 ℃ lower than the top air supply model, respectively. When multi-layer battery cabinets dissipate heat, the air flow distance is farther than when single-layer air supply is used, and the heat dissipation conditions of battery packs near the outlet are poor, resulting in higher Tmax; The battery pack close to the air inlet has the best heat dissipation conditions, but it can also cause the minimum temperature of the battery pack to be very low, which is easy to cause Δ Tmax is relatively large.
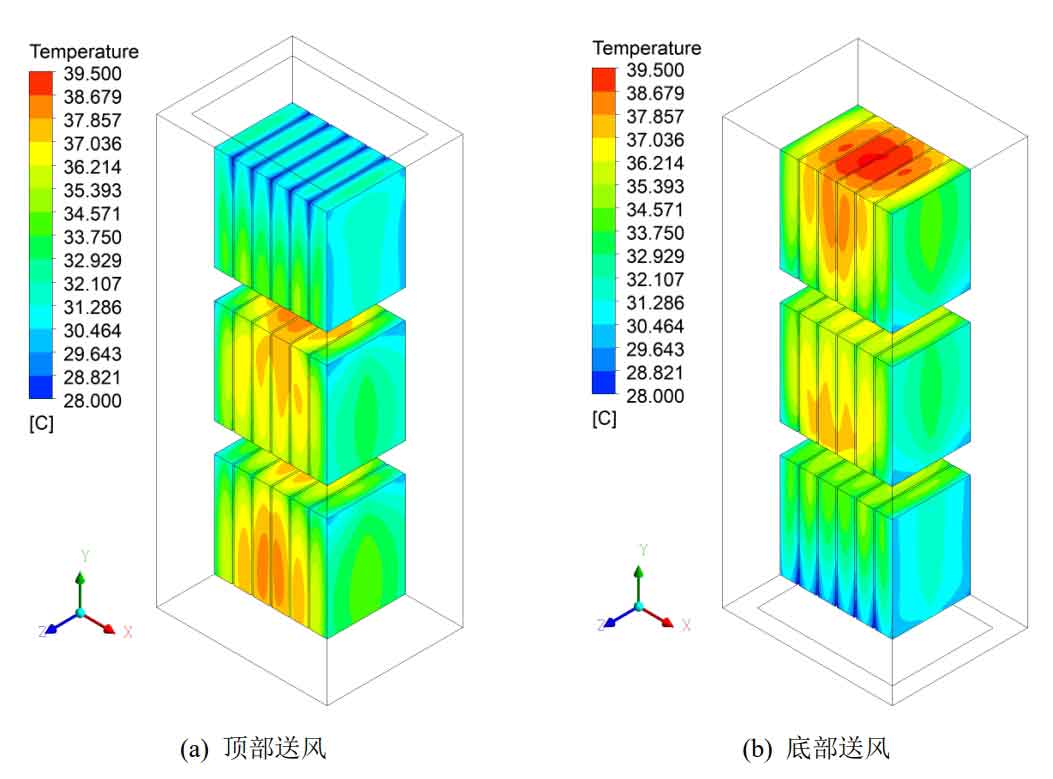
Different air supply methods have little effect on the average temperature Tave of the battery pack. The Tave of the single-layer air supply model is only 0.9 ℃ and 0.4 ℃ lower than the top air supply and bottom air supply, respectively. The heat dissipation performance of the top and bottom air supply models is basically the same, with Tmax of 39.9 ℃ Δ Tmax is 0.2 ℃ lower than the bottom air supply model, and Tave is 0.3 ℃ higher than the bottom air supply model. The simulated temperature distribution cloud map is shown in Figure 5 by comparing the top air supply and bottom air supply.
From the figure, it can be seen that the temperature distribution cloud map of the bottom air supply is almost formed by inverting the top air supply temperature cloud map. When supplying air at the top, the temperature distribution continuously increases along the negative direction of the y-axis, with the highest temperature appearing at the bottom of the first layer of battery pack; The top air supply is opposite, and the temperature distribution continuously increases along the y-axis positive direction, with the highest temperature appearing at the top layer, which is the top of the third layer battery pack. The cooling effect of the battery pack through which cold air flows first will inevitably be better. While cooling the battery, the air temperature gradually increases, and the temperature difference with the surface of the battery pack that flows next decreases, resulting in poorer heat dissipation effect. The closer the battery pack is to the outlet, the worse the heat dissipation effect, and the higher the temperature of the battery pack. The maximum temperature Tmax, i, and maximum temperature difference of each layer of battery pack for top and bottom air supply Δ The changes in Tmax and i are shown in Figures 6.
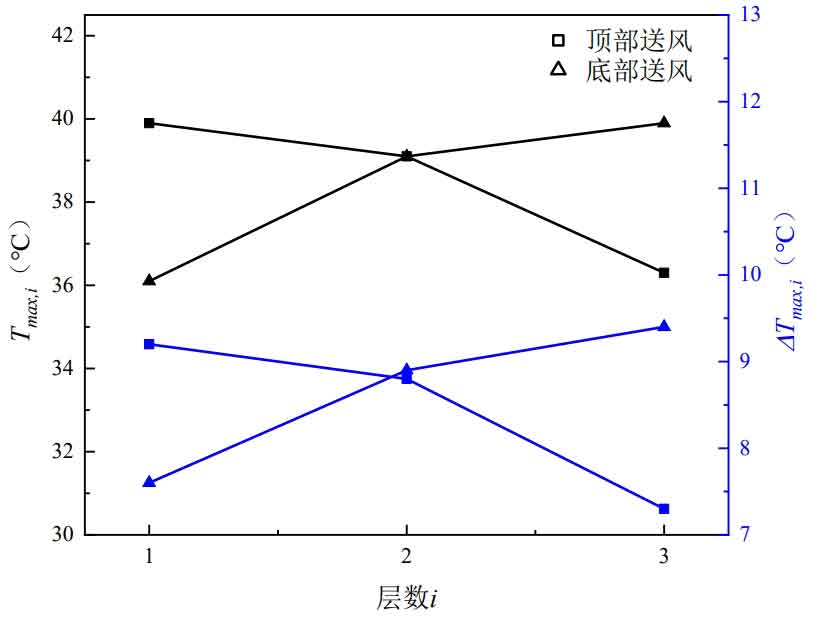
From the figure, it can be seen that the highest temperature and maximum temperature difference of each layer of battery pack for top air supply and bottom air supply Δ Tmax, i show a symmetrical trend. When supplying air at the bottom, due to the high density of cold air, it moves downwards under the action of gravity, so the cooling effect of the first layer of battery pack is relatively better. Comparing the heat dissipation of the battery pack near the air inlet, the Tmax at the bottom air supply is 36.1 ℃, while the Tmax at the top air supply is 36.3 ℃; The minimum temperature of the first layer battery pack during bottom air supply is 28.5 ℃, which is 0.5 ℃ lower than the minimum temperature of the third layer battery pack during top air supply. The Δ Tmax of top air supply and bottom air supply both appear in the battery pack near the air inlet, and the Δ Tmax of bottom air supply Δ Tmax is 0.2 ℃ higher than the top air supply. The difference in heat dissipation between top air supply and bottom air supply is due to the consideration of gravity and air thermal expansion coefficient in the simulation, but it has little impact on current research.
3.2 Impact of inlet flow on heat dissipation of battery cabinets
A simulation study was conducted on different inlet flow rates, considering four types of inlet flow rates: 0.1 m ^ 3/s, 0.2 m ^ 3/s, 0.3 m ^ 3/s, and 0.4 m ^ 3/s, to analyze their impact on the heat dissipation performance of the battery cabinet. The air supply method adopts top air supply, with a discharge rate of 3C, and the inlet temperature and ambient temperature are both 25 ℃. The maximum temperature Tmax, average temperature Tave, and maximum temperature difference of the battery cabinet Δ The variation curve of Tmax with inlet flow rate is shown in Figure 7.
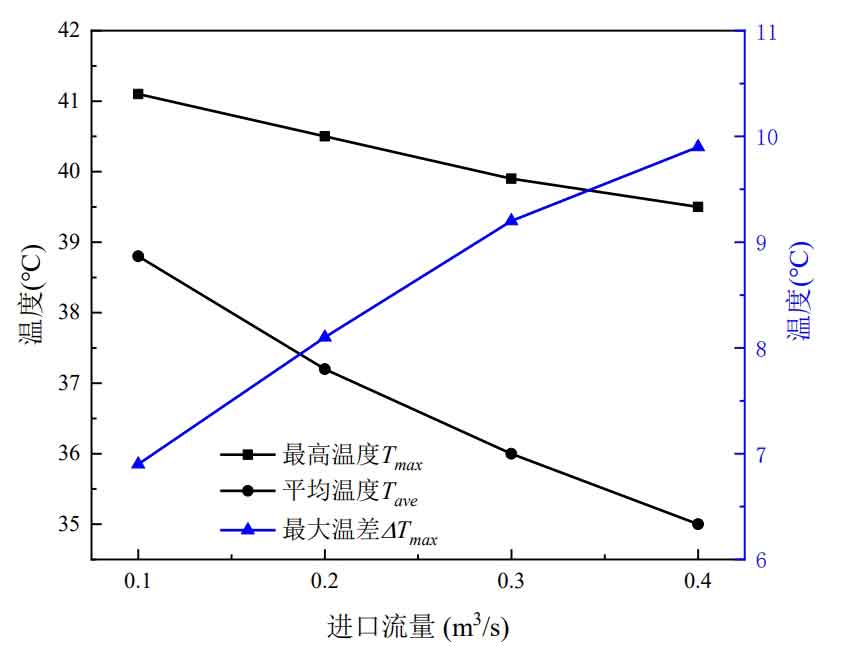
From Figures 7, it can be seen that as the inlet flow rate increases, Tmax and Tave continue to decrease, Δ On the contrary, Tmax continues to increase. The amplitude of decrease and increase decreases with the increase of inlet flow rate. In addition, the inlet flow rate has little effect on Tmax. The inlet flow rate increased from 0.1m ^ 3/s to 0.4m ^ 3/s, and Tmax only decreased by 1.6 ℃, while Tave decreased by 3.8 ℃, Δ Tmax also increased by 3.0 ℃. As the inlet flow rate increases, i.e. the inlet wind speed increases, the wind speed flowing through the battery surface increases, and the heat carried away from the battery surface also increases, resulting in a decrease in Tmax and Tave. Tave measures the overall heat dissipation of the battery cabinet, so increasing the inlet flow leads to a significant decrease in Tave; Due to the adoption of top air supply mode, the bottom heat dissipation conditions of the first layer battery pack are poor, which weakens the impact of inlet flow on Tmax. To further analyze the impact of import flow on Tmax and Δ The influence of Tmax, the maximum temperature Tmax, i, and maximum temperature difference of each layer of battery pack under different inlet flow rates Δ The changes in Tmax and i are shown in Figures 8.
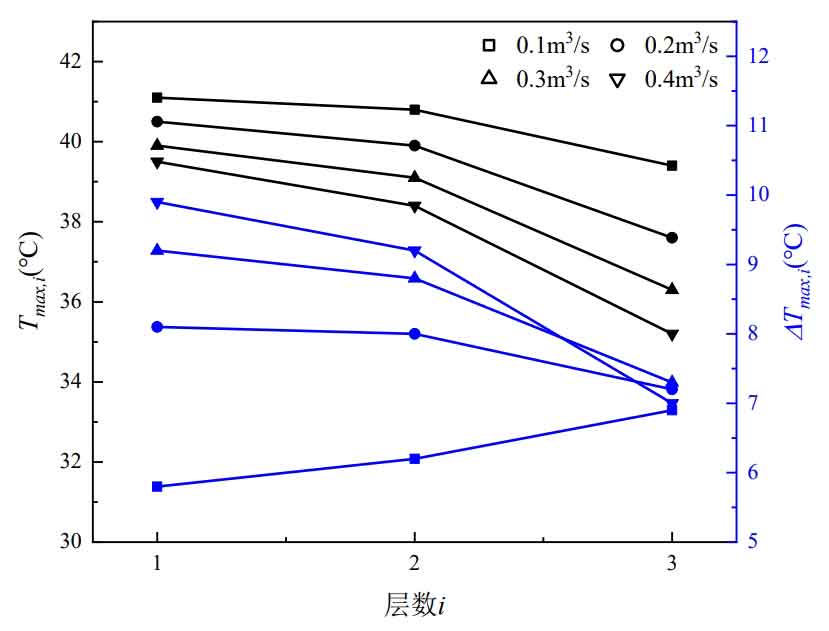
From Figures 8, it can be seen that as the number of layers increases, the maximum temperature of the battery pack decreases, and the magnitude of the decrease increases. Taking the inlet flow rate of 0.1 m ^ 3/s as an example, Tmax, 2 decreased by 0.3 ℃ compared to Tmax, while Tmax, 3 decreased by 1.4 ℃ compared to Tmax. In addition, the magnitude of the decrease also increases with the increase of the inlet flow rate. When the inlet flow rate is 0.4m ^ 3/s, Tmax and 2 decrease by 1.1 ℃ compared to Tmax, while Tmax and 3 decrease by 3.2 ℃ compared to Tmax.
Under different inlet flow rates, Δ The difference in Tmax and 3 is not significant. When the inlet flow rate is 0.1m ^ 3/s, the maximum temperature difference in the battery cabinet is Δ Tmax appears in the third layer battery pack. As the inlet flow rate increases, Tmax and 3 decrease significantly, and the lowest temperature decreases similarly, resulting in Δ Tmax, 3 changes very little. As the inlet flow rate increases, the decrease in Tmax and 1 is small, but the decrease in minimum temperature is significant, resulting in Δ Tmax, 1 continuously increasing, maximum temperature difference in battery cabinet Δ Tmax appears on the 1st layer battery pack. This is due to poor heat dissipation at the bottom of the top air supply layer 1 battery pack. Even if the inlet wind speed increases, the maximum temperature decrease is limited. However, as the inlet wind speed increases, the wind speed passing through the battery surface increases, taking away more heat, resulting in a significant decrease in the minimum temperature Δ Tmax, 1 increases. The inlet flow rate increased from 0.2m ^ 3/s to 0.4m ^ 3/s, and Tmax decreased by 1.0 ℃, while the minimum temperature decreased by 2.8 ℃, resulting in an increase in the maximum temperature difference of 1.8 ℃.
3.3 The impact of the number of batteries in each layer on heat dissipation
A simulation study was conducted on the air cooling and heat dissipation of battery cabinets under different battery quantities, taking into account the placement of 6, 7, 8, and 9 individual lithium-ion batteries per layer. In order to ensure the uniqueness of the variables, the inlet flow rate in each case is 0.3 m ^ 3/s. The difference between the length and width of the inlet and the length and width of the battery pack cross-section remains unchanged by 20mm, meaning that the inlet size increases correspondingly with the increase of the number of battery packs, ensuring a similar distribution of the flow field in the battery cabinet. The discharge rate of the battery pack is 3C, and the inlet temperature and ambient temperature are both 25 ℃. The simulation results of different battery quantities for each layer of battery pack are listed in Table 4.
| Number of batteries per layer/piece | Tmax/℃ | Tave | ΔTmax | Ev/Wh · L ^ -1 |
| 6 | 39.9 | 36.0 | 9.2 | 56.14 |
| 7 | 39.8 | 36.3 | 8.6 | 58.91 |
| 8 | 39.8 | 36.7 | 8.3 | 61.17 |
| 9 | 40.0 | 37.0 | 8.1 | 63.05 |
From Table 4, it can be seen that as the number of batteries in each layer increases, the maximum temperature Tmax of the battery cabinet remains basically unchanged, while the average temperature Tave continues to increase, and the maximum temperature difference Δ Tmax continues to decrease. Due to the constant inlet flow rate, as the number of batteries increases, the inlet size increases, and the corresponding inlet speed decreases, resulting in a decrease in the wind speed flowing through the battery surface, leading to an increase in Tave Δ Tmax decreases, Δ The reasons for the decrease in Tmax have been elaborated on in the previous section.
As the number of batteries per layer increases, the energy density Ev of the battery cabinet also increases. When the number of batteries per layer increases from 6 to 9, Tave increases by 2.8% Δ Tmax decreased by 12.0% and Ev increased by 12.3%. Therefore, it can be considered to arrange more lithium-ion batteries on each floor of the battery cabinet, reducing the occupied space while also increasing the temperature uniformity of the battery pack.
3.4 Impact of different battery cabinet layers on heat dissipation
The number of battery cabinet layers is an important factor in studying the heat dissipation performance of the battery cabinet, and different layers determine the number of battery packs that the battery cabinet can accommodate. Within the allowable range of actual installation height, the higher the number of layers of the battery cabinet, the more batteries it can accommodate, and the higher the energy of the battery cabinet naturally.
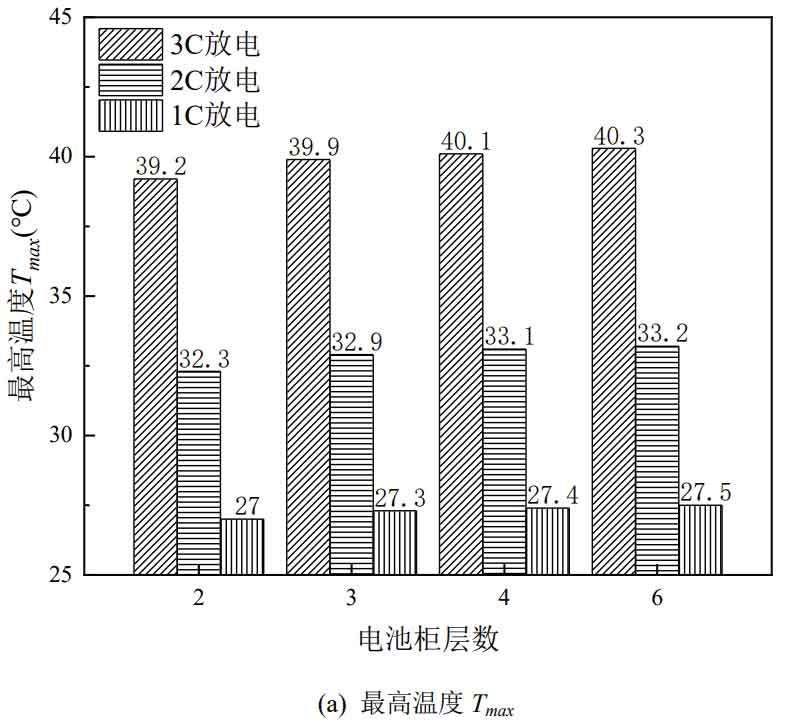
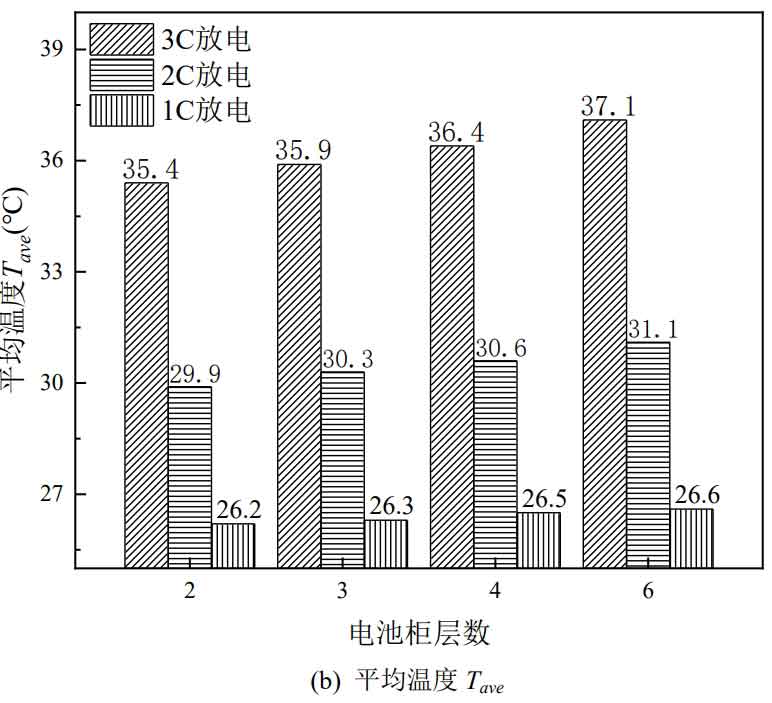
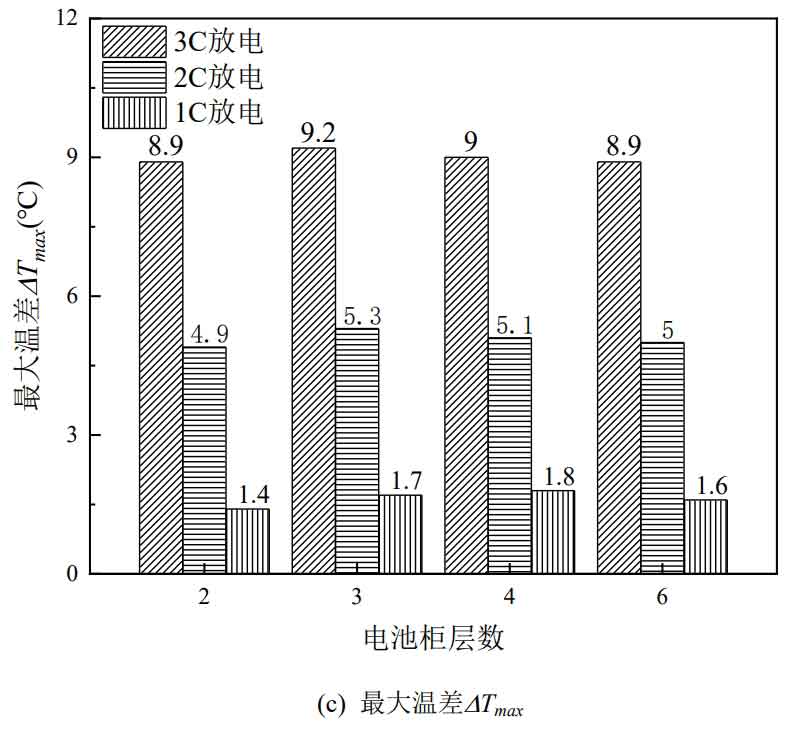
The inlet flow rate of different layers of battery cabinets is 0.3 m ^ 3/s, and the inlet temperature and ambient temperature are both 25 ℃. The simulation results are shown in Figure 9. It can be seen that under different discharge rates, the number of battery cabinet layers has little effect on the maximum temperature Tmax. As the number of layers increases, Tmax slightly increases, and the lower the discharge rate, the smaller the Tmax increase. The battery cabinet has been increased from 2 layers to 6 layers, and at a 3C discharge rate, Tmax has increased by 0.9 ℃; At a discharge rate of 1C, Tmax increased by 0.5 ℃. Compared to the highest temperature Tmax, the average temperature Tave of the battery cabinet increases significantly with the increase of layers, but it is also within 2 ℃, and the increase also decreases with the decrease of discharge rate. The battery cabinet has been increased from 2 layers to 6 layers, and at a 3C discharge rate, Tave has increased by 1.7 ℃; At 2C discharge rate, Tave increased by 1.2 ℃. Maximum temperature difference Δ Tmax shows a trend of first increasing and then decreasing as the number of battery cabinet layers increases, but the fluctuation amplitude is very small. At various discharge rates, Δ The maximum fluctuation amplitude of Tmax is within 0.5 ℃.
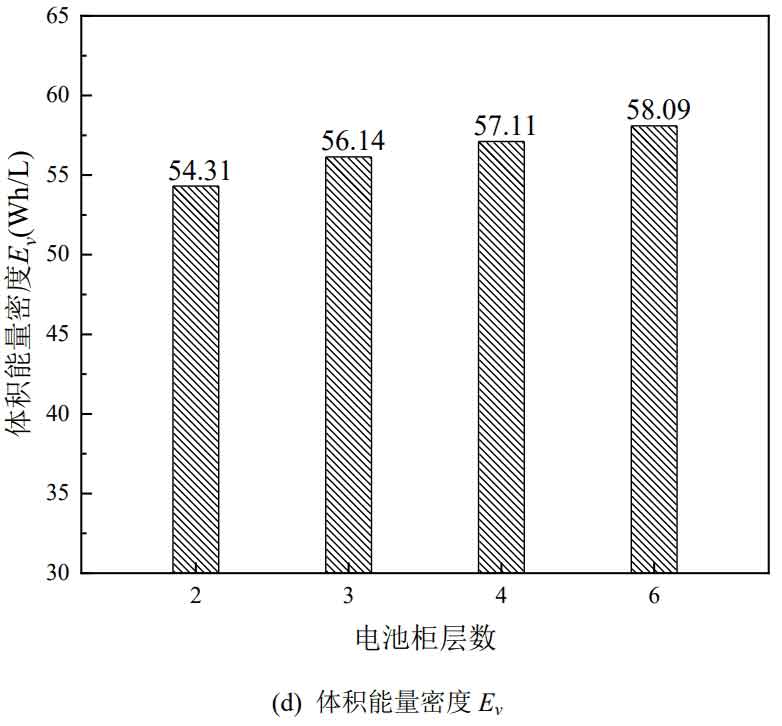
The volume energy density Ev increases with the increase of the number of battery cabinet layers, and the Ev of the 6-layer battery cabinet increases by 7.0% compared to the 2-layer battery cabinet. It is worth noting that increasing the number of battery cabinet layers leads to an increase in the volume of the battery cabinet, but it only occupies a larger space in height and does not affect the floor area. In practical application scenarios, increasing the number of battery cabinet layers without exceeding the height limit can greatly save space.
Further analysis of the impact of battery cabinet layers on Tmax and Δ The influence of Tmax, the maximum temperature Tmax, i, and maximum temperature difference of each layer of battery pack Δ The changes in Tmax and i are shown in Figures 10.
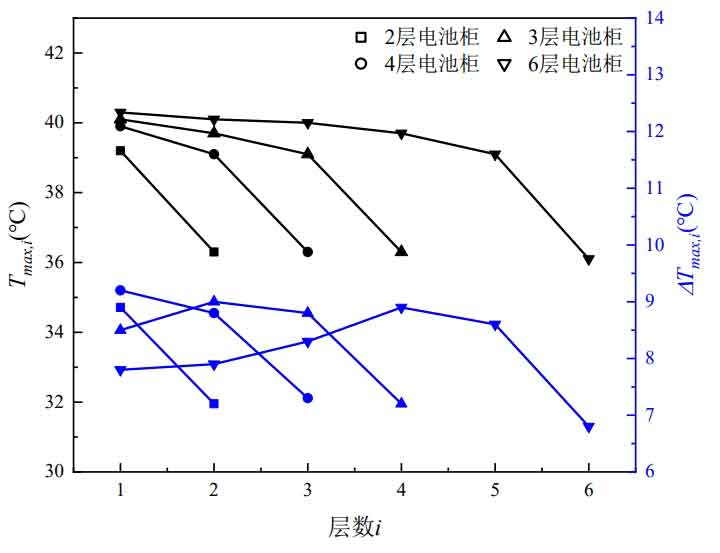
From Figure 10, it can be seen that as the number of layers increases, the maximum temperature of the battery pack decreases, and the battery pack near the air inlet has the greatest reduction. The maximum temperature of the battery pack near the air inlet is almost unaffected by the number of battery cabinet layers. Although the maximum temperature difference of battery cabinets with different layers Δ Tmax remains basically unchanged, but as the number of layers increases, Δ The position where Tmax appears moves upwards. 2nd and 3rd floor battery cabinets Δ Tmax appears in the first layer of the battery pack, while Δ Tmax appears in the second and fourth layers of the battery cabinets on the fourth and sixth layers, respectively.
summary
Established a CFD simulation model for air cooling and heat dissipation of the battery cabinet, and established experiments to verify the flow field distribution inside the cabinet. Maximum temperature Tmax, average temperature Tave, and maximum temperature difference through the battery cabinet Δ Four evaluation indicators, Tmax and volume energy density Ev, were simulated and analyzed to investigate the effects of different air supply methods, inlet flow rate, number of batteries per layer, and number of battery cabinet layers on heat dissipation performance. The main conclusions are as follows:
(1) We have established an air cooling and heat dissipation experiment for battery cabinets, simulating the heat generation of lithium-ion batteries by heating aluminum blocks. A CFD simulation model was established based on the experiment, and the distribution of the flow field inside the cabinet was verified by comparing the experimental and simulated results of the surface temperature of the aluminum block and the wind speed at the measurement points inside the cabinet.
(2) The heat dissipation effect of individual air supply on each layer of the battery cabinet is better than that of the overall air supply method. Compared with top air supply and bottom air supply, the heat dissipation effect of the two is almost the same, and the temperature distribution is opposite in the height direction. Considering the factors of air thermal expansion and gravity, the maximum temperature of the bottom air supply battery pack is slightly lower but the maximum temperature difference is also higher, but the difference is very small, all within the range of 0.5 ℃.
(3) The maximum temperature Tmax and average temperature Tave of the battery cabinet continuously decrease as the inlet flow rate increases, but the decrease in Tmax is smaller compared to Tave. The maximum temperature difference Δ Tmax actually increases as the inlet flow rate increases. The inlet flow rate increased from 0.1m ^ 3/s to 0.4m ^ 3/s, and Tmax and Tave decreased by 1.6 ℃ and 3.8 ℃, Δ Tmax increased by 3.0 ℃.
(4) Increasing the number of batteries per layer and the number of battery cabinet layers can effectively improve the energy density of the battery cabinet volume and reduce the occupied space. As the number of batteries in each layer increases, Tmax and Tave slightly increase, while Δ Tmax actually decreases; The effect of different battery cabinet layers on Tmax and Δ Tmax has little impact, and Tave slightly increases with the increase of layers. It is recommended to appropriately increase the number of batteries per layer and increase the number of battery cabinet layers within the installation height range, which can effectively reduce the occupied space and have a small impact on heat dissipation.
A series of issues such as global climate change and energy crisis are urgently driving the transformation of energy structure. Electrochemical energy storage systems can effectively enhance the grid’s acceptance of renewable energy. The electrochemical energy storage system gathers a large number of lithium-ion batteries, which generate a large amount of heat during operation, which has a negative impact on the performance and lifespan of the battery, as well as the safety of the energy storage system. Therefore, simulation research is conducted on the air cooling and heat dissipation of the electrochemical energy storage system battery cabinet.
Firstly, a thermal model of a square lithium-ion battery was established based on its working principle and heat generation mechanism. The accuracy of the battery thermal model was verified by conducting experimental tests on the discharge of individual batteries and comparing them with simulation results. Then, based on the battery thermal model, simulation research was conducted on the air-cooled heat dissipation of single-layer battery cabinets, analyzing the factors affecting heat dissipation performance, and providing the nearby inlet flow rate that meets the heat dissipation requirements under different arrangements and operating conditions. Finally, simulation research was conducted on the air cooling and heat dissipation of multi-layer battery cabinets, and experiments were established to verify the flow field distribution inside the cabinets. Based on the above research content, the following conclusions are mainly drawn:
(1) The discharge test of the single battery was conducted and compared with the simulation results. The maximum absolute error of temperature at each measurement point was only 1.7 ℃, which verified the accuracy of the battery thermal model. As the discharge rate increases, the battery temperature also increases. The highest temperature appears below the negative pole, and the temperature distribution shows a decreasing trend along the height negative direction. The maximum temperature of the battery under 3C discharge rate reaches 42 ℃, exceeding the recommended upper limit of the operating temperature range.
(2) A CFD model for air-cooled heat dissipation of single-layer battery cabinets was established, and the influence of key factors on heat dissipation performance was studied through simulation. Under natural convection heat dissipation, the discharge temperature rise of battery packs 1C and 2C is relatively small. When discharging at 3C, the maximum temperature and temperature difference of the battery pack reach 43.7 ℃ and 7.9 ℃, which are 13.6 ℃ and 6.1 ℃ higher than when discharging at 1C rate. Increasing the inlet flow rate can effectively reduce the maximum temperature and temperature difference of the battery pack, but it will increase the power consumption of the fan. When the inlet flow rate increases from 0.15m ^ 3/s to 0.20m ^ 3/s, the maximum temperature and temperature difference decrease by 2.5% and 5.5% respectively, while the power consumption of the fan increases by 135.9%. In addition, increasing the distance between batteries and reducing the distance between battery packs and cabinet walls is beneficial for heat dissipation performance, but it will reduce the volume energy density and increase the power consumption of the fan; The position and width of the inlet have little effect on the heat dissipation performance of the battery pack. Then, a comprehensive simulation analysis is conducted on different discharge rates, inlet temperatures, battery gaps, and operating times to provide the critical inlet flow rate that meets the heat dissipation demand and the critical inlet temperature that meets the heat dissipation demand when the maximum inlet flow rate is reached. The larger the discharge rate, the higher the inlet temperature, the smaller the battery gap, and the longer the operating time, the greater the required inlet flow rate. In practical applications, the above factors need to be taken into account, and conclusions can provide guiding ideas.
(3) Propose an overall air supply method for the battery cabinet, with only one air inlet per cabinet, which can simplify the air duct layout and easily control the airflow distribution. Establish air cooling and heat dissipation experiments for the battery cabinet to verify the flow field distribution inside the cabinet. The maximum absolute error of temperature at experimental and simulated measurement points is only 1.2 ℃, and the relative error of wind speed measurement points is below 5%. Establish a CFD model for air cooling and heat dissipation of multi-layer battery cabinets, and simulate and analyze the effects of different air supply methods, inlet flow rate, number of batteries per layer, and number of battery cabinet layers on heat dissipation performance. The separate air supply method for each layer has the best heat dissipation performance, and the top and bottom air supply have little impact on heat dissipation; As the inlet flow rate increases, the maximum and average temperatures of the battery cabinet decrease, but the temperature uniformity actually deteriorates; Increasing the number of batteries in each layer of the battery cabinet and increasing the number of layers of the battery cabinet have little effect on heat dissipation performance, and the maximum temperature and maximum temperature difference fluctuations are both within 2 ℃. Therefore, it is recommended to increase the number of batteries in each layer of the battery cabinet and the number of battery cabinet layers within the allowable range of actual installation, which can effectively improve the volume and energy density of the battery cabinet and save space.