
Reasonable capacity configuration of optical storage systems can reduce the cost of distributed power generation systems while improving the utilization of renewable energy and reducing load loss rates. Based on the mathematical analysis of photovoltaic cells and energy storage systems in the previous chapter, condition constraints are imposed on the energy storage system by constructing objective functions with economic efficiency, renewable energy utilization rate, and load loss rate. Simultaneously establish a power balance equation and ultimately use particle swarm optimization to optimize capacity.
1. Objective function
1) Economy
The expression for the electricity cost C (Cost) of the optical storage system is:
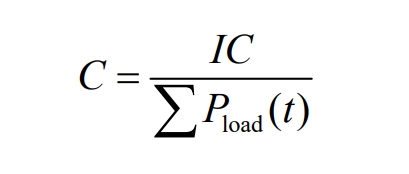
In the formula: ∑ Pload (t) – The total load value consumed annually.
In the equation:
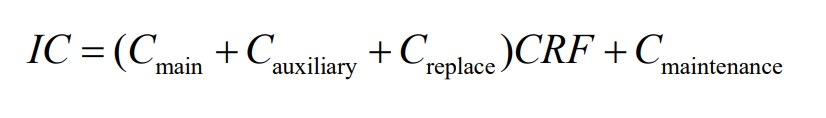
IC (Investment Costs, IC) – Annual energy storage system investment costs;
Cmain – The annual main investment funds for the system, taking Cmain as the product of the unit price and capacity of the main equipment;
Cauxiliary – Annual system other investment funds, taken as 0.1Cmain;
Creplace – annual replacement cost at the end of equipment life;
Cmaintenance – Annual operation and maintenance cost, taken as 0.01 (Cmain+Cauxiliary).
In the equation:
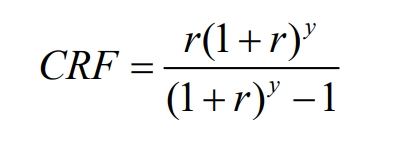
CRF – Capital Recovery Factor (CRF);
R – actual annual interest rate;
Y – Life cycle of microgrid.
2) Load loss rate
The Loss of Power Rate (LER) is the ratio of the system’s rated power to the actual load demand power. The expression is:
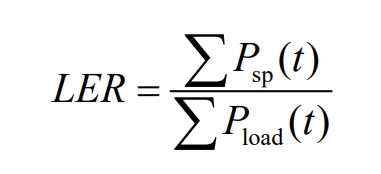
In the equation:
P (t) – Shortage power at time t.
3) Excess energy rate
Excess rate of energy (EROE) is the ratio of total remaining power to load demand power. The expression is:
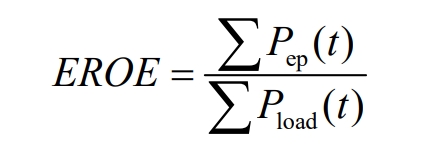
In the equation:
Pep (t) – Excess power at time t.
4) Multi-objective function
Taking the economic cost C, load loss rate LER, and energy surplus rate EROE of the optical storage system as the objective functions, the objective functions are constructed through weight coefficients as follows:
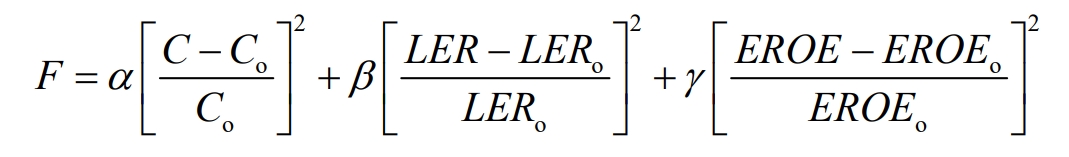
In the equation:
F – objective function;
Co – Ideal value of electricity cost;
LERo – ideal value of load loss rate;
EROEo – ideal value of energy excess rate;
α 、β 、γ —— Weighting factor, and α+β+γ = 1.
2. Constraints
Power balance constraints:
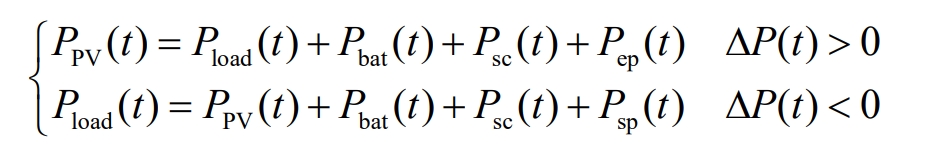
In the equation:
Δ P (t) – The difference between the photovoltaic power generation and the load demand power at time t.
Charge and discharge depth constraints:
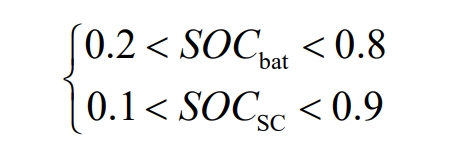
In the equation:
SOCbat – State of Charge of the battery;
SOCsc – State of Charge of Supercapacitors.
The capacity constraints of each device are as follows:
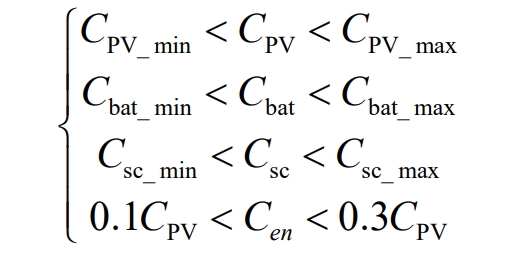
In the equation:
CPV_ Min – minimum value of photovoltaic installed capacity;
CPV_ Max – maximum installed capacity of photovoltaic system;
Cbat_ Min – minimum configured capacity of the battery;
Cbat_ Max – maximum configured capacity of the battery;
Csc_ Min – minimum configured capacity of supercapacitors;
Csc_ Max – maximum configured capacity of supercapacitors;
Cen – The total capacity of the energy storage system.
3. Particle Swarm Optimization Algorithm Solving Model
Extract the output power and load demand power of the photovoltaic system for a certain month (t represents the month), compare the power of the photovoltaic system and the load, and record the power difference.
1) Photovoltaic power PPV (t)>load power Pload (t):
(1) When the photovoltaic power exceeds the rated power of the load, the energy storage system stores energy.
(2) When the power difference is less than the battery power, the energy storage system can meet the storage of the difference power.
(3) When the power difference is greater than the battery power, the power difference is recorded and stored by the supercapacitor.
(4) When the power difference is less than the power of the supercapacitor, the energy storage system can meet the storage of the difference power.
(5) When the power difference is greater than the power of the supercapacitor, the energy storage system cannot meet the storage of the difference power, resulting in excess power.
2) Photovoltaic power PPV (t)<load power Pload (t):
(1) When the photovoltaic power is less than the load power, energy compensation is carried out by the energy storage system.
(2) When the power difference is less than the battery power, the energy storage system can compensate for the difference in power.
(3) When the power difference is greater than the battery power, the power difference is recorded and compensated by the supercapacitor.
(4) When the power difference is less than the power of the supercapacitor, the energy storage system can compensate for the difference in power.
(5) When the power difference is greater than the power of the supercapacitor, the energy storage system cannot compensate for the difference in power, resulting in a power shortage.
Firstly, the optimization parameters, particle size, and iteration times of the optical storage system are given, and the initial position and velocity of the particles are initialized. At the same time, the speed and position range of the particles are limited. Calculate the difference between the photovoltaic output and load power of the optical storage system based on the effective lighting time of one year. Add the missing power to obtain the total differential power of the system for one year, add the remaining power to obtain the total excess power of the system for one year, solve the objective function based on the weight factors of system cost and system stability, and iteratively optimize to obtain the optimal capacity configuration.
4. Example analysis
4.1 Example Simulation Scenarios
Example explanation: Under the sunlight conditions in Xi’an, Shaanxi, the average effective working time of photovoltaic full power is 3.34 hours. The photovoltaic energy storage system is configured for users with an average daily load of 49.6 kW · h and an annual load of 18104.0284 kW · h. The operating cycle of the photovoltaic energy storage system is set to be 20 years. By using the RETScreen clean energy management software (commonly referred to as RETScreen), the annual effective lighting time in Xi’an region can be queried as shown in Figure 1.
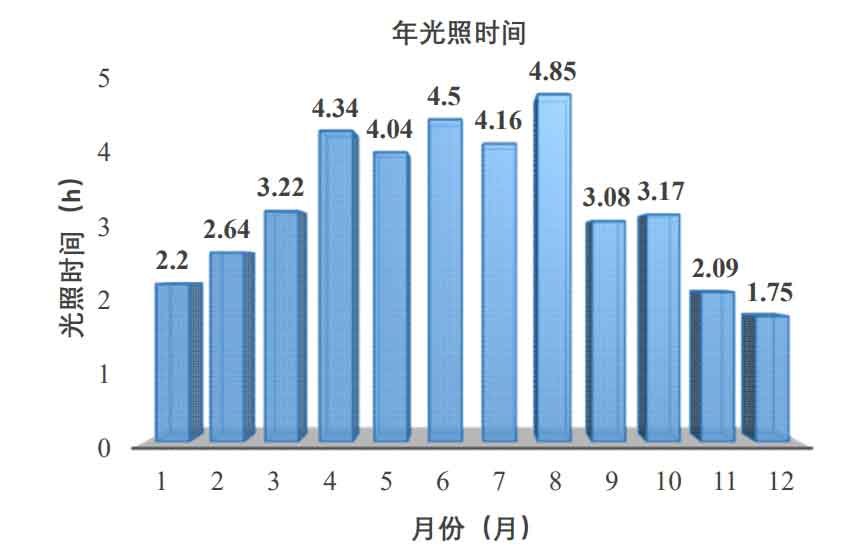
From Figure 1, it can be seen that the average effective sunshine time in Xi’an region is 3.34 hours per year, with the shortest effective sunshine time being 1.75 hours in December and the longest effective sunshine time being 4.85 hours in August.
The average load power is shown in Table 1:
| Annual load capacity | Hourly load capacity | Daily average load capacity |
| 18104.03 (kW · h) | 2.1 (kW · h) | 49.6 (kW · h) |
From the above table, it can be seen that with an annual load power of 18104.03kW · h, the daily load power is 49.6kW · h, and the average hourly power is 2.1kW · h.
The range of photovoltaic installed capacity calculated based on daily average load power and effective sunshine time is shown in Table 2:
| Minimum photovoltaic installed capacity (min) | Maximum photovoltaic installed capacity (max) | Average photovoltaic installed capacity |
| 10.22 (kW) | 28.34 (kW) | 14.85 (kW) |
From the above table, it can be seen that the minimum photovoltaic installed capacity is 10.22kW, and the maximum photovoltaic installed capacity is 28.34kW. In summary, the installed capacity of the photovoltaic system ranges from 10.2kW to 28.3kW.
The load loss rate and energy excess rate of photovoltaic systems without energy storage devices are shown in Table 3:
| Minimum photovoltaic installed capacity | Maximum photovoltaic installed capacity | |
| Load loss rate | 31.1% | 0 |
| Excess energy rate | 0 | 90.9% |
From the above table, it can be seen that in photovoltaic power generation systems without energy storage systems, too small photovoltaic installed capacity will generate a load loss rate of 31.1%, while too large photovoltaic installed capacity will generate an energy surplus rate of 90.9%, resulting in resource waste.
Therefore, a reasonable photovoltaic installed capacity can reduce the rate of load loss and energy surplus.
The ideal capacity for photovoltaic installation can be obtained by taking the average sunshine time as 3.34 hours of effective illumination time, which is 14.85kW.
In 2021, some provinces and cities explicitly stipulated that the proportion of photovoltaic energy distribution and storage should be higher than 10% of the installed capacity. The capacity configuration range of hybrid energy storage systems can be obtained as shown in Table 4:
| Energy storage installed capacity (10%) | Energy storage installed capacity (20%) | Energy storage installed capacity (30%) |
| 1.49 (kW) | 2.97 (kW) | 4.46 (kW) |
According to the above table, the capacity configuration range of the energy storage system is 1.49kW~4.46kW.
10% of the photovoltaic installed capacity is configured with energy storage installed capacity, and the power difference values in different months under the average installed capacity are calculated, as shown in Table 5:
| Month | Ideal photovoltaic installed capacity (kW) | Sunlight duration (h) | Average time (h) | Daily load (kW) | Daily energy difference (kW) | Monthly power difference (kW) |
| January | 14.85 | 2.2 | 3.34 | 49.6 | 12.75 | 395.38 |
| February | 14.85 | 2.64 | 3.34 | 49.6 | 25.22 | 706.30 |
| March | 14.85 | 3.22 | 3.34 | 49.6 | 41.66 | 1291.58 |
| April | 14.85 | 4.34 | 3.34 | 49.6 | 73.40 | 2202.24 |
| May | 14.85 | 4.04 | 3.34 | 49.6 | 64.90 | 2012.06 |
| June | 14.85 | 4.5 | 3.34 | 49.6 | 77.94 | 2338.28 |
| July | 14.85 | 4.16 | 3.34 | 49.6 | 68.30 | 2117.49 |
| August | 14.85 | 4.85 | 3.34 | 49.6 | 87.86 | 2723.75 |
| September | 14.85 | 3.08 | 3.34 | 49.6 | 37.69 | 1130.88 |
| October | 14.85 | 3.17 | 3.34 | 49.6 | 40.24 | 1247.65 |
| November | 14.85 | 2.09 | 3.34 | 49.6 | 9.63 | 289.09 |
| December | 14.85 | 1.75 | 3.34 | 49.6 | 0 | 0 |
According to the analysis in the above table, it can be concluded that the sum of photovoltaic output and energy storage system output in January, February, March, September, October, November, and December is less than the load power, and the load is in a state of power loss; The sum of photovoltaic output and energy storage system output in April, May, June, July, and August is greater than the load power, and the system is in a state of energy surplus.
According to the above table, the load loss rate and energy excess rate for different energy storage configuration ratios are calculated as shown in Table 6:
| 10% of photovoltaic installed capacity | 20% of photovoltaic installed capacity | 30% of photovoltaic installed capacity | |
| Load loss rate | 11.3% | 9.8% | 8.7% |
| Excess energy rate | 14.3% | 15.8% | 17.7% |
From the analysis in the table above, it can be concluded that the installed capacity of the energy storage system will affect the load loss rate and energy surplus rate. When the installed capacity of energy storage is 10%, 20%, and 30% of the photovoltaic system, the load loss rate LER will decrease with the increase of installed capacity. The energy surplus rate (EROR) will increase with the increase of installed capacity.
By comparing Table 3 and Table 6, it can be concluded that adding energy storage devices to the photovoltaic system can significantly improve the load loss rate and energy excess rate. The relationship between load loss rate and energy surplus rate is negatively correlated, so reasonable capacity configuration of photovoltaic systems and energy storage devices can solve the above problems.
4.2 Capacity optimization parameter setting configuration
The cost and service life of the microgrid system are shown in Table 7.
| Energy storage device | Unit power price (yuan/kW · h) | Service life (years) |
| Photovoltaic array | 2000 | 25 |
| Battery | 1500 | 5 |
| Supercapacitor | 2000 | 10 |
| Transformer | 3000 | 10 |
The basic parameter settings for capacity optimization are shown in Table 8.
| Capacity optimization parameters | Reference value |
| Residential market electricity price | ¥0.5469 |
| Load loss rate | 11.3% |
| Excess energy rate | 14.3% |
| α | 0.6 |
| β | 0.2 |
| γ | 0.2 |
| CRF | 0.04 |
| IC | 0.5 |
| LER | 0.1126 |
| EROE | 0.1427 |
4.3 Capacity optimization configuration results and analysis
The optimization results with different weights are shown in Figure 2:
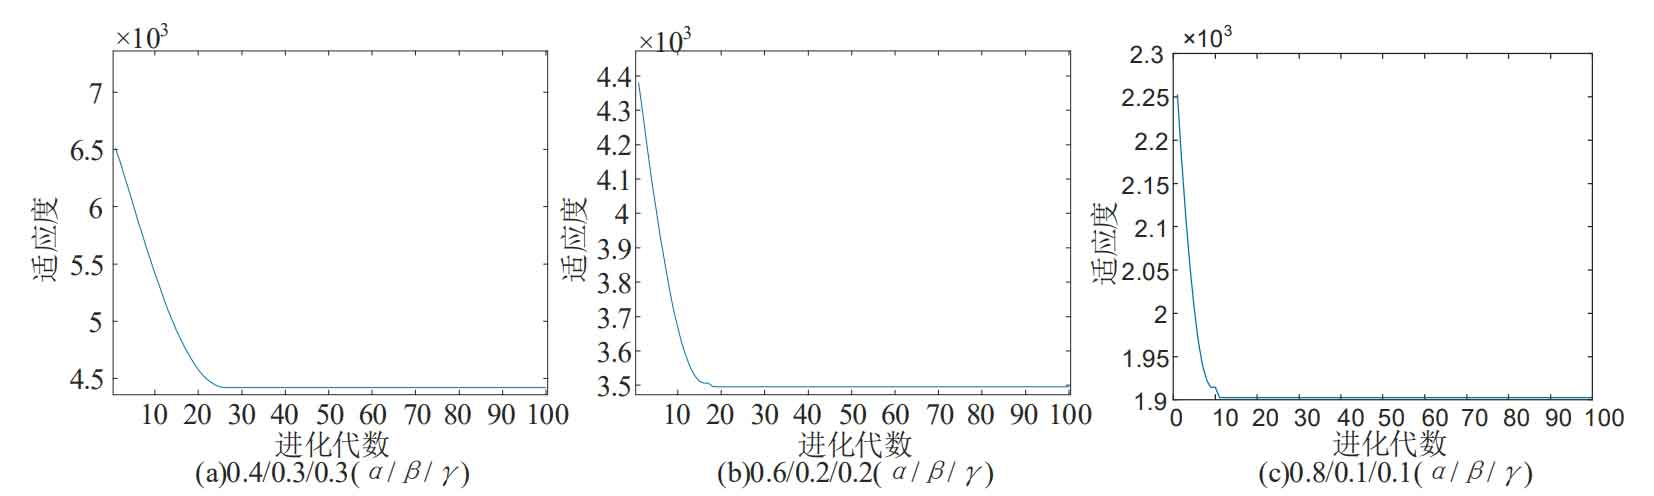
In summary, the final capacity optimization of the above system is shown in the table below:
| Weight coefficient( α/β/γ) | F | IC (¥/kW · h) | LER (%) | EROE (%) | Photovoltaic installation (kW) | Battery (kW) | Super capacitor (kW) | Converter (kW) |
| 0.8/0.1/0.1 | 0.0019 | 0.6875 | 12.2 | 12.8 | 14.3 | 1.8 | 0.3 | 17 |
| 0.6/0.2/0.2 | 0.0035 | 0.6975 | 12.0 | 12.9 | 14.3 | 1.9 | 0.4 | 17 |
| 0.4/0.3/0.3 | 0.0044 | 0.7077 | 11.7 | 13.1 | 14.3 | 2.0 | 0.5 | 17 |
According to different weight coefficients, the energy storage configuration is 16% of the installed capacity. With cost weighting coefficient α The decrease in cost will gradually increase. Weight coefficient with load loss rate β And the weight coefficient of energy surplus rate γ The increase in the corresponding load loss rate and energy surplus rate will increase.
According to the power balance relationship, power constraints, and capacity constraints, the particle swarm optimization algorithm is used to adaptively optimize the system objective function under different weight coefficients. Finally, the installed capacity of each system is obtained based on the solution results.