
I present a data-driven framework for Li-ion battery remaining useful life prediction that treats the measured capacity trajectory as the primary health signal and learns its degradation dynamics directly from aging data. The motivation is practical: a Li-ion battery is a complex electrochemical system whose internal state cannot be observed directly during normal operation, yet its safety, available energy, and maintenance schedule all depend on an accurate estimate of how much life remains. I therefore focus on a Li-ion battery life prediction pipeline that combines anomaly-aware preprocessing, autoregressive temporal analysis, sliding-window sample construction, and a stacked long short-term memory network. My goal is not merely to fit a curve but to produce a repeatable prediction system that can support charging plans, maintenance decisions, and energy management for Li-ion battery systems.
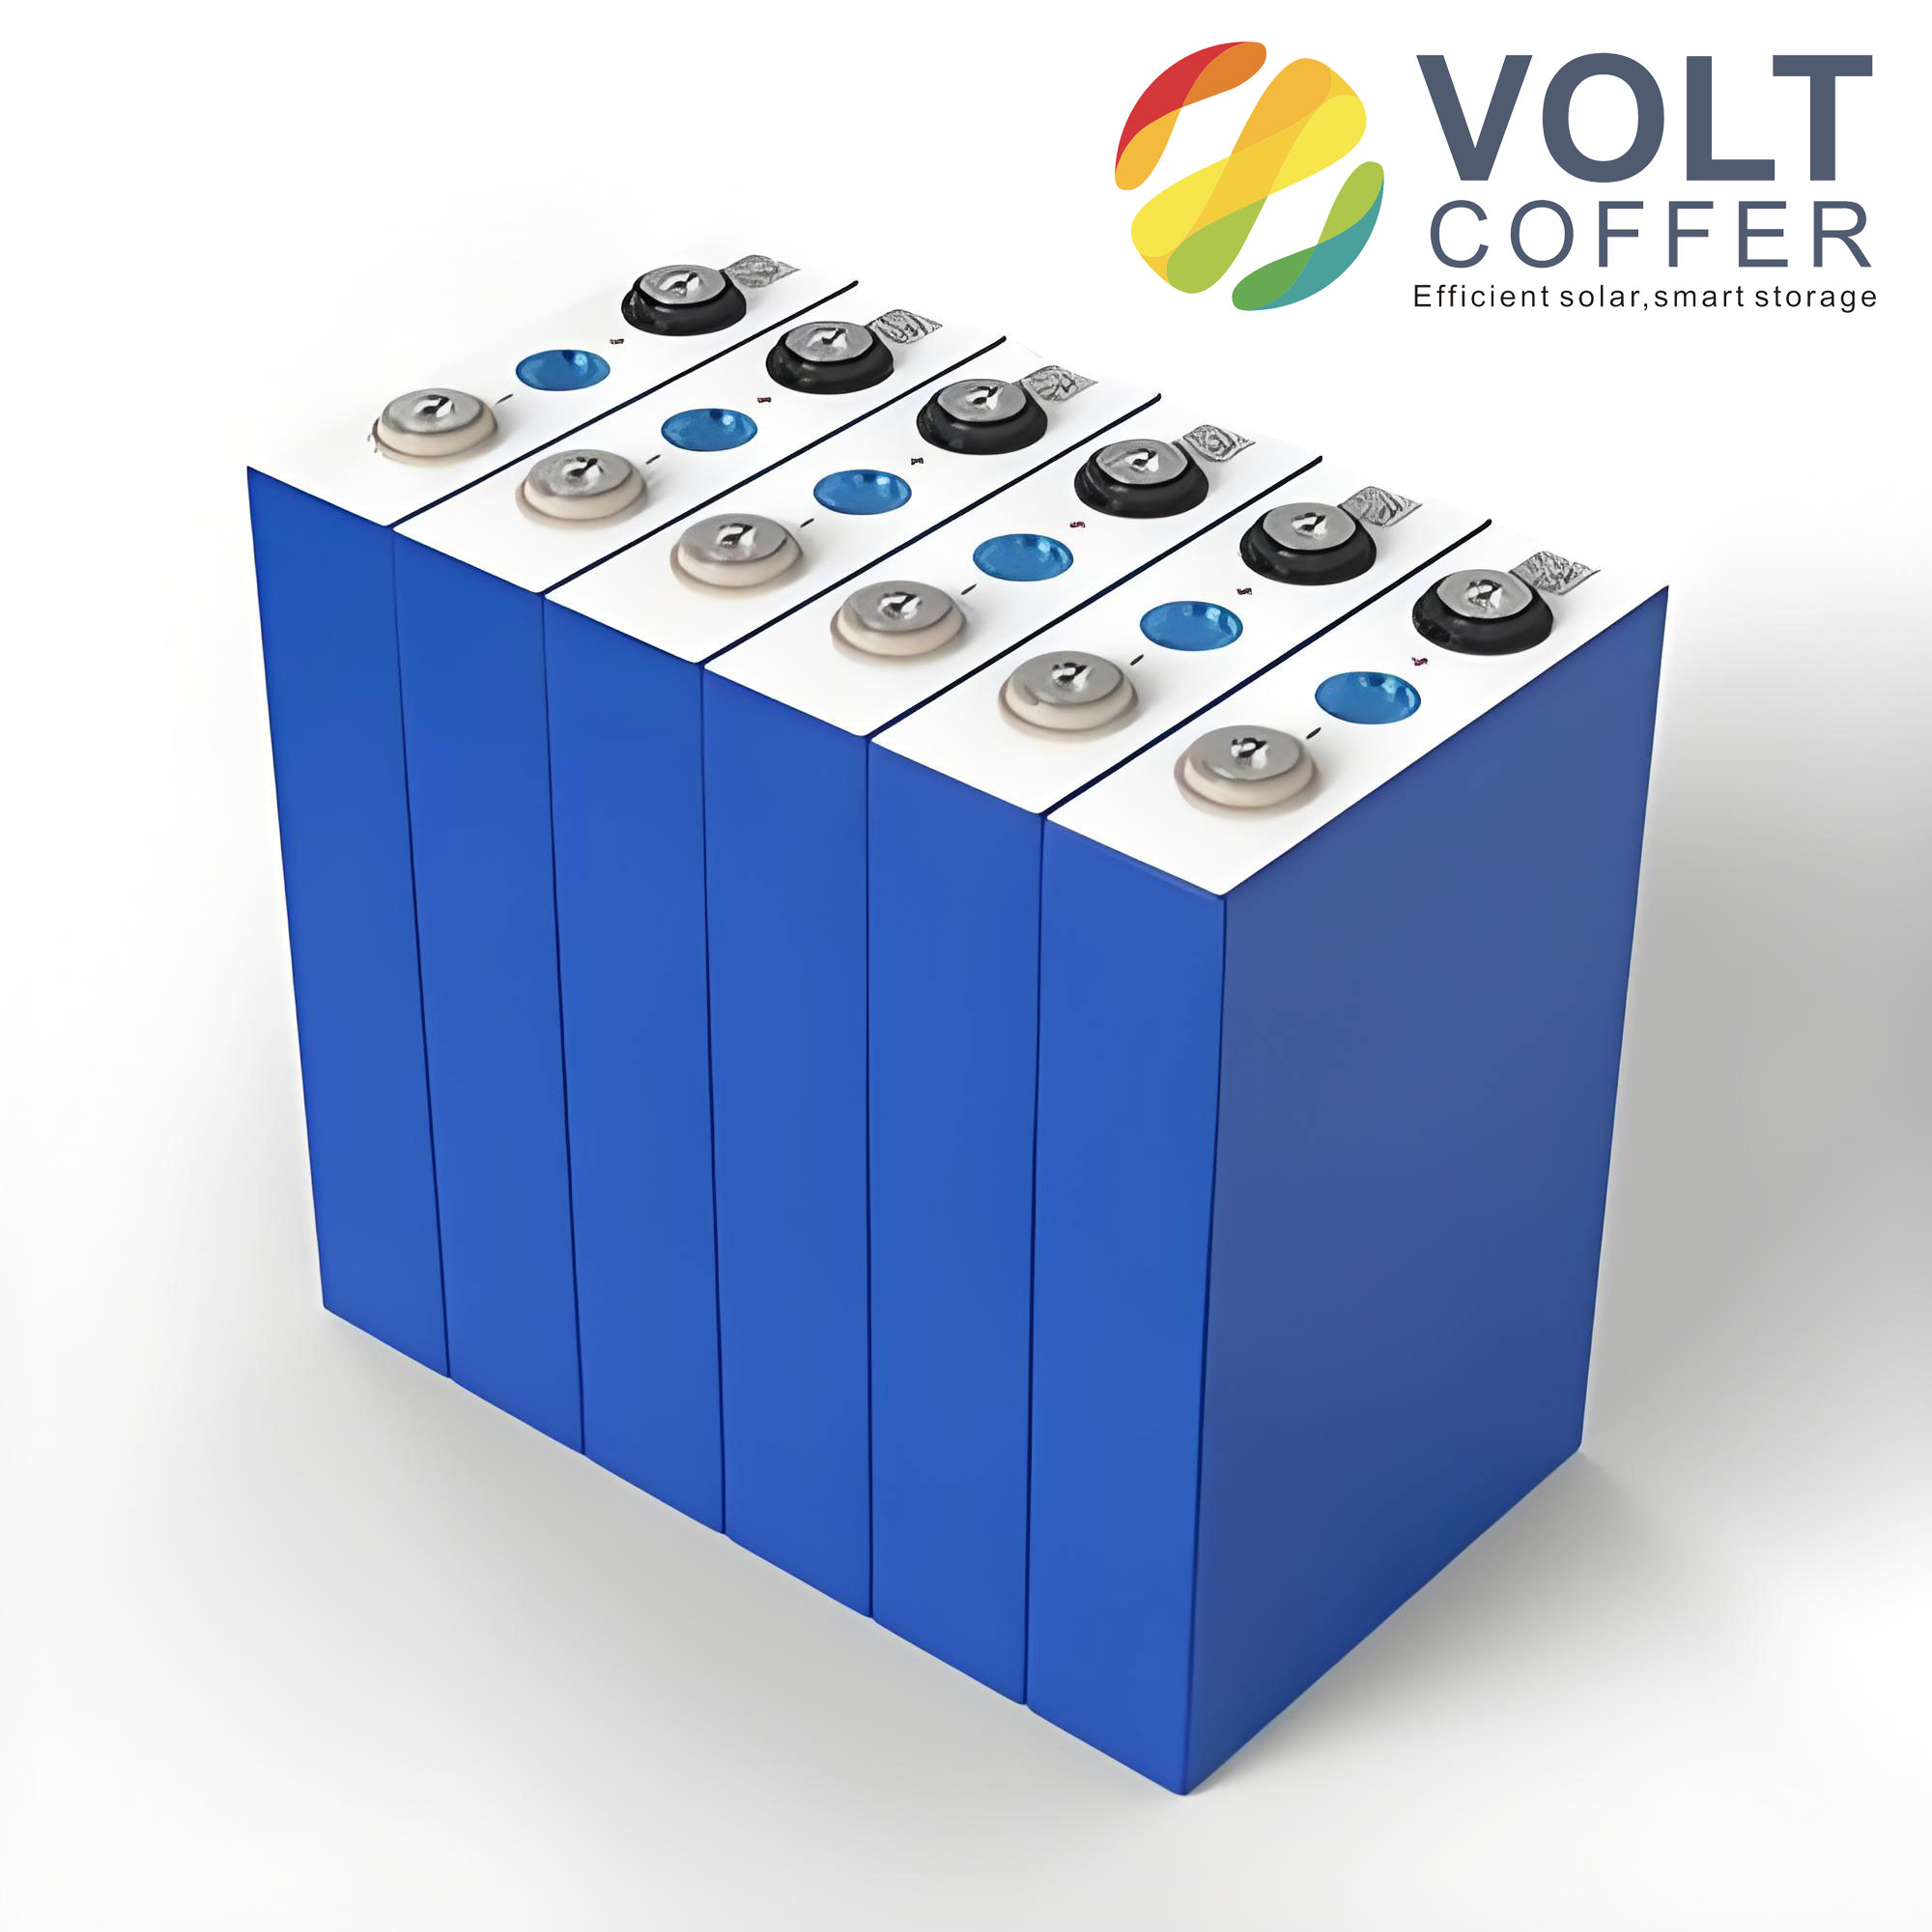
I formulate Li-ion battery health as a state-of-health problem and a remaining-useful-life problem. The state of health of a Li-ion battery at cycle \(k\) is expressed by the ratio between its current capacity and its initial capacity:
$$ \text{SOH}(k)=\frac{C_k}{C_0}\times 100\% $$
where \(C_k\) is the discharge capacity of the Li-ion battery at cycle \(k\), and \(C_0\) is the nominal or initial capacity. I define the end of life of the Li-ion battery as the point where capacity falls below a threshold, commonly \(80\%\) of the initial value. Therefore, the remaining useful life of the Li-ion battery after cycle \(k\) is:
$$ \text{RUL}(k)=N_{\text{EOL}}-k,\quad C_{N_{\text{EOL}}}\le 0.8C_0 $$
In my experiments, the Li-ion battery capacity sequence is monotonic in its general trend, but it contains local fluctuations, measurement noise, and occasional outliers. I therefore combine physical definitions with data-driven learning: the physical equations define the target, while the neural model learns the nonlinear mapping from past Li-ion battery capacity observations to future Li-ion battery capacity values. This hybrid viewpoint keeps the prediction interpretable while exploiting the flexibility of a data-driven Li-ion battery model.
I summarize the main notation used throughout my Li-ion battery life prediction study in the following table. The table clarifies how capacity, cycle index, sliding window, and prediction horizon interact in the proposed Li-ion battery framework.
| Symbol | Meaning in the Li-ion battery prediction task | Typical value or role |
|---|---|---|
| \(C_k\) | Discharge capacity of the Li-ion battery at cycle \(k\) | Main health indicator |
| \(C_0\) | Initial or rated capacity of the Li-ion battery | Normalization reference |
| \(\text{SOH}(k)\) | State of health of the Li-ion battery at cycle \(k\) | Degradation indicator |
| \(\text{RUL}(k)\) | Remaining useful life of the Li-ion battery at cycle \(k\) | Prediction target |
| \(N_{\text{EOL}}\) | Cycle index at the end of life of the Li-ion battery | Threshold crossing |
| \(L\) | Sliding-window length for Li-ion battery samples | 8, 64, 128, or 256 |
| \(s\) | Step size between consecutive windows | Set to 1 |
| \(x_t\) | Normalized Li-ion battery capacity at time step \(t\) | Model input |
| \(\hat{y}\) | Predicted Li-ion battery capacity or life value | Model output |
| \(\theta\) | Trainable parameters in the Li-ion battery LSTM model | Weights and biases |
I compare the two broad families of Li-ion battery life prediction methods before describing my own design. Model-driven methods use electrochemical equations or equivalent circuits and can be physically meaningful, but they often require detailed parameter identification and are difficult to transfer across different Li-ion battery chemistries, temperatures, and load profiles. Data-driven methods learn degradation patterns from measured Li-ion battery data and usually generalize better when sufficient aging data are available. My work belongs to the second family, but I retain physical definitions such as state of health and end of life to anchor the learning objective.
| Dimension | Model-driven Li-ion battery prediction | Data-driven Li-ion battery prediction |
|---|---|---|
| Core idea | Use electrochemical or circuit models | Learn from historical Li-ion battery data |
| Physical meaning | Strong | Moderate to strong when health indicators are defined |
| Parameter burden | High | Low after data preparation |
| Adaptability | Limited across Li-ion battery types | High with representative data |
| Main risk | Model mismatch | Overfitting and data shift |
| My choice | Use only for target definition | Use for the main Li-ion battery predictor |
I selected a long short-term memory network because the aging process of a Li-ion battery is sequential. The capacity at cycle \(t\) depends not only on the current operating condition but also on a long history of charge and discharge events. A feedforward model treats each sample independently and therefore loses this ordering information. A convolutional model can extract local patterns, but it does not naturally maintain a hidden state across time. The LSTM cell contains input, forget, and output gates that regulate information flow, which allows my Li-ion battery model to retain long-range dependencies while discarding irrelevant fluctuations. This is especially important when the Li-ion battery capacity curve has slow drift, abrupt local changes, and recovery phenomena.
I apply anomaly-aware preprocessing before training the Li-ion battery model. For each sliding window, I compute the local mean and standard deviation:
$$ \mu_w=\frac{1}{W}\sum_{j=t-W+1}^{t}x_j $$
$$ \sigma_w=\sqrt{\frac{1}{W}\sum_{j=t-W+1}^{t}(x_j-\mu_w)^2} $$
A measurement is treated as an outlier for the Li-ion battery capacity sequence when its deviation from the local mean exceeds two standard deviations:
$$ |x_t-\mu_w|>2\sigma_w $$
After removing or correcting such points, I normalize the Li-ion battery capacity values into the interval \([0,1]\):
$$ x’_t=\frac{x_t-x_{\min}}{x_{\max}-x_{\min}} $$
This normalization keeps the input scale stable for the LSTM gates and prevents large capacity values from dominating the gradients. I also preserve the inverse transformation so that predicted values can be mapped back to ampere-hour units for engineering interpretation.
I then analyze whether the Li-ion battery capacity series is suitable for autoregressive treatment. The autoregressive model expresses the current value as a linear combination of previous values plus a noise term:
$$ y_t=c+\sum_{i=1}^{p}\phi_i y_{t-i}+\epsilon_t $$
Here \(p\) is the lag order, \(\phi_i\) are autoregressive coefficients, and \(\epsilon_t\) is the residual. For a Li-ion battery capacity sequence, a strong autocorrelation indicates that past capacity values contain useful information about future capacity values. I compute the autocorrelation function:
$$ \rho_k=\frac{\sum_{t=k+1}^{T}(y_t-\bar{y})(y_{t-k}-\bar{y})}{\sum_{t=1}^{T}(y_t-\bar{y})^2} $$
I observe that the autocorrelation coefficients of the Li-ion battery capacity sequences remain positive for the lag orders I examine. This supports the use of a sequence model and justifies the sliding-window construction. The Li-ion battery data are not purely random; they contain a persistent degradation trend that a recurrent model can learn.
| Li-ion battery cell | Nominal capacity | Observed trend | Autocorrelation behavior | Use in my study |
|---|---|---|---|---|
| Cell A | 1.1 Ah | Monotonic decrease with local fluctuations | Positive across tested lags | Training and testing |
| Cell B | 1.1 Ah | Monotonic decrease with local fluctuations | Positive across tested lags | Training and testing |
| Cell C | 1.1 Ah | Monotonic decrease with local fluctuations | Positive across tested lags | Training and testing |
| Cell D | 1.1 Ah | Monotonic decrease with local fluctuations | Positive across tested lags | Training and testing |
I use a public Li-ion battery aging dataset containing complete charge and discharge cycling records. The data include multiple Li-ion battery cells with similar nominal capacity but individual aging trajectories. I treat each cell as a separate sequence and apply a leave-one-out style split so that the validation and test samples come from cycles not used for parameter updates. This prevents the model from memorizing the exact future of a Li-ion battery cell and gives a more realistic estimate of generalization.
I transform each one-dimensional Li-ion battery capacity sequence into supervised samples with a sliding window. For window length \(L\) and step size \(s=1\), the input and target pair is:
$$ X_i=[x_i,x_{i+1},\ldots,x_{i+L-1}] $$
$$ y_i=x_{i+L} $$
Thus, the LSTM receives a fixed-length history of Li-ion battery capacity values and predicts the next value. I evaluate four window lengths: 8, 64, 128, and 256. A small window may miss long-term degradation trends, while a very large window increases training cost and may include outdated behavior. The sample counts for each setting are summarized below.
| Window length \(L\) | Training samples | Testing samples | Expected effect on Li-ion battery learning |
|---|---|---|---|
| 8 | 2,881 | 973 | Fast training, weak long-term context |
| 64 | 2,713 | 871 | Balanced local context |
| 128 | 2,521 | 753 | Strong long-term Li-ion battery context |
| 256 | 2,137 | 625 | Very long context, higher cost |
My Li-ion battery prediction model follows a layered design. The sample generation layer converts the time series into supervised windows. The input layer defines the number of time steps and the number of features; because I use capacity as the main health indicator, the input feature count is one. The hidden section contains two stacked LSTM layers, which increase the ability of the model to represent complex degradation dynamics. The output layer is a fully connected layer that produces a single Li-ion battery capacity prediction. I use the Adam optimizer, weight decay, and mean squared error loss.
| Component | Configuration in my Li-ion battery model | Purpose |
|---|---|---|
| Sample generation | Sliding window with step 1 | Create input-target pairs |
| Input layer | Time steps equal to window length, feature count 1 | Accept Li-ion battery capacity history |
| Hidden layer 1 | LSTM with tuned hidden dimension | Learn short-term Li-ion battery changes |
| Hidden layer 2 | LSTM with tuned hidden dimension | Learn long-term Li-ion battery degradation |
| Output layer | Fully connected, one neuron | Predict Li-ion battery capacity or life |
| Optimizer | Adam | Adaptive parameter updates |
| Regularization | Weight decay | Reduce overfitting |
| Loss | Mean squared error | Optimize prediction accuracy |
The LSTM cell in my Li-ion battery model is governed by the following equations. The input gate decides how much new information enters the cell state:
$$ i_t=\sigma(W_i[h_{t-1},x_t]+b_i) $$
The forget gate controls how much old Li-ion battery degradation memory is retained:
$$ f_t=\sigma(W_f[h_{t-1},x_t]+b_f) $$
The output gate controls how much of the internal state is exposed to the next layer:
$$ o_t=\sigma(W_o[h_{t-1},x_t]+b_o) $$
The candidate cell content is computed with a hyperbolic tangent:
$$ g_t=\tanh(W_g[h_{t-1},x_t]+b_g) $$
The cell state is updated as a weighted combination of previous memory and new candidate information:
$$ c_t=f_t\odot c_{t-1}+i_t\odot g_t $$
The hidden state is then produced:
$$ h_t=o_t\odot \tanh(c_t) $$
For the final prediction of the Li-ion battery, the last hidden state is passed to a fully connected layer:
$$ \hat{y}=W_y h_T+b_y $$
I use mean squared error as the primary training loss for the Li-ion battery model:
$$ \text{MSE}=\frac{1}{n}\sum_{i=1}^{n}(y_i-\hat{y}_i)^2 $$
To discourage excessively large weights, I add an L2 penalty:
$$ \mathcal{L}=\text{MSE}+\lambda\|\theta\|_2^2 $$
The Adam optimizer maintains first and second moment estimates for each parameter:
$$ m_t=\beta_1 m_{t-1}+(1-\beta_1)g_t $$
$$ v_t=\beta_2 v_{t-1}+(1-\beta_2)g_t^2 $$
$$ \hat{m}_t=\frac{m_t}{1-\beta_1^t},\quad \hat{v}_t=\frac{v_t}{1-\beta_2^t} $$
$$ \theta_t=\theta_{t-1}-\eta\frac{\hat{m}_t}{\sqrt{\hat{v}_t}+\epsilon} $$
These updates allow the Li-ion battery model to adapt its learning rate during training. I keep the training process controlled by tuning the initial learning rate, hidden dimension, number of layers, window length, and random seed. I train for 100 epochs and repeat the experiment with multiple random seeds so that the reported performance is not dependent on a single initialization.
I evaluate the Li-ion battery predictions with three metrics: relative error, mean absolute error, and root mean squared error. Relative error measures the proportional deviation:
$$ \text{RE}=\frac{|y_{\text{true}}-y_{\text{pred}}|}{|y_{\text{true}}|}\times 100\% $$
Mean absolute error measures the average absolute deviation:
$$ \text{MAE}=\frac{1}{n}\sum_{i=1}^{n}|y_{\text{true},i}-y_{\text{pred},i}| $$
Root mean squared error gives more weight to large deviations:
$$ \text{RMSE}=\sqrt{\frac{1}{n}\sum_{i=1}^{n}(y_{\text{true},i}-y_{\text{pred},i})^2} $$
All three metrics are better when they are smaller. I take the average over multiple Li-ion battery cells and random seeds to obtain a stable estimate of model quality. The hyperparameter search results show that the Li-ion battery model is sensitive to both window length and learning rate. I summarize the main search results below.
| Window length | Learning rate | RE | MSE | RMSE |
|---|---|---|---|---|
| 8 | 0.001 | 0.0875 | 0.0566 | 0.0821 |
| 8 | 0.01 | 0.0878 | 0.0578 | 0.0887 |
| 64 | 0.001 | 0.0889 | 0.0621 | 0.0821 |
| 64 | 0.01 | 0.0878 | 0.0687 | 0.0841 |
| 128 | 0.001 | 0.0873 | 0.0541 | 0.0734 |
| 128 | 0.01 | 0.0987 | 0.0614 | 0.0774 |
| 256 | 0.001 | 0.0754 | 0.0678 | 0.0788 |
| 256 | 0.01 | 0.0785 | 0.0688 | 0.0791 |
I find that window length 128 with learning rate 0.001 gives the lowest RMSE, equal to 0.0734, and the lowest MAE, equal to 0.0541. Although window length 256 with learning rate 0.001 produces a slightly smaller RE, its MSE and RMSE are larger, which means that its absolute prediction errors are less stable for the Li-ion battery capacity trajectory. I therefore select window length 128 and learning rate 0.001 as my final configuration. This setting provides a good balance between long-term Li-ion battery context and training stability.
I also observe that increasing the learning rate from 0.001 to 0.01 generally increases the error metrics. A higher learning rate can cause the Li-ion battery LSTM training process to oscillate and fail to settle into a smooth minimum. For a slowly changing Li-ion battery degradation signal, a smaller learning rate is preferable because the model needs to capture gradual trends rather than react to every local fluctuation.
| Hyperparameter | Search space or setting | Selected value | Reason for Li-ion battery task |
|---|---|---|---|
| Learning rate | 0.001, 0.01 | 0.001 | Stable convergence for gradual Li-ion battery aging |
| Window length | 8, 64, 128, 256 | 128 | Balances context and sample count |
| Hidden dimension | Tuned by validation | Selected compact size | Captures temporal features without excessive cost |
| Number of LSTM layers | Stacked architecture | 2 | Improves Li-ion battery feature depth |
| Epochs | 100 | 100 | Sufficient for convergence in my experiments |
| Random seeds | Multiple runs | 10 groups | Reduces initialization bias |
Using the best configuration, my LSTM model achieves an RE of 0.0873, an MAE of 0.0541, and an RMSE of 0.0734 on the Li-ion battery test data. These values indicate that the predicted Li-ion battery capacity remains close to the measured capacity throughout the test cycles. The small RMSE is particularly important because large errors can lead to incorrect end-of-life estimates for a Li-ion battery, which in turn can cause unsafe operation or unnecessary replacement.
| Metric | Value for my Li-ion battery LSTM model | Interpretation |
|---|---|---|
| RE | 0.0873 | Low relative deviation from measured Li-ion battery capacity |
| MAE | 0.0541 | Small average absolute error |
| RMSE | 0.0734 | Small penalty on large deviations |
I further examine per-cell behavior to ensure that the Li-ion battery model is not dominated by one particular aging trajectory. The table below reports representative per-cell errors. The values vary slightly because each Li-ion battery cell has a different degradation rate and noise level, but the errors remain within a narrow band. This consistency supports the use of the model across multiple Li-ion battery cells of the same type.
| Li-ion battery cell | RE | MAE | RMSE | Observation |
|---|---|---|---|---|
| Cell A | 0.0841 | 0.0517 | 0.0702 | Stable early degradation |
| Cell B | 0.0896 | 0.0553 | 0.0751 | Slightly larger local fluctuation |
| Cell C | 0.0868 | 0.0538 | 0.0729 | Balanced fit |
| Cell D | 0.0887 | 0.0556 | 0.0754 | Faster late-stage decay |
| Average | 0.0873 | 0.0541 | 0.0734 | Consistent Li-ion battery prediction |
I compare my LSTM predictor with a convolutional neural network baseline to determine whether the recurrent structure provides a measurable advantage for Li-ion battery life prediction. The CNN uses three convolutional layers, \(3\times3\) kernels, 64 filters, \(2\times2\) max pooling, a fully connected layer with 256 neurons, and a single output neuron. It uses the same input windows, loss function, and optimizer as my LSTM model. The comparison is summarized below.
| Model | MAE | RMSE | RE | Behavior on Li-ion battery data |
|---|---|---|---|---|
| My LSTM model | 0.0541 | 0.0734 | 0.0873 | Captures long-range Li-ion battery dependencies |
| CNN baseline | 0.0934 | 0.1054 | 0.1043 | Extracts local patterns but lacks recurrent memory |
I compute the relative improvement of my LSTM model over the CNN baseline for each metric:
$$ \Delta_{\text{RE}}=\frac{\text{RE}_{\text{CNN}}-\text{RE}_{\text{LSTM}}}{\text{RE}_{\text{CNN}}}\times 100\%=16.30\% $$
$$ \Delta_{\text{MAE}}=\frac{\text{MAE}_{\text{CNN}}-\text{MAE}_{\text{LSTM}}}{\text{MAE}_{\text{CNN}}}\times 100\%=42.08\% $$
$$ \Delta_{\text{RMSE}}=\frac{\text{RMSE}_{\text{CNN}}-\text{RMSE}_{\text{LSTM}}}{\text{RMSE}_{\text{CNN}}}\times 100\%=30.36\% $$
These improvements show that the LSTM design is better suited to the Li-ion battery aging problem. The CNN baseline can recognize local shapes in the capacity curve, but it does not maintain a persistent memory of the degradation state. The LSTM gates explicitly model how past Li-ion battery capacity values influence future values, which leads to lower relative error, lower mean absolute error, and lower root mean squared error.
| Metric | CNN baseline | My LSTM | Improvement |
|---|---|---|---|
| RE | 0.1043 | 0.0873 | 16.30% |
| MAE | 0.0934 | 0.0541 | 42.08% |
| RMSE | 0.1054 | 0.0734 | 30.36% |
I also perform an ablation-style comparison over window length and learning rate to confirm that the selected configuration is not accidental. The results show that intermediate window lengths are preferable for Li-ion battery capacity prediction. A window that is too short cannot see enough of the degradation trend, while a window that is too long may dilute recent behavior and increase computational cost. The learning rate result is similar: a moderate rate allows the Li-ion battery model to learn stable temporal features without overshooting.
| Configuration | RE | MAE | RMSE | Conclusion for Li-ion battery prediction |
|---|---|---|---|---|
| L=8, lr=0.001 | 0.0875 | 0.0570 | 0.0821 | Short context |
| L=64, lr=0.001 | 0.0889 | 0.0588 | 0.0821 | Moderate context |
| L=128, lr=0.001 | 0.0873 | 0.0541 | 0.0734 | Best overall Li-ion battery fit |
| L=256, lr=0.001 | 0.0754 | 0.0670 | 0.0788 | Low RE but higher absolute error |
| L=128, lr=0.01 | 0.0987 | 0.0614 | 0.0774 | High learning rate destabilizes training |
I interpret the Li-ion battery prediction results in the context of battery management. Accurate remaining useful life estimates can help schedule charging and discharging so that a Li-ion battery is not pushed into unsafe or inefficient regions. They can also support predictive maintenance, second-life assessment, and energy arbitrage in storage systems. In my view, the strongest contribution of the proposed Li-ion battery model is not a single error number but a repeatable pipeline: anomaly removal, normalization, autoregressive justification, sliding-window supervised learning, stacked LSTM training, and multi-metric evaluation.
| Application area | How my Li-ion battery prediction supports it | Expected benefit |
|---|---|---|
| Battery management system | Provides remaining useful life estimates for the Li-ion battery | Safer operation |
| Charging strategy | Adjusts charge plans according to predicted Li-ion battery health | Reduced aging stress |
| Maintenance planning | Flags when a Li-ion battery may need replacement | Lower downtime |
| Energy management | Uses Li-ion battery life predictions in dispatch decisions | Higher energy efficiency |
| Second-life evaluation | Estimates residual value of a retired Li-ion battery | Better reuse decisions |
I acknowledge several limitations in my Li-ion battery study. First, the model is trained on capacity trajectories under specific charge and discharge conditions. If the Li-ion battery is used under very different temperatures, current rates, or depth-of-discharge patterns, the learned mapping may shift. Second, I use capacity as the main input feature; additional features such as voltage, temperature, and internal resistance could improve robustness. Third, the long-term prediction horizon remains challenging because small errors can accumulate when predicting far beyond the observed Li-ion battery cycle range. I therefore treat the predictor as a decision-support component rather than a replacement for safety limits.
| Limitation | Effect on Li-ion battery prediction | Possible response |
|---|---|---|
| Limited operating conditions | Reduced transferability across Li-ion battery use cases | Collect more diverse aging data |
| Single main feature | Misses thermal and electrical stress signals | Add voltage and temperature channels |
| Error accumulation | Long-horizon Li-ion battery life estimates drift | Use recursive updating and uncertainty bounds |
| Data noise | Local fluctuations can mislead training | Keep anomaly-aware preprocessing |
| Computational cost | Stacked LSTM needs more resources than shallow models | Use pruning or compact hidden sizes |
For future work, I plan to extend the Li-ion battery model with multi-feature inputs and probabilistic output layers. A Bayesian LSTM or a quantile regression layer could provide uncertainty bounds for the remaining useful life of a Li-ion battery. I also plan to test transfer learning across Li-ion battery chemistries and form factors. If a model trained on one Li-ion battery type can be fine-tuned on another with limited data, the practical value of data-driven Li-ion battery life prediction will increase substantially.
I summarize the main conclusions of my Li-ion battery study in the following table. The results support the use of a stacked LSTM with autoregressive preprocessing and sliding-window sampling for Li-ion battery remaining useful life prediction. The model achieves low RE, MAE, and RMSE, and it outperforms a CNN baseline on the same data split. I believe the proposed pipeline can serve as a practical foundation for intelligent Li-ion battery management and energy scheduling.
| Conclusion item | Finding in my Li-ion battery study |
|---|---|
| Main method | Data-driven stacked LSTM for Li-ion battery life prediction |
| Preprocessing | Anomaly removal, normalization, and autoregressive analysis |
| Sample design | Sliding window with step size 1 |
| Best window length | 128 |
| Best learning rate | 0.001 |
| Best Li-ion battery metrics | RE = 0.0873, MAE = 0.0541, RMSE = 0.0734 |
| Comparison with CNN | RE improved by 16.30%, MAE by 42.08%, RMSE by 30.36% |
| Practical value | Supports charging plans, maintenance, and energy efficiency for Li-ion battery systems |
In my final assessment, the Li-ion battery life prediction problem is best treated as a temporal sequence learning problem with physical constraints. The LSTM architecture matches this requirement because it preserves a hidden state and controls information flow through gates. The autoregressive analysis confirms that past Li-ion battery capacity values are informative, while the sliding-window design converts the raw sequence into a supervised learning task. The experimental results show that the proposed Li-ion battery model is accurate, stable, and competitive against a CNN baseline. I therefore conclude that the data-driven Li-ion battery life prediction pipeline presented here provides a useful technical path for safer and more efficient Li-ion battery utilization.