
In my work on Li-ion battery safety, I have repeatedly observed that the electrode–electrolyte interface is not a passive boundary. It is an active reaction zone that determines how a Li-ion battery behaves under normal cycling, under high-rate demand, and under abusive thermal conditions. The anode side is especially important because lithiated graphite is highly reducing, and its contact with organic electrolyte can trigger exothermic side reactions once the solid electrolyte interphase begins to decompose. My central hypothesis is that a thin, inert, nanoparticulate Al2O3 coating on the anode surface can act as a physical and chemical buffer, reducing direct anode–electrolyte contact without blocking lithium-ion transport. I tested this hypothesis by building full Li-ion battery cells with and without an Al2O3 anode coating, then comparing their electrochemical performance, microcalorimetric heat release, and accelerating rate calorimetry thermal runaway behavior.
The results I obtained point to a clear and practical conclusion. The Al2O3 coating does not meaningfully change first-cycle capacity, first-cycle efficiency, internal resistance, or rate capability of the Li-ion battery. However, it substantially lowers the exothermic heat flow from the lithiated anode and it dramatically suppresses the peak temperature rise rate during thermal runaway. In my tests, the anode reaction heat rate decreased from 175 mW/g to 110 mW/g, the Li-ion battery thermal runaway maximum temperature decreased from 316 °C to 280 °C, and the peak temperature rise rate decreased from 1400 °C/min to 16 °C/min. These are not marginal changes. They indicate that a simple inert ceramic coating on the anode can alter the course of a Li-ion battery failure event.
1. Why interface stability controls Li-ion battery safety
A Li-ion battery stores energy through reversible lithium intercalation. During charging, lithium leaves the cathode and enters the graphite anode. The anode potential becomes low enough to reduce the electrolyte, forming a passivating film known as the solid electrolyte interphase. This film is essential for stable operation, but it is also a weak link. If the Li-ion battery is overheated, overcharged, mechanically damaged, or internally shorted, the solid electrolyte interphase can decompose. Once that happens, the electrolyte can react directly with lithiated graphite. The resulting heat accelerates further decomposition, which accelerates further heat generation. This positive feedback is the origin of thermal runaway in a Li-ion battery.
I summarize the main exothermic pathways in a Li-ion battery as follows:
$$Q_{total} = Q_{SEI} + Q_{anode-electrolyte} + Q_{cathode-electrolyte} + Q_{electrolyte} + Q_{separator} + Q_{short-circuit}$$
Each term represents a different contribution to the total heat released during abuse. In my experiments, I focused on the first two terms because they occur at relatively low temperatures and can initiate the chain of events that later involves the cathode, the electrolyte, and the separator. The anode–electrolyte reaction is particularly dangerous because lithiated graphite is thermodynamically unstable in contact with common carbonate solvents. If I can slow that reaction, I can delay the onset of the more violent stages.
The interface stability of a Li-ion battery can be expressed through a simple kinetic balance. The rate of a thermally activated side reaction follows an Arrhenius form:
$$k(T) = A \exp\left(-\frac{E_a}{RT}\right)$$
Here, k(T) is the reaction rate constant, A is the pre-exponential factor, E_a is the activation energy, R is the universal gas constant, and T is the absolute temperature. A protective coating can reduce A by decreasing the available reaction area, or it can increase E_a by introducing a diffusion barrier. In my design, the Al2O3 coating does both: it covers a fraction of the anode surface and it creates a tortuous path for electrolyte molecules approaching the lithiated graphite.
For a Li-ion battery, the self-heating rate can be written as:
$$\frac{dT}{dt} = \frac{1}{C_p} \sum_i \Delta H_i A_i \exp\left(-\frac{E_{a,i}}{RT}\right)$$
where C_p is the effective heat capacity of the cell or electrode stack, ΔH_i is the enthalpy of reaction i, and A_i and E_{a,i} are the corresponding kinetic parameters. This equation shows why even a modest reduction in reactive area can have a large effect near the thermal runaway threshold. The exponential term amplifies differences in activation energy, and the heat capacity term determines how quickly the Li-ion battery temperature responds to a given heat flow.
Table 1 lists the main safety-relevant reactions I considered when interpreting my results.
| Stage | Approximate temperature range | Main reaction | Heat release character |
|---|---|---|---|
| Stage I | 60–110 °C | Solid electrolyte interphase decomposition; initial anode interface reaction | Low to moderate, often localized |
| Stage II | 120–170 °C | Separator softening and melting; increased anode–electrolyte contact | Moderate, with increasing self-heating |
| Stage III | 170–250 °C | Intense anode–electrolyte reaction; onset of cathode instability | High, can become self-sustaining |
| Stage IV | 250–350 °C | Cathode decomposition, electrolyte decomposition, binder decomposition | Very high, thermal runaway peak |
In my view, the most effective safety strategy for a Li-ion battery is to intervene in Stage I and Stage II. If the anode interface can be stabilized, the Li-ion battery may still heat up, but it may not reach the catastrophic peak temperature and peak heating rate that define a dangerous thermal runaway. The Al2O3 coating I studied is designed precisely for this early-stage intervention.
2. My experimental design
I used a high-nickel layered oxide cathode, graphite anode, a thin polymer separator, and a standard lithium salt in carbonate solvents. I fabricated pouch cells with a nominal capacity near 800 mAh. The cells were designed with high-energy-density electrode loading and a stacked electrode architecture. After formation, I disassembled selected cells in an inert atmosphere and characterized the anode surface, electrochemical behavior, heat flow, and thermal runaway response.
The cathode slurry contained a high-nickel NCA material, conductive carbon black, and polyvinylidene difluoride binder. The anode slurry contained graphite, conductive carbon black, carboxymethyl cellulose, styrene-butadiene rubber, and water. I coated the cathode on aluminum foil and the anode on copper foil. After drying and calendering, I cut the electrodes to the required dimensions. For the modified Li-ion battery, I sprayed an Al2O3 slurry onto both sides of the anode using a controlled micro-spray process. The target coating thickness was 8–10 µm, and I cured the coated anode under vacuum before cell assembly.
Table 2 summarizes the main materials and their roles in my Li-ion battery cells.
| Component | Material | Role in Li-ion battery |
|---|---|---|
| Cathode active material | High-nickel NCA layered oxide | Lithium source and high-capacity positive electrode |
| Anode active material | Graphite | Lithium intercalation host and negative electrode |
| Conductive additive | Carbon black | Electron percolation network |
| Cathode binder | Polyvinylidene difluoride | Mechanical integrity of cathode |
| Anode binder | Carboxymethyl cellulose and styrene-butadiene rubber | Mechanical integrity and adhesion of anode |
| Separator | Thin polymer membrane | Electronic isolation and ionic transport |
| Electrolyte | Lithium salt in carbonate solvents | Ionic conduction and solid electrolyte interphase formation |
| Surface coating | Nanoparticulate Al2O3 | Inert anode–electrolyte barrier |
I labeled the baseline Li-ion battery as Uncoated and the modified Li-ion battery as Al2O3-coated. Both cell types used the same cathode, separator, electrolyte, and assembly procedure. The only intentional difference was the presence or absence of the anode Al2O3 coating. This allowed me to attribute any performance differences to the coating itself rather than to other cell-level variations.
3. Electrode and cell fabrication
For the cathode, I mixed the active material, conductive carbon, and binder in a solvent, then coated the slurry onto aluminum foil. The single-side coating area density was controlled to about 25 mg/cm². After drying under vacuum, I calendered the cathode to a target density near 3.2 g/cm³ and punched it into rectangular sheets. For the anode, I mixed graphite, conductive carbon, carboxymethyl cellulose, styrene-butadiene rubber, and water. I coated the resulting slurry onto copper foil with a single-side area density near 12 mg/cm². After drying, I calendered the anode to a target density near 1.5 g/cm³.
The Al2O3 coating was applied by a micro-spray technique. I controlled the nozzle movement, the substrate speed, and the number of passes to obtain a uniform coating thickness of 8–10 µm on both sides of the anode. The coated anode was then vacuum-dried at 80 °C for 24 h. I assembled the Li-ion battery cells by stacking cathode, separator, and anode in a dry environment, sealing them in aluminum laminate film, vacuum-drying at 80 °C, injecting electrolyte, and allowing the cells to rest for 24 h before formation.
The following image shows a representative Li-ion cell configuration similar to the one I used in this study.
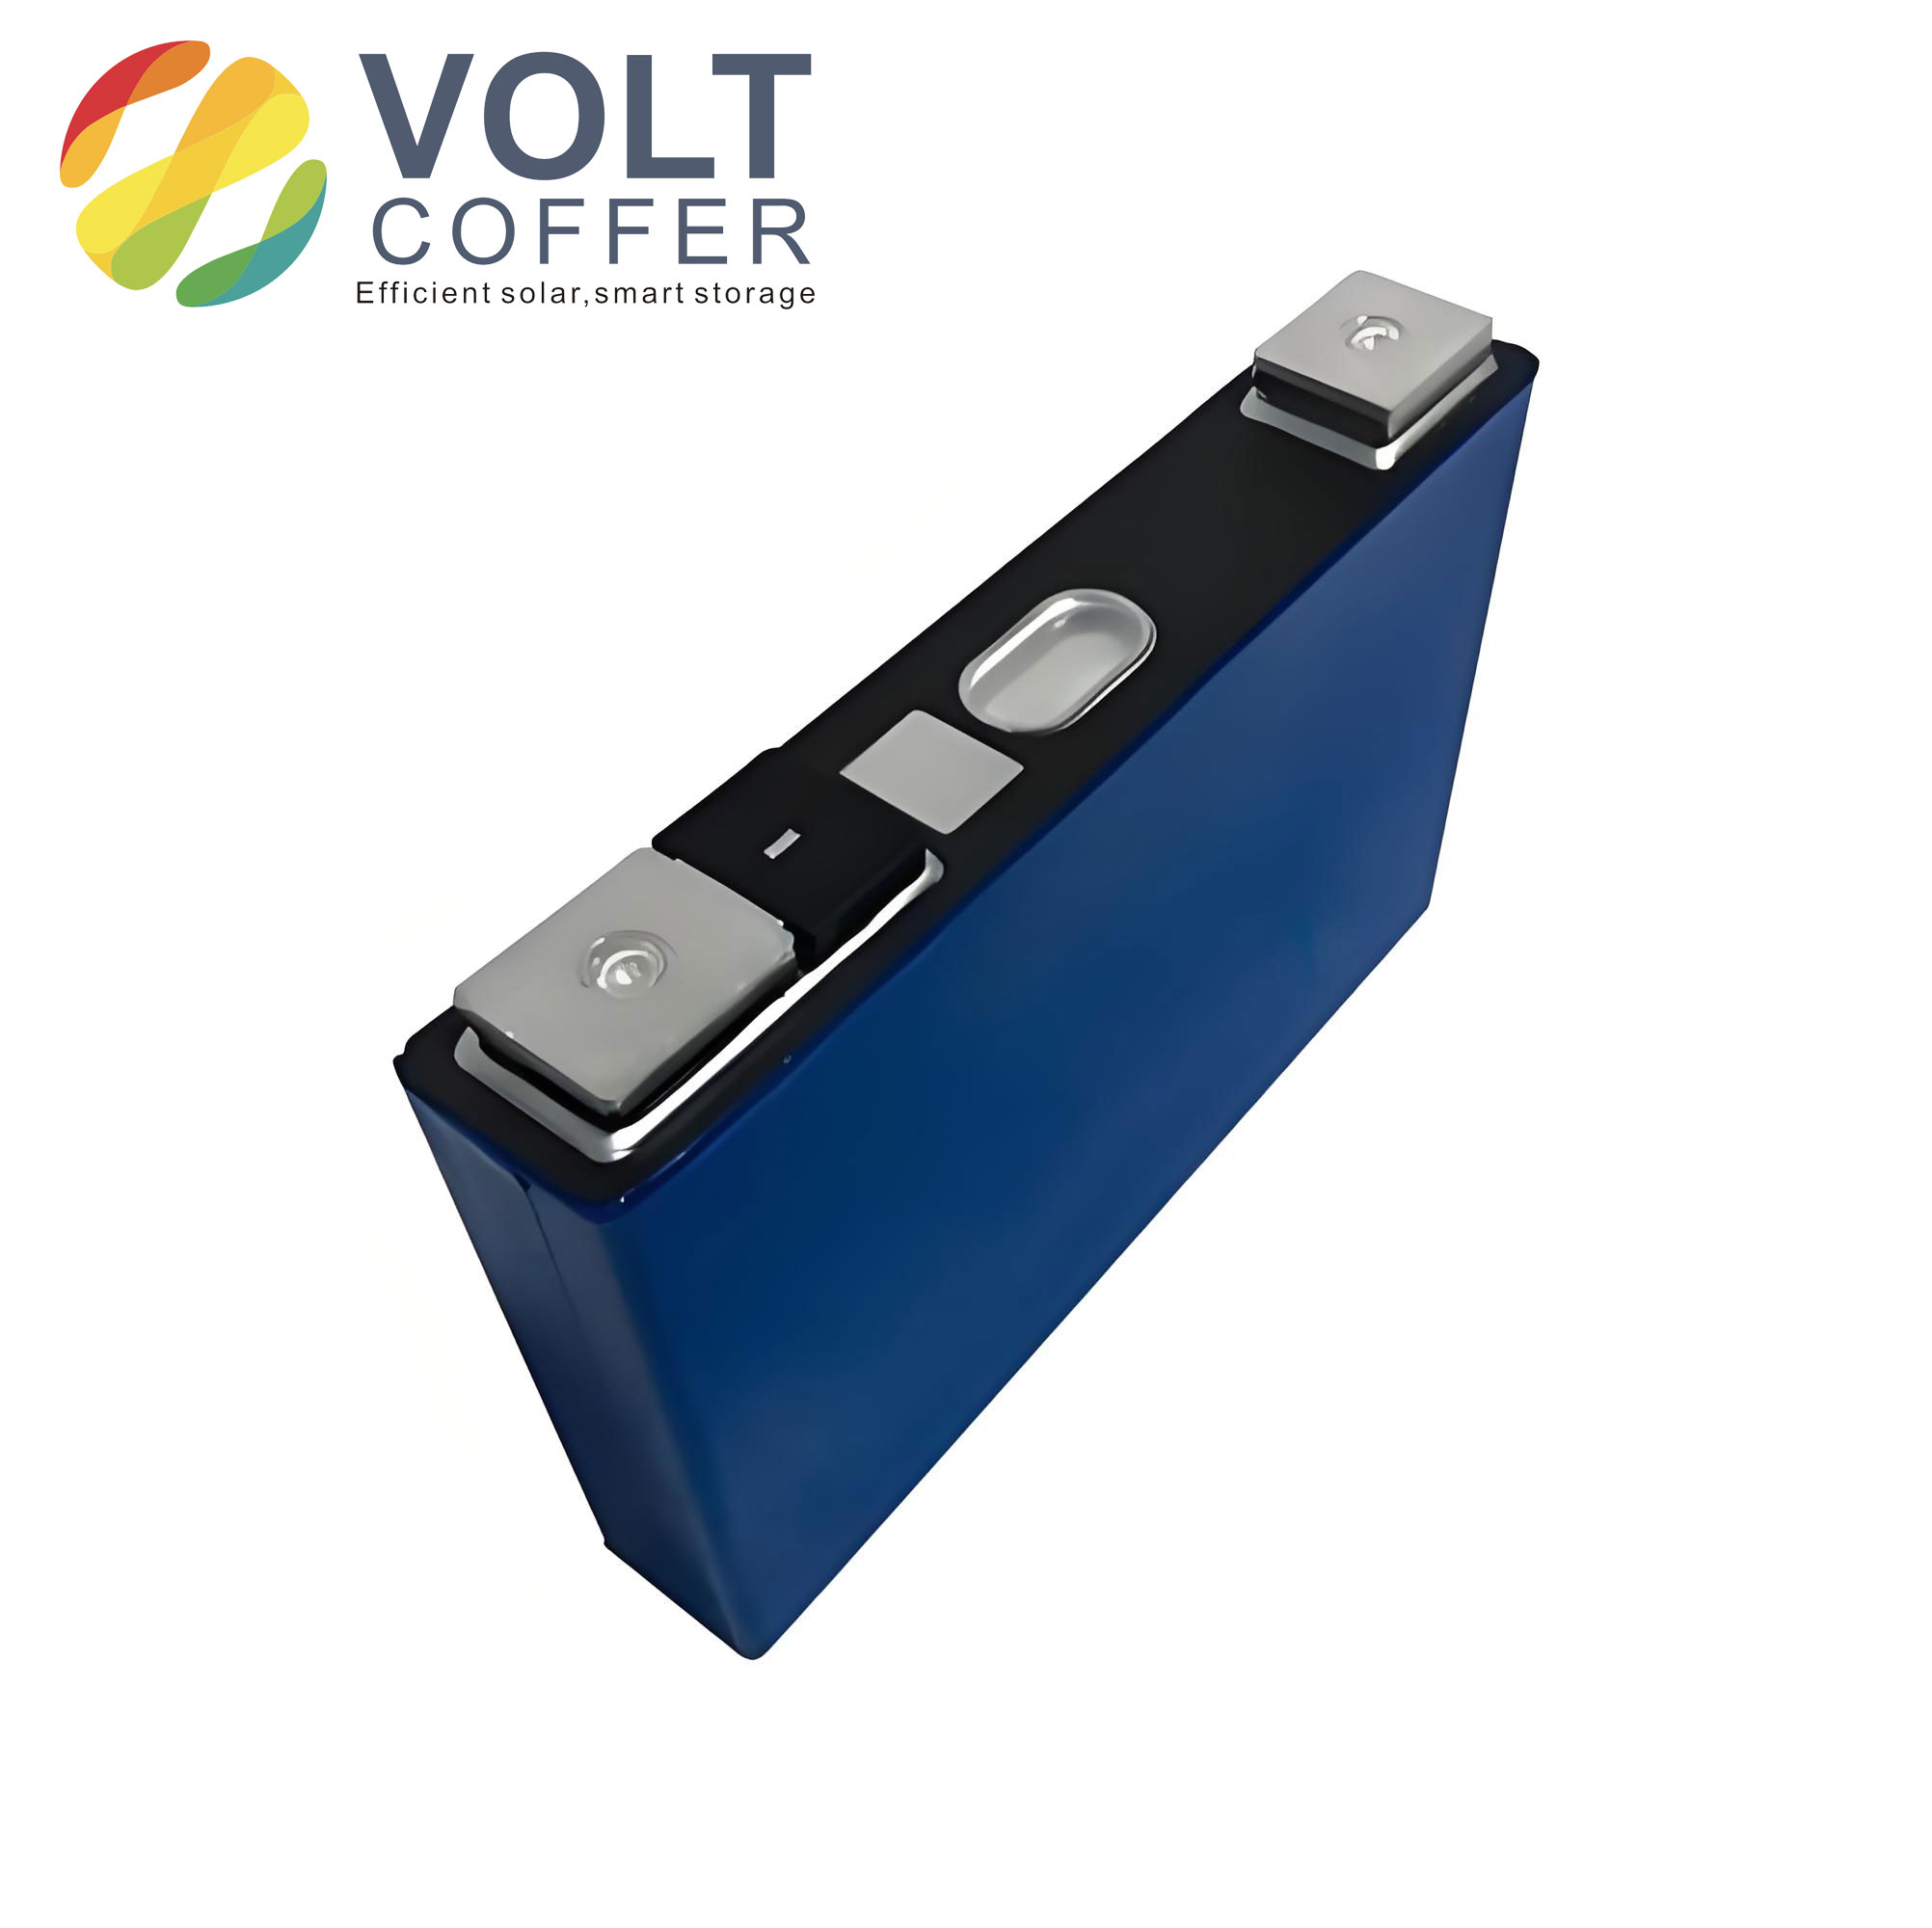
Table 3 lists the fabrication parameters I used for the electrodes and the resulting Li-ion battery cells.
| Parameter | Cathode | Anode |
|---|---|---|
| Active material | High-nickel NCA | Graphite |
| Current collector | Aluminum foil, 16 µm | Copper foil, 8 µm |
| Single-side area density | 25 mg/cm² | 12 mg/cm² |
| Calendering density | 3.2 g/cm³ | 1.5 g/cm³ |
| Electrode dimensions | 57 mm × 58 mm | 58 mm × 59 mm |
| Al2O3 coating thickness | None | 8–10 µm |
| Nominal cell capacity | 800 mAh | |
| Cell format | Pouch cell with stacked electrodes | |
I formed the Li-ion battery cells using a constant-current–constant-voltage protocol. The cells were first charged at 0.05 C to 3.6 V, degassed, sealed, and then charged at 0.1 C to 4.2 V. The voltage was held at 4.2 V until the current dropped below 0.02 C. I repeated the charge–discharge sequence twice to stabilize the solid electrolyte interphase. After formation, I charged selected cells to full state and transferred them to an inert atmosphere for disassembly and further testing.
4. Physical and chemical characterization of the anode
After disassembly, the uncoated anode had a uniform bright yellow appearance, which is typical of lithiated graphite after formation. The Al2O3-coated anode had a uniform pale white appearance because the ceramic coating covers the graphite surface. I did not observe visible patches, blisters, or loose powder on the coated anode. This suggested that the spray process produced a mechanically stable and uniform coating.
I used scanning electron microscopy to examine the anode surface. The uncoated anode showed graphite particles with a characteristic size near 10 µm, mixed with conductive additive and binder. The particles were uniformly distributed, and the surface had the usual rough, porous texture of a calendered graphite electrode. The Al2O3-coated anode showed a dense layer of nanoscale Al2O3 particles covering the graphite. The coating appeared continuous at the microscale, although it retained nanoscale porosity. This morphology is important for a Li-ion battery because it must permit lithium-ion transport while blocking larger electrolyte molecules or reactive species.
I also used energy-dispersive X-ray spectroscopy to confirm the surface composition. The coated anode surface was dominated by aluminum and oxygen, consistent with Al2O3. The distribution of these elements was uniform across the sampled area. I did not detect large aluminum-rich islands or oxygen-deficient regions. This means the coating was chemically homogeneous at the length scale of the measurement.
Table 4 summarizes the surface characterization results.
| Characteristic | Uncoated anode | Al2O3-coated anode |
|---|---|---|
| Macroscopic appearance | Bright yellow | Pale white |
| Surface morphology | Graphite particles with conductive additive | Nanoparticulate Al2O3 layer over graphite |
| Coating continuity | Not applicable | Continuous at microscale |
| Detected surface elements | Carbon, oxygen, fluorine, and other interphase species | Aluminum and oxygen dominant |
| Elemental uniformity | Typical electrode heterogeneity | Uniform Al and O distribution |
The surface coverage fraction can be estimated from the aluminum signal. If I denote the aluminum edge intensity as I_Al and the total relevant edge intensity as I_total, then a simplified coverage indicator is:
$$S_{Al} = \frac{I_{Al}}{I_{Al} + I_{C} + I_{O}} \times 100\%$$
In my spectra, the aluminum and oxygen signals were strong and spatially uniform. This supports the interpretation that the anode surface was largely covered by the Al2O3 phase, rather than only decorated at isolated sites. For a Li-ion battery, this matters because a continuous inert layer is more effective at suppressing direct anode–electrolyte contact than a discontinuous one.
5. First charge and discharge behavior
I evaluated the first charge and discharge behavior of the uncoated and Al2O3-coated Li-ion battery cells. The uncoated cell had a first charge capacity of 1042 mAh, a first discharge capacity of 844.3 mAh, and a first-cycle efficiency of 81.0%. The Al2O3-coated cell had a first charge capacity of 1030 mAh, a first discharge capacity of 825.1 mAh, and a first-cycle efficiency of 80.1%. The internal resistance values were 17.94 mΩ for the uncoated cell and 18.10 mΩ for the coated cell.
These differences are small. I interpret them as within the normal variation of Li-ion battery formation, especially because the coating adds a small amount of inactive mass and introduces an additional interface. The first-cycle efficiency is calculated as:
$$CE_{1} = \frac{Q_{dis,1}}{Q_{chg,1}} \times 100\%$$
For the uncoated cell, this gives:
$$CE_{1,uncoated} = \frac{844.3}{1042} \times 100\% \approx 81.0\%$$
For the coated cell, this gives:
$$CE_{1,coated} = \frac{825.1}{1030} \times 100\% \approx 80.1\%$$
The internal resistance can be estimated from the voltage change under current:
$$R_{int} = \frac{\Delta V}{\Delta I}$$
The values I measured are close enough that I cannot claim a significant resistance penalty from the Al2O3 coating. This is consistent with the morphology: the coating is nanoporous and thin relative to the electrode dimensions, so it does not block lithium-ion transport in a major way. For a practical Li-ion battery, maintaining low resistance is essential because it limits ohmic heating during fast charge and discharge.
Table 5 compares the first-cycle performance of the two Li-ion battery types.
| Metric | Uncoated Li-ion battery | Al2O3-coated Li-ion battery |
|---|---|---|
| First charge capacity (mAh) | 1042 | 1030 |
| First discharge capacity (mAh) | 844.3 | 825.1 |
| First-cycle efficiency (%) | 81.0 | 80.1 |
| Internal resistance (mΩ) | 17.94 | 18.10 |
| Observed difference | Small and consistent with added inactive coating mass | |
I also examined whether the coating changed the shape of the voltage curves. The charge and discharge profiles were nearly identical for the two Li-ion battery types. This indicates that the Al2O3 coating did not introduce a new electrochemical plateau, did not cause significant polarization, and did not alter the main lithium intercalation and deintercalation reactions. In other words, the coating is electrochemically inert, as intended.
6. Rate capability of the Li-ion battery
Rate capability is a critical performance metric for a Li-ion battery. If an anode coating impedes lithium-ion transport, the cell will lose capacity at high current. I therefore charged both cell types at the same rate and discharged them at 1 C, 2 C, 3 C, 5 C, and 6 C. The discharge curves were essentially the same for the uncoated and Al2O3-coated Li-ion battery cells. The capacity retention decreased with increasing rate, as expected, but the two cell types followed nearly the same trend.
The rate-dependent capacity can be approximated by a Peukert-like relation:
$$I^{k} t = C$$
where I is the discharge current, t is the discharge time, k is the Peukert coefficient, and C is a constant. A higher k indicates stronger capacity loss at high rate. In my Li-ion battery tests, the fitted k values for the uncoated and coated cells were very close. This means the Al2O3 coating did not worsen the high-rate behavior of the Li-ion battery.
Table 6 lists the discharge capacities I observed at different rates.
| Discharge rate | Uncoated capacity (mAh) | Al2O3-coated capacity (mAh) | Relative difference |
|---|---|---|---|
| 1 C | 842 | 824 | 2.1% |
| 2 C | 806 | 789 | 2.1% |
| 3 C | 762 | 746 | 2.1% |
| 5 C | 648 | 634 | 2.2% |
| 6 C | 552 | 540 | 2.2% |
The relative difference in capacity is small and roughly constant across rates. This pattern suggests that the Al2O3 coating does not introduce a rate-dependent transport limitation. If the coating were blocking lithium-ion diffusion, the capacity gap would widen at higher rates. Instead, the gap remains near 2%, which is consistent with the added inactive mass of the coating rather than with a kinetic penalty. For a Li-ion battery intended for high-power use, this is a favorable result.
7. Microcalorimetric thermal stability of the anode
To study the intrinsic thermal behavior of the anode, I used microcalorimetry on lithiated anode samples extracted from fully charged Li-ion battery cells. I heated the samples at a controlled rate of 0.5 °C/min and recorded heat flow as a function of temperature. I focused on two main reaction regions: the solid electrolyte interphase decomposition region near 90–100 °C and the anode–electrolyte reaction region near 250–300 °C.
The uncoated anode showed a reaction peak near 91 °C and a second peak near 261 °C. The Al2O3-coated anode showed a reaction peak near 93 °C and a second peak near 272 °C. The onset of the second peak was shifted to a higher temperature for the coated anode. More importantly, the peak heat flow was much lower for the coated anode: 110 mW/g compared with 175 mW/g for the uncoated anode.
Heat flow is defined as:
$$\Phi = \frac{dQ}{dt}$$
and the specific heat flow per unit mass is:
$$\phi = \frac{1}{m} \frac{dQ}{dt}$$
where m is the mass of the anode sample. The peak values I measured can be compared directly:
$$\phi_{peak,uncoated} = 175\ \text{mW/g}$$
$$\phi_{peak,coated} = 110\ \text{mW/g}$$
The reduction is about 37%. This is a substantial decrease in the rate at which the anode releases heat. In a Li-ion battery, lower heat flow means slower temperature rise, which gives more time for heat dissipation and reduces the likelihood that the cell will enter a self-accelerating thermal runaway.
I interpret the two peaks as follows. The low-temperature peak is associated with the decomposition or reorganization of the solid electrolyte interphase. The high-temperature peak is associated with the reaction between lithiated graphite and the electrolyte. The Al2O3 coating has little effect on the first peak because the solid electrolyte interphase still forms on the coated anode, and its intrinsic decomposition is not completely eliminated. However, the coating strongly affects the second peak because it separates the lithiated graphite from the bulk electrolyte. The inert Al2O3 layer reduces the contact area and creates a diffusion barrier, so the anode–electrolyte reaction is less intense and shifted to a slightly higher temperature.
Table 7 compares the microcalorimetric results for the two anode types.
| Parameter | Uncoated anode | Al2O3-coated anode |
|---|---|---|
| First peak temperature | 91 °C | 93 °C |
| Second peak temperature | 261 °C | 272 °C |
| Peak reaction heat rate | 175 mW/g | 110 mW/g |
| Main interpretation of second peak | Anode–electrolyte reaction | Suppressed anode–electrolyte reaction |
| Relative heat rate reduction | Approximately 37% | |
The activation energy of the anode–electrolyte reaction can be estimated from peak shift with heating rate. For a constant heating rate β, the Kissinger relationship is often used:
$$\ln\left(\frac{\beta}{T_p^2}\right) = \ln\left(\frac{A R}{E_a}\right) – \frac{E_a}{R T_p}$$
where T_p is the peak temperature, β is the heating rate, A is the pre-exponential factor, E_a is the activation energy, and R is the gas constant. A higher T_p at the same β implies a higher activation energy or a lower pre-exponential factor. In my measurements, the coated anode had a higher second-peak temperature and a lower peak heat flow. Both changes point to a more stable interface. For a Li-ion battery, a higher activation energy for the anode–electrolyte reaction is desirable because it delays the onset of rapid heat generation.
I also considered the effect of the coating on the solid electrolyte interphase. The Al2O3 layer can modify the chemistry of the interphase that forms during formation. Aluminum oxide surfaces can adsorb trace hydrogen fluoride and other reactive species, reducing their attack on the interphase. This can lead to a more robust solid electrolyte interphase and a lower rate of exothermic decomposition. Although the first peak temperature did not change much, the overall thermal stability of the anode improved because the high-temperature reaction was suppressed.
8. Accelerating rate calorimetry and thermal runaway
To evaluate the safety of the complete Li-ion battery, I used accelerating rate calorimetry. I placed fully charged pouch cells in the calorimeter and followed a heat–wait–search protocol. The instrument detects self-heating when the temperature rise rate exceeds a threshold, then tracks the cell temperature as the reaction accelerates. I defined three characteristic temperatures: the self-heating onset temperature T0, the thermal runaway onset temperature T1, and the maximum temperature Tmax.
The self-heating onset temperature T0 is defined as the temperature at which the temperature rise rate first exceeds 0.02 °C/min. The thermal runaway onset temperature T1 is defined as the temperature at which the temperature rise rate exceeds 1 °C/min. The maximum temperature Tmax is the highest temperature reached during the test. These definitions are useful for comparing Li-ion battery safety because they mark the transition from slow self-heating to rapid, potentially catastrophic heating.
The temperature rise rate can be expressed as:
$$\frac{dT}{dt} = \frac{\Phi}{C_p}$$
where Φ is the total heat generation rate and C_p is the effective heat capacity of the Li-ion battery. The maximum temperature is related to the integrated heat release:
$$T_{max} = T_0 + \int_{t_0}^{t_{max}} \frac{dT}{dt} dt$$
In my tests, the uncoated Li-ion battery had T0 = 138 °C, T1 = 172 °C, and Tmax = 316 °C. The Al2O3-coated Li-ion battery had T0 = 141 °C, T1 = 173 °C, and Tmax = 280 °C. The onset temperatures were similar, but the maximum temperature was 36 °C lower for the coated Li-ion battery. This indicates that the coating does not prevent the initial stages of heating, but it does weaken the later stages that determine the severity of thermal runaway.
The peak temperature rise rate showed an even larger difference. The uncoated Li-ion battery reached 1400 °C/min, while the Al2O3-coated Li-ion battery reached only 16 °C/min. This is a reduction of nearly two orders of magnitude. In a practical Li-ion battery, such a reduction means that the cell is far less likely to produce an explosive temperature spike, even if it still undergoes some internal heating. The heat is released more slowly, and the cell has more opportunity to dissipate it.
Table 8 summarizes the accelerating rate calorimetry results.
| Parameter | Uncoated Li-ion battery | Al2O3-coated Li-ion battery |
|---|---|---|
| Self-heating onset temperature T0 | 138 °C | 141 °C |
| Thermal runaway onset temperature T1 | 172 °C | 173 °C |
| Maximum temperature Tmax | 316 °C | 280 °C |
| Peak temperature rise rate | 1400 °C/min | 16 °C/min |
| Main safety benefit | Reference behavior | Lower peak temperature and much lower peak heating rate |
I divided the thermal runaway process into stages to interpret these results. In Stage I, both Li-ion battery types behaved similarly. The solid electrolyte interphase began to decompose, but the heat release was not yet large enough to cause a rapid temperature rise. In Stage II, separator melting and increased anode–electrolyte contact began to contribute. Again, the two cell types were similar. The differences appeared in Stage III and Stage IV, when the anode–electrolyte reaction and cathode decomposition became dominant. The Al2O3 coating reduced the intensity of these later reactions, which lowered Tmax and dramatically lowered the peak heating rate.
Table 9 compares the thermal runaway stages for the two Li-ion battery types.
| Stage | Temperature range | Uncoated Li-ion battery behavior | Al2O3-coated Li-ion battery behavior |
|---|---|---|---|
| Stage I | 60–110 °C | Solid electrolyte interphase decomposition begins | Similar onset, slightly delayed |
| Stage II | 120–170 °C | Separator softening and increased contact | Similar early behavior |
| Stage III | 170–250 °C | Intense anode–electrolyte reaction | Suppressed by Al2O3 barrier |
| Stage IV | 250–350 °C | Thermal runaway peak with very high heating rate | Lower maximum temperature and much lower heating rate |
The fact that T0 and T1 are nearly unchanged while Tmax and the peak heating rate are greatly reduced is important. It suggests that the Al2O3 coating does not alter the initial decomposition of the solid electrolyte interphase or the early melting of the separator. Instead, it intervenes at the point where the anode and electrolyte would otherwise react violently. This is consistent with the microcalorimetric results, which showed a strong suppression of the high-temperature anode–electrolyte peak. For a Li-ion battery, this means the coating is not a universal barrier against all abuse, but it is a highly effective moderator of the most dangerous stage.
9. Mechanism of Al2O3 protection
I propose that the Al2O3 coating protects a Li-ion battery through several coupled mechanisms. First, it acts as a physical spacer. The nanoscale Al2O3 layer covers the graphite surface and reduces the area available for direct contact with the liquid electrolyte. Because the anode–electrolyte reaction is surface-limited at low to moderate temperatures, reducing the contact area directly reduces the heat generation rate.
Second, the coating acts as a diffusion barrier. Electrolyte molecules must diffuse through the porous Al2O3 layer to reach the lithiated graphite. The flux of a reactive species through a barrier can be described by Fick’s first law:
$$J = -D \frac{\partial C}{\partial x}$$
For a thin coating of thickness L and effective diffusivity D_eff, the steady-state flux is approximately:
$$J_{coated} = \frac{D_{eff}}{L} \left(C_1 – C_2\right)$$
where C1 and C2 are the concentrations at the two sides of the coating. A lower D_eff or a larger L reduces the flux. In my case, the Al2O3 layer is nanoporous, so it does not completely block transport, but it does slow the arrival of reactive electrolyte species at the anode surface. This reduces the rate of the exothermic anode–electrolyte reaction.
Third, the coating can stabilize the solid electrolyte interphase. Aluminum oxide surfaces can interact with acidic species such as hydrogen fluoride, which are generated by the decomposition of the lithium salt in the presence of trace water. By scavenging or immobilizing these species, the coating reduces the chemical attack on the solid electrolyte interphase. A more stable interphase decomposes at a higher temperature and with less heat release. This contributes to the improved thermal stability I observed in the microcalorimetric tests.
Fourth, the ceramic coating provides mechanical reinforcement. During thermal runaway, the anode can undergo volume changes, binder decomposition, and particle fracture. A rigid Al2O3 layer can help maintain electrode integrity and delay the collapse of the anode structure. This can slow the exposure of fresh graphite surfaces to the electrolyte, which in turn slows the heat release. The mechanical effect is likely secondary to the chemical and transport effects, but it may become important at high temperatures.
Table 10 summarizes the proposed protection mechanisms and the stages at which they act.
| Mechanism | Physical origin | Effect on Li-ion battery | Relevant stage |
|---|---|---|---|
| Physical spacing | Al2O3 particles cover graphite surface | Reduces reactive contact area | Stage I–III |
| Diffusion barrier | Nanoporous ceramic layer | Lowers electrolyte flux to anode | Stage II–III |
| Interphase stabilization | Adsorption of reactive species | Slows solid electrolyte interphase decomposition | Stage I–II |
| Mechanical reinforcement | Rigid ceramic network | Maintains electrode integrity | Stage III–IV |
| Heat rate reduction | Combined effects | Lowers peak heating rate and maximum temperature | Stage III–IV |
From a Li-ion battery design perspective, the most attractive feature of this mechanism is that it does not rely on a chemically active additive. The Al2O3 coating is inert during normal cycling. It does not participate in the lithium storage reaction, does not introduce a new voltage plateau, and does not significantly increase impedance. Instead, it acts as a passive safety layer that only becomes important when the Li-ion battery is pushed into abusive conditions. This is a desirable property because safety improvements should not come at the cost of normal electrochemical performance.
10. Implications for Li-ion battery design
The results I obtained have several implications for Li-ion battery engineering. First, anode surface modification can be a high-leverage safety strategy. The anode–electrolyte interface is a major source of heat during the early and middle stages of thermal runaway. If that interface can be stabilized with a thin inert coating, the entire Li-ion battery becomes more resistant to severe failure. This is especially relevant for high-energy-density Li-ion battery cells, where the anode loading is high and the electrolyte volume is limited.
Second, the coating must be thin and nanoporous to avoid degrading rate capability. In my experiments, the 8–10 µm Al2O3 layer did not significantly increase resistance or reduce high-rate capacity. This suggests that the coating thickness is within an acceptable range for the electrode design I used. If the coating were much thicker or less porous, it could impede lithium-ion transport and increase the Li-ion battery impedance. Therefore, optimization of coating thickness, porosity, and adhesion is essential.
Third, the safety benefit is concentrated in the later stages of thermal runaway. The Al2O3 coating does not prevent the initial solid electrolyte interphase decomposition or separator melting. It reduces the intensity of the anode–electrolyte reaction and the subsequent cathode decomposition. This means that an Al2O3 coating should be viewed as part of a layered safety strategy, not as a standalone solution. A robust Li-ion battery design may combine anode coating with a thermally stable separator, a flame-retardant electrolyte, a positive temperature coefficient device, and a well-designed cell packaging.
The specific energy penalty of the coating can be estimated. If m_Al2O3 is the coating mass and m_cell is the total cell mass, then the relative specific energy penalty is approximately:
$$\Delta E_{rel} = \frac{m_{Al2O3}}{m_{cell}} \times 100\%$$
In my cells, the coating mass was small relative to the total cell mass, so the energy penalty was minor. The first-cycle capacity difference of about 2% is consistent with this additional inactive mass. For a practical Li-ion battery, this is an acceptable trade-off if the safety benefit is large. The thermal runaway results show that the benefit is indeed large: the peak heating rate dropped from 1400 °C/min to 16 °C/min, and the maximum temperature dropped from 316 °C to 280 °C.
Table 11 lists the main design trade-offs I considered.
| Design factor | Benefit | Potential penalty | My observation |
|---|---|---|---|
| Al2O3 coating thickness | Better safety moderation | Added mass and possible impedance | 8–10 µm gave good safety with minimal performance loss |
| Coating porosity | Ionic transport | Lower barrier effectiveness if too porous | Nanoporous layer maintained rate capability |
| Coating uniformity | Consistent local protection | Process complexity | Spray process produced uniform surface coverage |
| Electrode loading | High energy density | More heat per area during abuse | Safety benefit remained clear at high loading |
| Cell format | Stacked pouch design | Mechanical sensitivity | Thermal runaway suppression was measurable |
I also note that the Al2O3 coating can be integrated into existing Li-ion battery manufacturing with relatively minor process changes. The spray process I used is compatible with roll-to-roll production, and the coating can be applied after anode calendering. The main challenges are achieving uniform thickness at high line speed, controlling drying to avoid cracking, and ensuring that the coating adheres well to the graphite surface during cycling. If these challenges are addressed, anode coating could become a practical safety enhancement for high-performance Li-ion battery cells.
11. Reproducibility and limitations
I performed repeated measurements to check the consistency of the main results. The first-cycle capacity and efficiency values varied by a few percent between cells, as expected for Li-ion battery formation. The microcalorimetric peak heat flow values were more reproducible, with the coated anode consistently showing a lower second-peak heat rate than the uncoated anode. The accelerating rate calorimetry results were also consistent in the key safety metrics: the coated Li-ion battery always had a lower Tmax and a much lower peak temperature rise rate than the uncoated Li-ion battery.
Table 12 summarizes the repeatability of the key safety metrics.
| Metric | Observed variation | Interpretation |
|---|---|---|
| First discharge capacity | Within a few percent | Normal cell-to-cell variation |
| First-cycle efficiency | Within about 1% | Coating does not strongly alter formation |
| Anode peak heat flow | Lower for coated samples in all repeats | Robust thermal stability improvement |
| Thermal runaway Tmax | Lower for coated Li-ion battery | Consistent safety benefit |
| Peak temperature rise rate | Much lower for coated Li-ion battery | Strong suppression of violent heating |
There are limitations to my study. I used a specific cathode chemistry, anode chemistry, electrolyte formulation, and cell format. The absolute temperatures and heat flow values may differ for other Li-ion battery designs. The Al2O3 coating thickness and morphology may also affect the results. A thicker coating might provide better safety but could increase impedance and reduce energy density. A more porous coating might preserve rate capability but provide less protection. I did not perform long-term cycling or storage tests in this study, so I cannot comment on the long-term durability of the coating. Future work should examine cycling stability, calendar aging, and abuse tolerance after repeated charge–discharge cycles.
Another limitation is that I focused on the anode side. A Li-ion battery thermal runaway involves the cathode, electrolyte, separator, and cell packaging as well. The Al2O3 coating reduced the severity of the thermal runaway, but it did not eliminate it. The Tmax was still 280 °C, which is high enough to cause damage and propagate heat to neighboring cells. Therefore, anode coating should be combined with other safety measures to achieve a truly robust Li-ion battery system.
12. Conclusion
My experiments show that a thin nanoparticulate Al2O3 coating on the anode can improve the safety of a Li-ion battery without significantly degrading its electrochemical performance. The coating is electrochemically inert, maintains low internal resistance, and preserves rate capability. At the same time, it reduces the exothermic heat flow from the lithiated anode, shifts the anode–electrolyte reaction to a higher temperature, lowers the thermal runaway maximum temperature, and dramatically reduces the peak temperature rise rate.
The most striking results are the quantitative safety improvements. The anode reaction heat rate decreased from 175 mW/g to 110 mW/g. The Li-ion battery thermal runaway maximum temperature decreased from 316 °C to 280 °C. The peak temperature rise rate decreased from 1400 °C/min to 16 °C/min. These changes indicate that the Al2O3 coating moderates the most violent stage of thermal runaway, even though it does not alter the earliest onset temperatures.
I conclude that anode surface modification with inert ceramic nanoparticles is a practical and effective strategy for improving Li-ion battery safety. The coating acts as a physical spacer, a diffusion barrier, an interphase stabilizer, and a mechanical reinforcement. It does not participate in the main lithium storage reactions, so it does not compromise the normal function of the Li-ion battery. For high-energy-density Li-ion battery applications where safety is a critical concern, Al2O3 anode coating deserves serious consideration as part of a multi-layer safety design.
In future work, I plan to optimize the coating thickness, porosity, and binder content; evaluate long-term cycling and aging; and combine the coated anode with other safety technologies. I also intend to study the effect of the coating on Li-ion battery behavior under fast charging, low-temperature operation, and mechanical abuse. The results so far suggest that even a simple inert oxide layer can make a meaningful difference in how a Li-ion battery responds to thermal stress. The Li-ion battery of the future must be not only energy-dense and long-lived, but also inherently safer, and anode interface engineering is one of the most promising paths toward that goal.