
In the pursuit of carbon neutrality, building-integrated photovoltaic (PV) storage systems have emerged as a critical solution for decarbonizing the building sector. However, the inherent randomness of solar irradiance and the stochastic nature of occupant behavior introduce significant uncertainties in both PV generation and building load. These uncertainties challenge the economic dispatch of energy flows. Conventional deterministic optimization methods, which rely on single-point forecasts, often yield suboptimal or even infeasible schedules under real-world conditions. To address this issue, we propose a stochastic optimization framework that explicitly accounts for prediction errors through scenario generation and reduction techniques. Our approach is built on a real-world hybrid inverter with multiple operating modes—i.e., different types of solar inverters—and respects the physical constraints of battery storage and grid interaction. In this paper, we present the modeling, simulation, and experimental validation of our strategy, demonstrating its superiority over both the inverter’s default control and traditional deterministic optimization, especially when forecast accuracy is low.
The remainder of this paper is organized as follows. Section 2 describes the prediction models for building load and PV generation using XGBoost. Section 3 details the uncertainty quantification through Latin hypercube sampling and scenario reduction. Section 4 formulates the optimization problem based on the real inverter’s logic and constraints. Section 5 presents simulation case studies under varying forecast accuracy. Section 6 reports experimental results from a laboratory testbed. Section 7 concludes the paper.
1. Prediction Models for PV Generation and Building Load
We built hourly prediction models using the Extreme Gradient Boosting (XGBoost) algorithm. For building load, input features include hour of day, weekday indicator, outdoor temperature, and solar radiation. For PV generation, inputs are hour of day, temperature, and solar radiation. The models were trained on data from April 18 to June 18, 2018, for a typical office building in Shenzhen, China. The prediction performance was evaluated using the Root Mean Square Error (RMSE) and the coefficient of determination (R²). The definitions are given below:
$$ \text{RMSE} = \sqrt{\frac{1}{n}\sum_{i=1}^n (\hat{y}_i – y_i)^2} $$
$$ R^2 = 1 – \frac{\sum_{i=1}^n (\hat{y}_i – \bar{y})^2}{\sum_{i=1}^n (y_i – \bar{y})^2} $$
where \(\hat{y}_i\) is the predicted value, \(y_i\) the actual value, and \(\bar{y}\) the mean of actual values.
Table 1 summarizes the prediction performance for the validation period (June 19 to August 19). The models achieved good accuracy, with R² values of 0.89 for PV and 0.90 for load.
| Variable | R² | RMSE (kWh) |
|---|---|---|
| PV generation | 0.89 | 0.69 |
| Building load | 0.90 | 0.72 |
The residuals (prediction errors) were computed as:
$$ e_{\text{pv}}(t) = P_{\text{pv}}^{\text{actual}}(t) – P_{\text{pv}}^{\text{pred}}(t) $$
$$ e_{\text{load}}^{\text{workday}}(t) = P_{\text{load}}^{\text{actual}}(t) – P_{\text{load}}^{\text{pred}}(t) $$
$$ e_{\text{load}}^{\text{non-workday}}(t) = P_{\text{load}}^{\text{actual}}(t) – P_{\text{load}}^{\text{pred}}(t) $$
where the load errors are separated by weekday and non-weekday due to distinct consumption patterns.
2. Uncertainty Modeling via Scenario Generation and Reduction
To capture the stochastic nature of PV and load, we first derived the empirical cumulative distribution function (CDF) of the prediction errors for each hour. For PV, the error distribution was assumed to follow a normal distribution \(N(\mu, \sigma^2)\) with parameters estimated from the training residual data. The variances \(\sigma^2\) for each hour (0:00–23:00) are listed in Table 2 for both PV and load (workday/non-workday).
| Hour | PV \(\sigma^2\) | Load (workday) \(\sigma^2\) | Load (non-workday) \(\sigma^2\) |
|---|---|---|---|
| 0:00 | 0.00 | 0.02 | 0.02 |
| 1:00 | 0.00 | 0.34 | 0.01 |
| … | … | … | … |
| 12:00 | 1.70 | 0.24 | 0.19 |
| 13:00 | 1.68 | 0.20 | 0.20 |
| … | … | … | … |
We employed Latin Hypercube Sampling (LHS) to generate a large set of scenarios (e.g., 1000) from the error distributions. LHS ensures better coverage of the probability space than simple Monte Carlo. The generated scenarios represent possible realizations of PV generation and building load by adding sampled errors to the point forecasts. To reduce computational burden, the initial scenario set was reduced to a small number of representative scenarios using the simultaneous backward reduction method, which iteratively removes the scenario with the smallest Euclidean distance weighted by probability and redistributes its probability to the nearest neighbor. The Euclidean distance between two scenarios \(\mathbf{x}_i\) and \(\mathbf{x}_j\) over 24 hours is:
$$ D_k(\mathbf{x}_i, \mathbf{x}_j) = \sqrt{\sum_{t=1}^{24} (x_{i,t} – x_{j,t})^2 } $$
After reduction, we obtained 5 typical scenarios for PV and 5 for load, resulting in 25 combined scenarios (5×5) with associated probabilities. Example scenarios for a workday (August 21) and a non-workday (August 25) are illustrated conceptually. The probabilities of each combined scenario are listed in Table 3 for workday and Table 4 for non-workday.
| Scenario | PV1 | PV2 | PV3 | PV4 | PV5 |
|---|---|---|---|---|---|
| Load1 | 0.08 | 0.05 | 0.04 | 0.03 | 0.02 |
| Load2 | 0.06 | 0.07 | 0.03 | 0.04 | 0.01 |
| … | … | … | … | … | … |
| Scenario | PV1 | PV2 | PV3 | PV4 | PV5 |
|---|---|---|---|---|---|
| Load1 | 0.10 | 0.02 | 0.03 | 0.01 | 0.04 |
| … | … | … | … | … | … |
3. Optimization Model Considering Inverter Operation Logic
A real hybrid inverter—representing one of the common types of solar inverters—was used in this study. The inverter allows three operation modes: Load Priority, Battery Priority, and Grid Priority. In each mode, energy flow follows a specific logic. For instance, in Load Priority mode, PV power first serves the load; surplus PV charges the battery or feeds to the grid based on the state of charge (SOC) and the user-defined cutoff SOC. In Battery Priority mode, PV first charges the battery until it reaches the target SOC, then serves the load. In Grid Priority mode, PV power is preferentially exported to the grid, and the battery can also discharge to the grid. The control variables are the operation mode (3 choices) and the cutoff SOC (an integer from 10% to 100%) for each hour, giving 2×24 = 48 decision variables per day.
The objective is to minimize the expected daily net electricity cost. For the deterministic case (single scenario), the cost is:
$$ \text{COST}(d) = \sum_{t=1}^{24} \left[ P_{\text{grid,buy}}(t) \cdot C_e(t) – P_{\text{grid,sell}}(t) \cdot C_i(t) \right] $$
where \(C_e(t)\) and \(C_i(t)\) are the buying and selling electricity prices (Table 5).
| Period | Purchase price | Sell price |
|---|---|---|
| Valley (0:00–8:00) | 0.2894 | 0.2894 |
| Flat (8:00–10:00, 12:00–14:00, 19:00–24:00) | 1.0000 | 0.4000 |
| Peak (10:00–12:00, 14:00–19:00) | 1.3553 | 0.4000 |
For the stochastic optimization, the objective becomes the weighted sum over all scenarios:
$$ \text{COST}(d) = \sum_{\omega \in \Omega} \text{prob}(\omega) \sum_{t=1}^{24} \left[ P_{\text{grid,buy}}(t,\omega) \cdot C_e(t) – P_{\text{grid,sell}}(t,\omega) \cdot C_i(t) \right] $$
where \(\Omega\) is the set of combined scenarios, and \(\text{prob}(\omega)\) is the probability of scenario \(\omega\).
The constraints include energy balance equations:
$$ P_{\text{pv}}(t) = P_{\text{pv}\to\text{load}}(t) + P_{\text{pv}\to\text{battery}}(t) + P_{\text{pv}\to\text{grid}}(t) $$
$$ P_{\text{grid,buy}}(t) = P_{\text{grid}\to\text{load}}(t) + P_{\text{grid}\to\text{battery}}(t) $$
$$ P_{\text{grid,sell}}(t) = P_{\text{pv}\to\text{grid}}(t) + P_{\text{battery}\to\text{grid}}(t) $$
$$ P_{\text{battery,charge}}(t) = P_{\text{pv}\to\text{battery}}(t) + P_{\text{grid}\to\text{battery}}(t) $$
$$ P_{\text{battery,discharge}}(t) = P_{\text{battery}\to\text{load}}(t) + P_{\text{battery}\to\text{grid}}(t) $$
$$ P_{\text{load}}(t) = P_{\text{pv}\to\text{load}}(t) + P_{\text{grid}\to\text{load}}(t) + P_{\text{battery}\to\text{load}}(t) $$
Physical limits of the inverter and battery are:
$$ P_{\text{pv}}(t) \leq 9280 \, \text{W} $$
$$ P_{\text{charge}}(t) \leq 5120 \, \text{W} $$
$$ P_{\text{discharge}}(t) \leq 5120 \, \text{W} $$
$$ P_{\text{grid,buy}}(t) \leq 6080 \, \text{W} $$
$$ P_{\text{grid,sell}}(t) \leq 6080 \, \text{W} $$
The battery SOC dynamics follow:
$$ \text{SOC}(t+1) = \text{SOC}(t) + \eta_{\text{ch}} P_{\text{charge}}(t) \Delta t / E_{\text{rated}} – P_{\text{discharge}}(t) \Delta t / ( \eta_{\text{disch}} E_{\text{rated}} ) $$
with the constraint \(0.1 \leq \text{SOC}(t) \leq 1.0\).
We solved the optimization using a genetic algorithm (GA) with a population size of 200 and 500 generations. The algorithm was implemented in Python. For the stochastic case, each evaluation required simulating all 25 scenarios, which increased computational time but remained acceptable for day-ahead planning.
4. Simulation Case Studies
We conducted simulations for seven consecutive days (August 20–26) under three levels of forecast accuracy: high (R²=0.9), medium (R²=0.85), and low (R²=0.8). The low-accuracy predictions were generated by training a purposely under-tuned Support Vector Regression (SVR) model. We compared the net electricity cost of the stochastic optimization (with 25 scenarios) against a deterministic optimization that used only the point forecast. The results are summarized in Tables 6–8.
| Date | Deterministic (yuan) | Stochastic (yuan) | Change |
|---|---|---|---|
| Aug 20 | 60.59 | 59.69 | -1.48% |
| Aug 21 | 43.09 | 41.97 | -2.60% |
| Aug 22 | 35.21 | 35.48 | +0.77% |
| Aug 23 | 55.88 | 56.22 | +0.61% |
| Aug 24 | 47.53 | 47.74 | +0.44% |
| Aug 25 | -15.24 | -14.30 | +6.17% |
| Aug 26 | -8.97 | -8.81 | +1.78% |
| Date | Deterministic (yuan) | Stochastic (yuan) | Change |
|---|---|---|---|
| Aug 20 | 62.55 | 58.77 | -6.04% |
| Aug 21 | 47.25 | 43.12 | -8.72% |
| Aug 22 | 37.95 | 35.23 | -7.17% |
| Aug 23 | 57.55 | 53.73 | -6.64% |
| Aug 24 | 54.86 | 51.65 | -5.85% |
| Aug 25 | -14.32 | -13.35 | +6.77% |
| Aug 26 | -9.14 | -8.98 | +1.75% |
| Date | Deterministic (yuan) | Stochastic (yuan) | Change |
|---|---|---|---|
| Aug 20 | 61.26 | 57.79 | -5.66% |
| Aug 21 | 46.97 | 42.38 | -9.77% |
| Aug 22 | 39.24 | 35.19 | -10.32% |
| Aug 23 | 55.49 | 51.59 | -7.21% |
| Aug 24 | 55.50 | 51.90 | -6.48% |
| Aug 25 | -13.35 | -13.43 | +0.06% |
| Aug 26 | -6.65 | -9.09 | -36.69% |
From these tables, we observe that when forecast accuracy is high (R²=0.90), the stochastic method offers only marginal improvements and sometimes even slightly worse performance on days with negative net costs. However, as accuracy decreases, the stochastic approach consistently outperforms the deterministic one, especially on workdays. Remarkably, on August 26 with R²=0.80, the net cost decreased by 36.69% (from -6.65 to -9.09 yuan), meaning the system earned more from selling electricity. This demonstrates that the stochastic method is more robust to prediction errors, a common challenge in real operations.
5. Experimental Validation
To validate the proposed strategy in a realistic environment, we built a laboratory-scale PV-storage system consisting of a hybrid inverter, a 10.24 kWh LiFePO4 battery, a solar array simulator (PVS1000D), and a variable resistive load bank (10 kW, 100 W resolution). The inverter supports three distinct types of solar inverters—load priority, battery priority, and grid priority—which we modeled exactly in the optimization.
We designed a two-day experiment: Day 1 used the inverter’s default control (always Load Priority mode with cutoff SOC=10%), and Day 2 applied the optimized schedule from our stochastic method. To ensure fair comparison, the PV generation and load profiles were identical for both days, generated by the solar simulator and load bank based on actual data from a real office building on October 17, 2024. The solar simulator was programmed with the same I-V curve parameters each day, and the load bank followed the same hourly schedule.
The optimization was run for the test day using a low-accuracy prediction model (R²=0.80) trained on data from August–September 2024. The resulting control schedule (mode and cutoff SOC for each hour) is shown in Table 9.
| Hour | Mode | Cutoff SOC | Hour | Mode | Cutoff SOC |
|---|---|---|---|---|---|
| 0:00 | Battery Priority | 51% | 12:00 | Load Priority | 72% |
| 1:00 | Battery Priority | 87% | 13:00 | Battery Priority | 87% |
| 2:00 | Battery Priority | 87% | 14:00 | Load Priority | 37% |
| 3:00 | Battery Priority | 95% | 15:00 | Load Priority | 32% |
| 4:00 | Battery Priority | 87% | 16:00 | Load Priority | 45% |
| 5:00 | Battery Priority | 100% | 17:00 | Load Priority | 10% |
| 6:00 | Battery Priority | 65% | 18:00 | Load Priority | 10% |
| 7:00 | Battery Priority | 63% | 19:00 | Load Priority | 10% |
| 8:00 | Load Priority | 59% | 20:00 | Load Priority | 10% |
| 9:00 | Load Priority | 59% | 21:00 | Load Priority | 10% |
| 10:00 | Load Priority | 86% | 22:00 | Load Priority | 10% |
| 11:00 | Load Priority | 68% | 23:00 | Grid Priority | 10% |
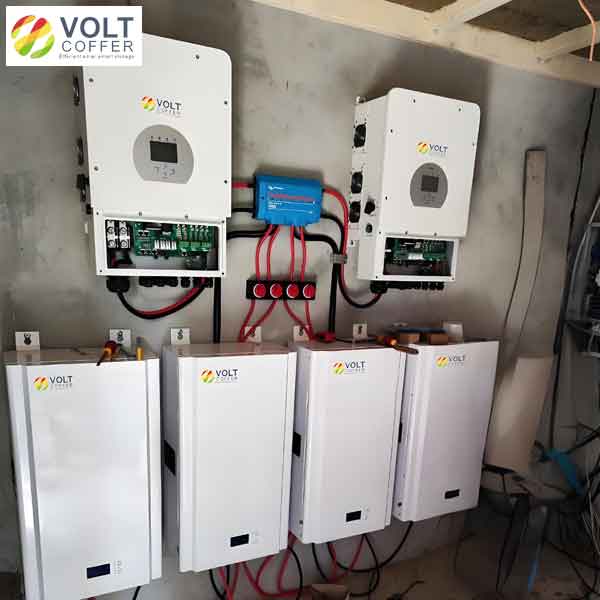
Figure 1 shows the experimental setup with the solar array simulator and load bank connected to the hybrid inverter, representing one of the key types of solar inverters used in residential applications.
The experimental results are summarized in Table 10. The net electricity cost with the default control was 40.52 yuan, while the stochastic optimization achieved 33.84 yuan—a reduction of 16.49%. The battery SOC trajectory under the optimized strategy showed valley charging from 0:00 to 8:00 (reaching 100% SOC), partial discharge during the flat period, and deep discharge during the peak period (14:00–19:00), thereby maximizing the benefit of price arbitrage. The inverter’s mode switching, controlled by our schedule, leveraged all three types of solar inverters’ operating modes to achieve the best economic performance.
| Control Strategy | Net electricity cost (yuan) |
|---|---|
| Default (Load Priority) | 40.52 |
| Stochastic optimization | 33.84 |
| Cost reduction | 16.49% |
The computational time for generating the schedule (including prediction, scenario generation, and GA optimization) was approximately 30 seconds per hour, which is acceptable for day-ahead planning. The experiment confirmed that the stochastic method not only reduces costs in simulation but also performs reliably in hardware-in-the-loop testing.
6. Discussion
Our results highlight the importance of considering uncertainty in building PV-storage scheduling. While deterministic optimization works well when forecasts are nearly perfect, real-world solar irradiance and occupant behavior are intrinsically variable. The stochastic scenario-based approach provides a systematic way to hedge against prediction errors. The benefit is especially pronounced when forecast accuracy is low—a common situation in practice due to changing weather, data quality issues, or model limitations. By using multiple typical scenarios, the optimizer learns to avoid decisions that are too aggressive under a single forecast, leading to more robust schedules.
The inverter’s flexible operation modes—one of the critical types of solar inverters—enable the optimizer to choose the most cost-effective energy flow path at each hour. For example, using Battery Priority mode during off-peak hours allows the battery to charge fully from the grid at low prices, while Load Priority mode during peak hours prioritizes PV self-consumption. Grid Priority mode can be used to sell excess battery energy when prices are favorable. Our optimization framework automatically discovers these synergies.
It is worth noting that the number of typical scenarios (5 for PV and 5 for load) was chosen as a trade-off between computational burden and representation accuracy. In our tests, increasing the number beyond 25 combined scenarios did not yield significant improvement in the objective value, suggesting that the reduced set captures the essential uncertainty.
7. Conclusion
We have presented a stochastic optimization strategy for building PV-storage systems that accounts for the uncertainty in both PV generation and building load. The method uses XGBoost for forecasting, Latin hypercube sampling with backward reduction for scenario generation, and a genetic algorithm to optimize the operation modes and cutoff SOC of a real hybrid inverter—one of the widely used types of solar inverters. Simulation studies under different forecast accuracies revealed that the stochastic approach significantly outperforms deterministic optimization when prediction errors are large, with cost reductions up to 36.69% on days with net negative costs. Experimental validation on a laboratory testbed demonstrated a 16.49% cost saving compared to the inverter’s default control. The proposed framework is computationally efficient for day-ahead scheduling and can be readily integrated into building energy management systems. Future work will explore online rolling optimization to adapt to intra-day forecast updates and investigate the impact of battery degradation on scheduling decisions.