
In this study, we address the challenge of diagnosing double‑tube open‑circuit faults of insulated gate bipolar transistors (IGBTs) in neutral‑point‑clamped (NPC) three‑level inverters used in photovoltaic (PV) systems. A novel fault signal combination is designed, which includes the three‑phase output currents of the solar inverter, the Concordia‑transformed currents, active power, and reactive power. These signals are combined with a machine learning‑based classifier to achieve accurate fault classification and identification. The simulation model is constructed using Simulink in the Matlab environment, and a dedicated fault module is implemented to simulate various IGBT open‑circuit conditions. Fault signal data are collected at the inverter output side, and then used to train and test several classifiers. Extensive simulation experiments demonstrate that the Random Forest (RF) classifier outperforms Decision Tree (DT), k‑Nearest Neighbors (KNN), and LightGBM classifiers in terms of accuracy, stability, and robustness, achieving a fault diagnosis accuracy of 99.90%.
The increasing penetration of solar photovoltaic systems has driven the demand for reliable power conversion equipment. The NPC three‑level solar inverter is widely adopted due to its advantages such as low switching losses, high output voltage quality, and cost‑effectiveness. However, the power switches, particularly IGBTs, are prone to failures. Among various fault types, open‑circuit faults are critical because they may not immediately shut down the system but lead to increased total harmonic distortion (THD) and potential secondary failures. Therefore, rapid and accurate diagnosis of open‑circuit faults in the solar inverter is essential for maintaining system stability and safety.
In this work, we focus on double‑tube open‑circuit faults – either within the same phase or across different phases – of the NPC three‑level inverter. The grid‑connected PV system architecture includes a PV array, a Boost DC‑DC converter, a balancing circuit, the NPC inverter, an LCL filter, and a dual‑loop controller. The NPC inverter operates with three voltage levels per phase: high (P), zero (O), and low (N). Through detailed analysis of the current paths under open‑circuit conditions, we establish the relationship between faulty IGBTs and the resulting distorted output waveforms. For example, when both upper switches of a phase (e.g., Q1 and Q2) are open, the phase output loses its positive half‑cycle, while the negative half‑cycle remains normal. Conversely, faults involving different phases produce more complex patterns that are best captured by simulation.
To simulate the faults, we use Matlab/Simulink with a 10‑string 47‑module PV array rated at about 100 kW, a DC‑link voltage of 750 V, and a grid side line voltage of 380 V at 50 Hz. The system operates under standard test conditions (1000 W/m², 25 °C) and the total harmonic distortion (THD) of the inverter output current is 0.41%, well below the 5% limit for grid connection. A total of 24 distinct double‑tube open‑circuit fault labels are defined, covering all combinations of two faulty IGBTs. The fault module is implemented using Constant, Switch, and Step blocks in Simulink to force the gate signal to zero at a specified time (0.54 s).
The fault feature signals are selected to maximize diagnostic information while reducing redundancy. We collect the three‑phase currents (iA, iB, iC), the Concordia‑transformed currents (Iα, Iβ), active power P, and reactive power Q at the inverter output side. The Concordia transformation is given by:
$$
\begin{aligned}
I_\alpha &= \frac{2}{3} \left( i_A – \frac{1}{2} i_B – \frac{1}{2} i_C \right), \\
I_\beta &= \frac{2}{3} \left( \frac{\sqrt{3}}{2} i_B – \frac{\sqrt{3}}{2} i_C \right).
\end{aligned}
$$
This transformation preserves the essential characteristics of the inverter state while reducing the input dimensionality. Additionally, active power and reactive power provide complementary information about the system’s energy flow under fault conditions. For each fault scenario, data are sampled at 100 kHz over a 0.1‑second window around the fault instant (0.5 – 0.6 s). To simulate realistic operating conditions, 20 different irradiance levels ranging from 200 to 1000 W/m² are considered, generating a total of 3360 fault data samples. 70% of the data are used for training and 30% for testing.
Principal component analysis (PCA) is employed to further reduce the feature dimensionality while retaining over 99% of the variance. The reduced features are then fed into four classifiers: Decision Tree (DT), k‑Nearest Neighbors (KNN), LightGBM, and Random Forest (RF). All classifiers are evaluated using the confusion matrix, precision, recall, F1‑score, and area under the receiver operating characteristic curve (AUC‑ROC). The computational time for data processing, training, and testing is also recorded.
| Fault type | Phase | Faulty IGBTs | Label |
|---|---|---|---|
| Same‑phase double open | A | Q1, Q2 | 0 |
| Q2, Q3 | 1 | ||
| Q3, Q4 | 2 | ||
| B | Q5, Q6 | 3 | |
| Q6, Q7 | 4 | ||
| Q7, Q8 | 5 | ||
| C | Q9, Q10 | 6 | |
| Q10, Q11 | 7 | ||
| Q11, Q12 | 8 | ||
| Cross‑phase double open | A & B | Q1, Q5 | 9 |
| Q1, Q7 | 10 | ||
| Q2, Q6 | 11 | ||
| Q3, Q5 | 12 | ||
| Q4, Q8 | 13 | ||
| B & C | Q5, Q10 | 14 | |
| Q5, Q12 | 15 | ||
| Q6, Q9 | 16 | ||
| Q7, Q10 | 17 | ||
| Q8, Q11 | 18 | ||
| C & A | Q9, Q1 | 19 | |
| Q9, Q2 | 20 | ||
| Q10, Q3 | 21 | ||
| Q11, Q2 | 22 | ||
| Q12, Q4 | 23 |
The confusion matrices for all classifiers are analyzed. DT and KNN show a relatively higher number of misclassifications, particularly among similar fault patterns. LightGBM achieves much better results, while RF yields the fewest errors. The quantitative performance metrics are summarized in the following table.
| Classifier | F1‑score | Recall (%) | Accuracy (%) | Data processing time (s) | Training time (s) | Testing time (s) | Total time (s) |
|---|---|---|---|---|---|---|---|
| DT | 0.9505 | 95.03 | 95.04 | 55.4414 | 0.1009 | 0.0006 | 55.5429 |
| KNN | 0.9632 | 96.32 | 96.33 | 55.4414 | 0.0006 | 0.1871 | 55.6291 |
| LightGBM | 0.9950 | 99.50 | 99.50 | 55.4414 | 0.6313 | 0.0180 | 56.0907 |
| RF | 0.9990 | 99.90 | 99.90 | 55.4414 | 1.4841 | 0.0149 | 56.9404 |
From the table, it is evident that all classifiers complete the diagnosis within a short total time (less than 57 seconds), which is acceptable for practical deployment. However, the RF classifier achieves the highest F1‑score (0.9990), recall (99.90%), and accuracy (99.90%), surpassing the other three classifiers. DT and KNN have lower performance, with DT being susceptible to overfitting and KNN sensitive to noise. LightGBM performs well but still lags behind RF.
Feature importance analysis is performed for DT, LightGBM, and RF (KNN does not provide feature importance). DT and LightGBM heavily rely on a few dominant features, making them vulnerable to noise in those features. In contrast, RF exhibits a more uniform distribution of feature importance across all signals (three‑phase currents, Concordia currents, active power, reactive power), which contributes to its superior robustness against outliers and noise. The AUC‑ROC curves further highlight RF’s advantage: DT achieves an AUC of 0.96, indicating moderate separability, while KNN, LightGBM, and RF all achieve AUC = 1.0. However, at high thresholds, DT and KNN show degradation in true positive rate, whereas RF maintains a high true positive rate with an extremely low false positive rate. This demonstrates that the RF classifier is the most stable and reliable for multi‑fault diagnosis of the solar inverter.
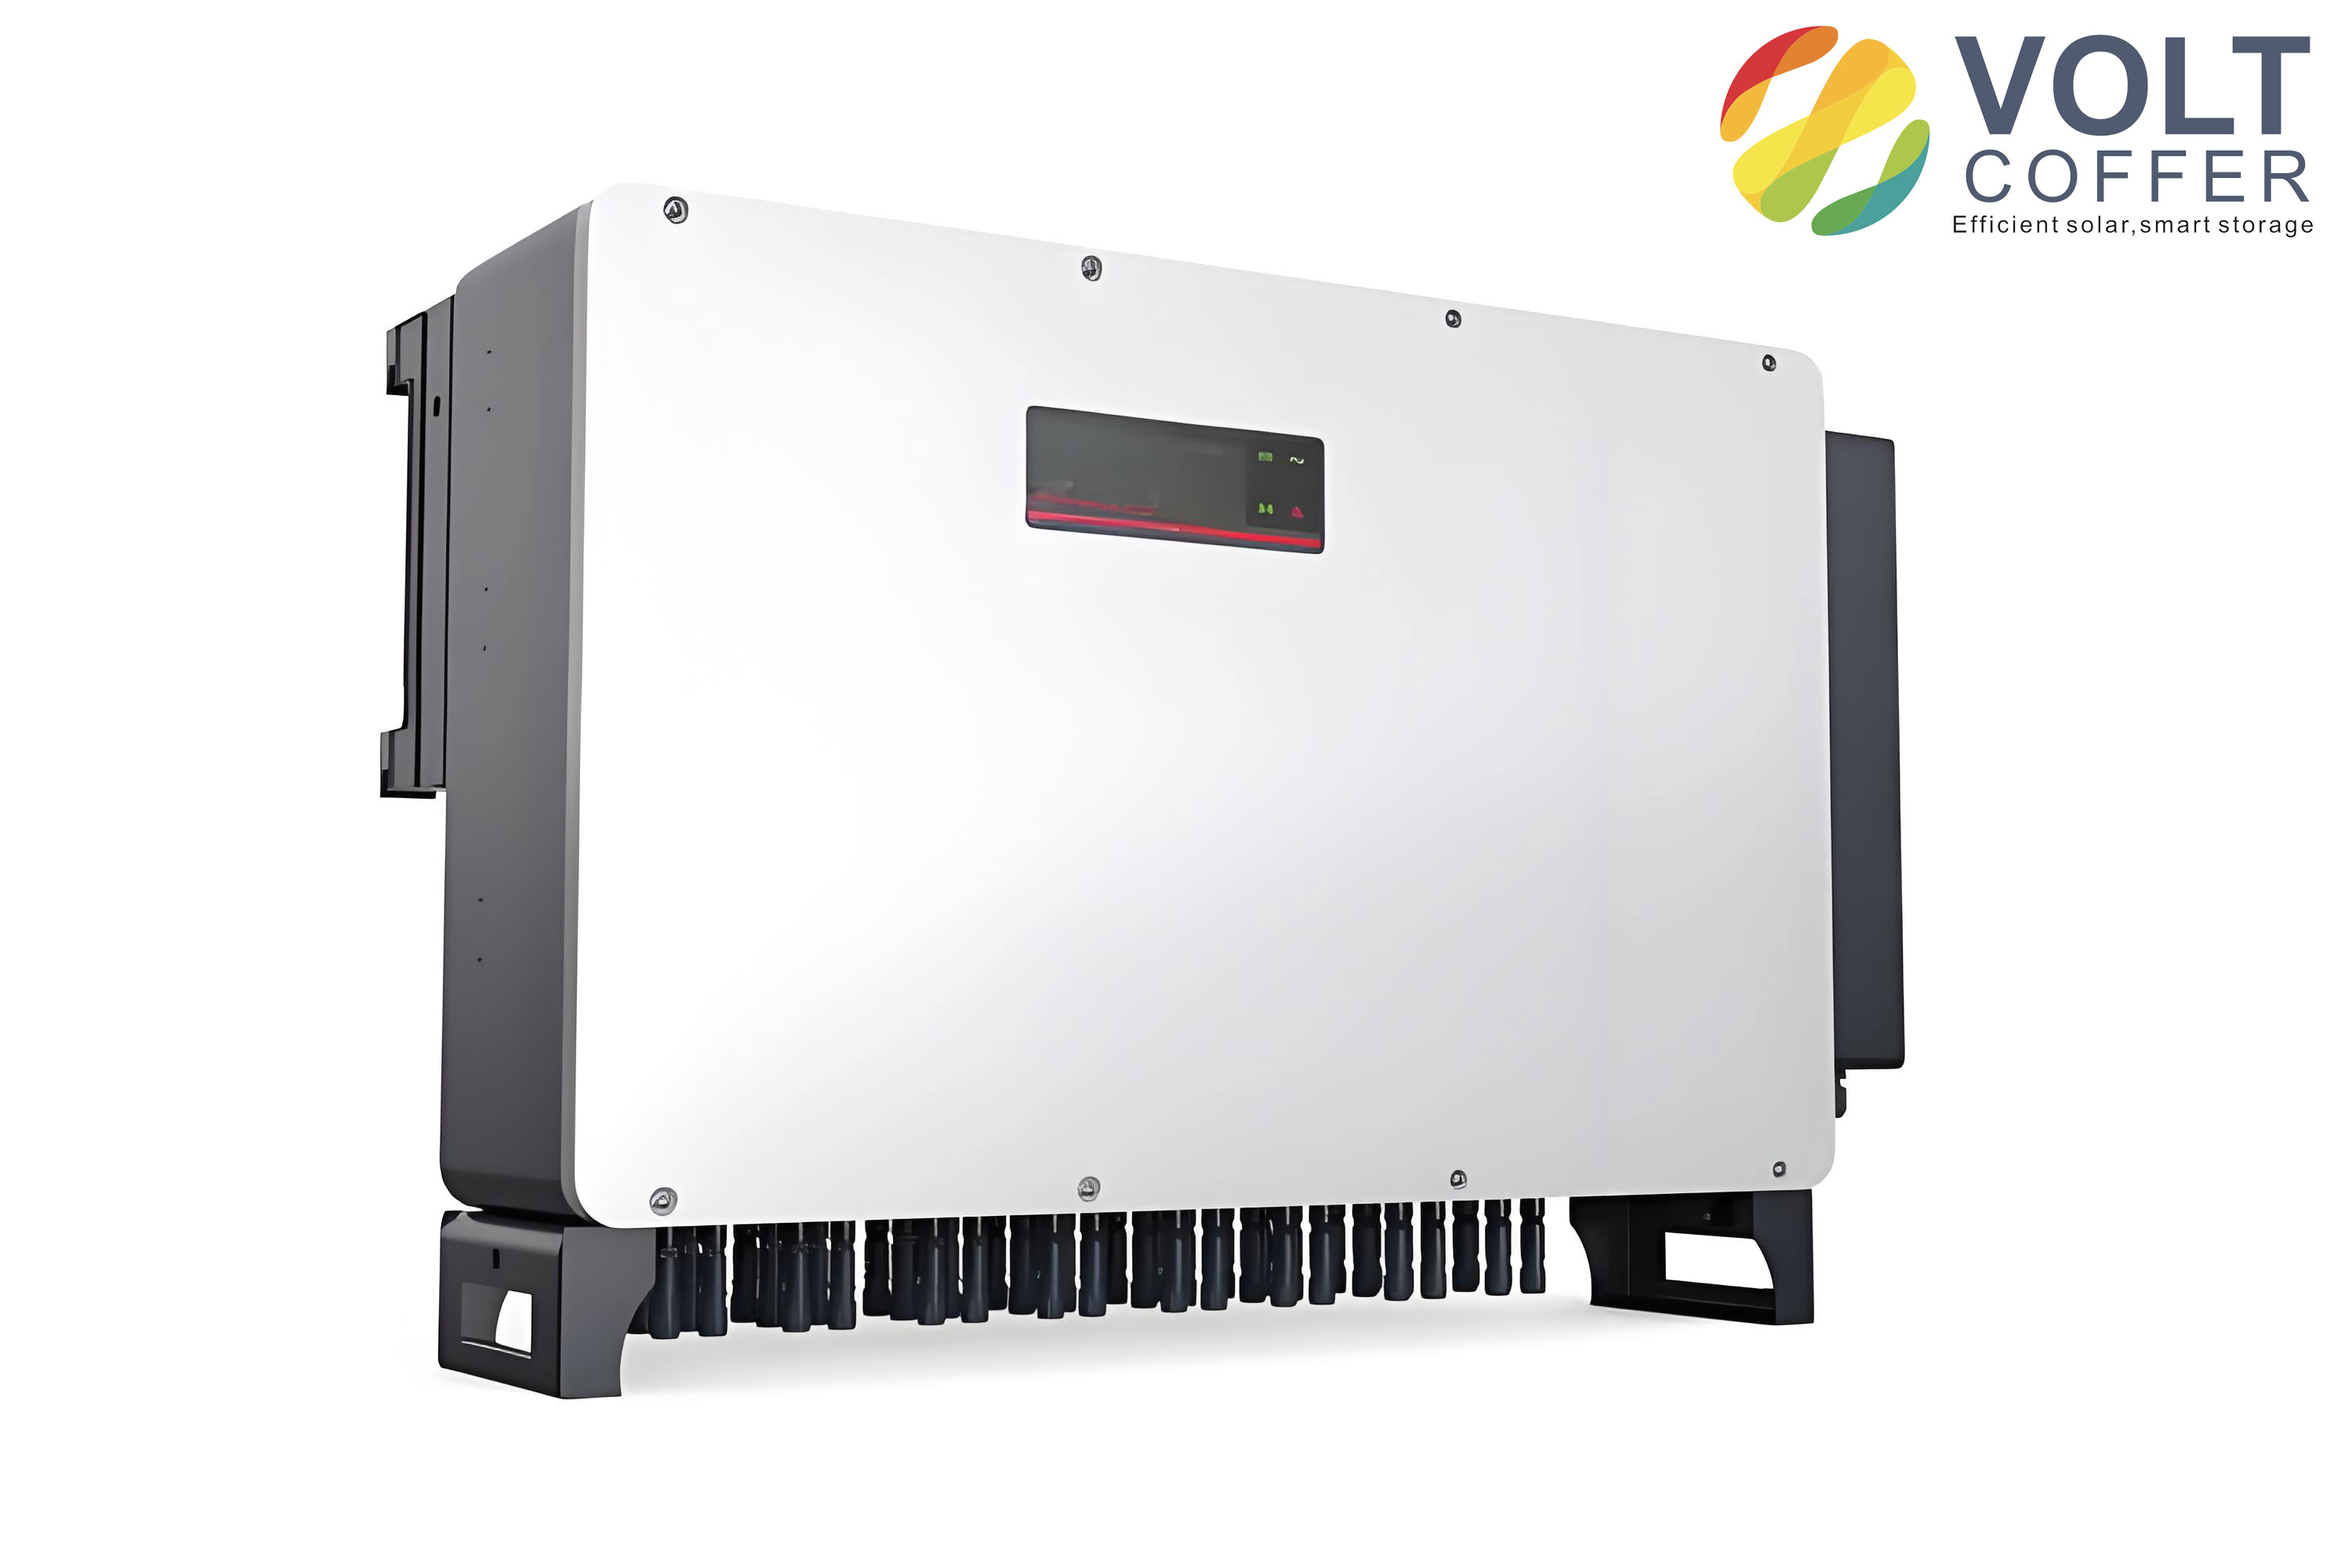
The experimental results confirm that the proposed fault signal combination – i.e., inverter output three‑phase currents, Concordia‑transformed currents, active power, and reactive power – together with the RF classifier, is highly effective for diagnosing IGBT double‑tube open‑circuit faults in the solar inverter. The method achieves an accuracy of 99.90% under varying irradiance conditions, and the computational overhead is acceptable for real‑time monitoring. The RF classifier’s inherent ability to reduce overfitting and handle high‑dimensional feature spaces makes it a robust choice for practical solar inverter fault diagnosis systems.
To further validate the approach, we compare the diagnostic performance under different signal combinations. For instance, using only the three‑phase currents reduces the accuracy to about 97% for the RF classifier, while adding Concordia currents and power signals improves the result. This indicates that the chosen feature set is well‑suited for the task. Additionally, we test the influence of the sampling window length. Extending the window to 0.2 s slightly improves accuracy (99.92%) but increases processing time by about 20%, so a 0.1 s window is a good trade‑off.
In conclusion, we have developed a machine‑learning‑based fault diagnosis method for the solar inverter that efficiently identifies IGBT double‑tube open‑circuit faults. The key contributions are: (1) a novel combination of fault features including Concordia currents and power signals; (2) comprehensive simulation of 24 fault scenarios under multiple irradiance levels; and (3) systematic comparison of four classifiers, with RF demonstrating superior performance. The proposed system can be integrated into monitoring platforms for grid‑connected photovoltaic systems, enabling early detection and localization of faults to prevent cascading failures and improve system reliability.
Future work could extend the method to diagnose other fault types (e.g., single‑tube faults, short‑circuit faults) and incorporate hardware‑in‑the‑loop validation. Additionally, deep learning techniques such as convolutional neural networks (CNNs) could be explored to automatically extract features from raw time‑series data, potentially further improving accuracy. Nonetheless, the RF‑based approach presented here already provides a satisfactory balance between accuracy and computational simplicity, making it suitable for real‑time applications in solar inverter condition monitoring.