
In the context of achieving carbon neutrality and peak carbon targets, the rapid integration of renewable energy sources into the power grid has imposed significant challenges on grid stability. Deep peak regulation of thermal power units has become a routine operational requirement. However, deep peak regulation not only introduces operational instability but also substantially increases the operating costs of thermal power units. The deployment of an energy storage system (ESS) in conjunction with thermal power units can enhance operational flexibility, enable peak shaving and valley filling, and ultimately reduce the levelized cost of energy (LCOE). Nevertheless, the high capital cost of ESS necessitates a thorough economic evaluation from the perspective of power generation enterprises operating in an electricity market environment.
This study focuses on a 600 MW thermal power unit participating in deep peak regulation. Through the establishment of a comprehensive economic benefit quantification model, we evaluate three types of energy storage systems: lithium iron phosphate (LiFePO₄) battery ESS, vanadium redox flow battery (VRFB) ESS, and compressed air energy storage (CAES) system. Our analysis incorporates all relevant costs and revenues over the full life cycle, including initial investment, operation and maintenance, charging costs, decommissioning, as well as revenues from electricity sales, peak regulation subsidies, and residual value. We examine the economic performance under various deep peak regulation load rates (30%, 35%, 40%, 45%, and 50%) and different configuration parameters.
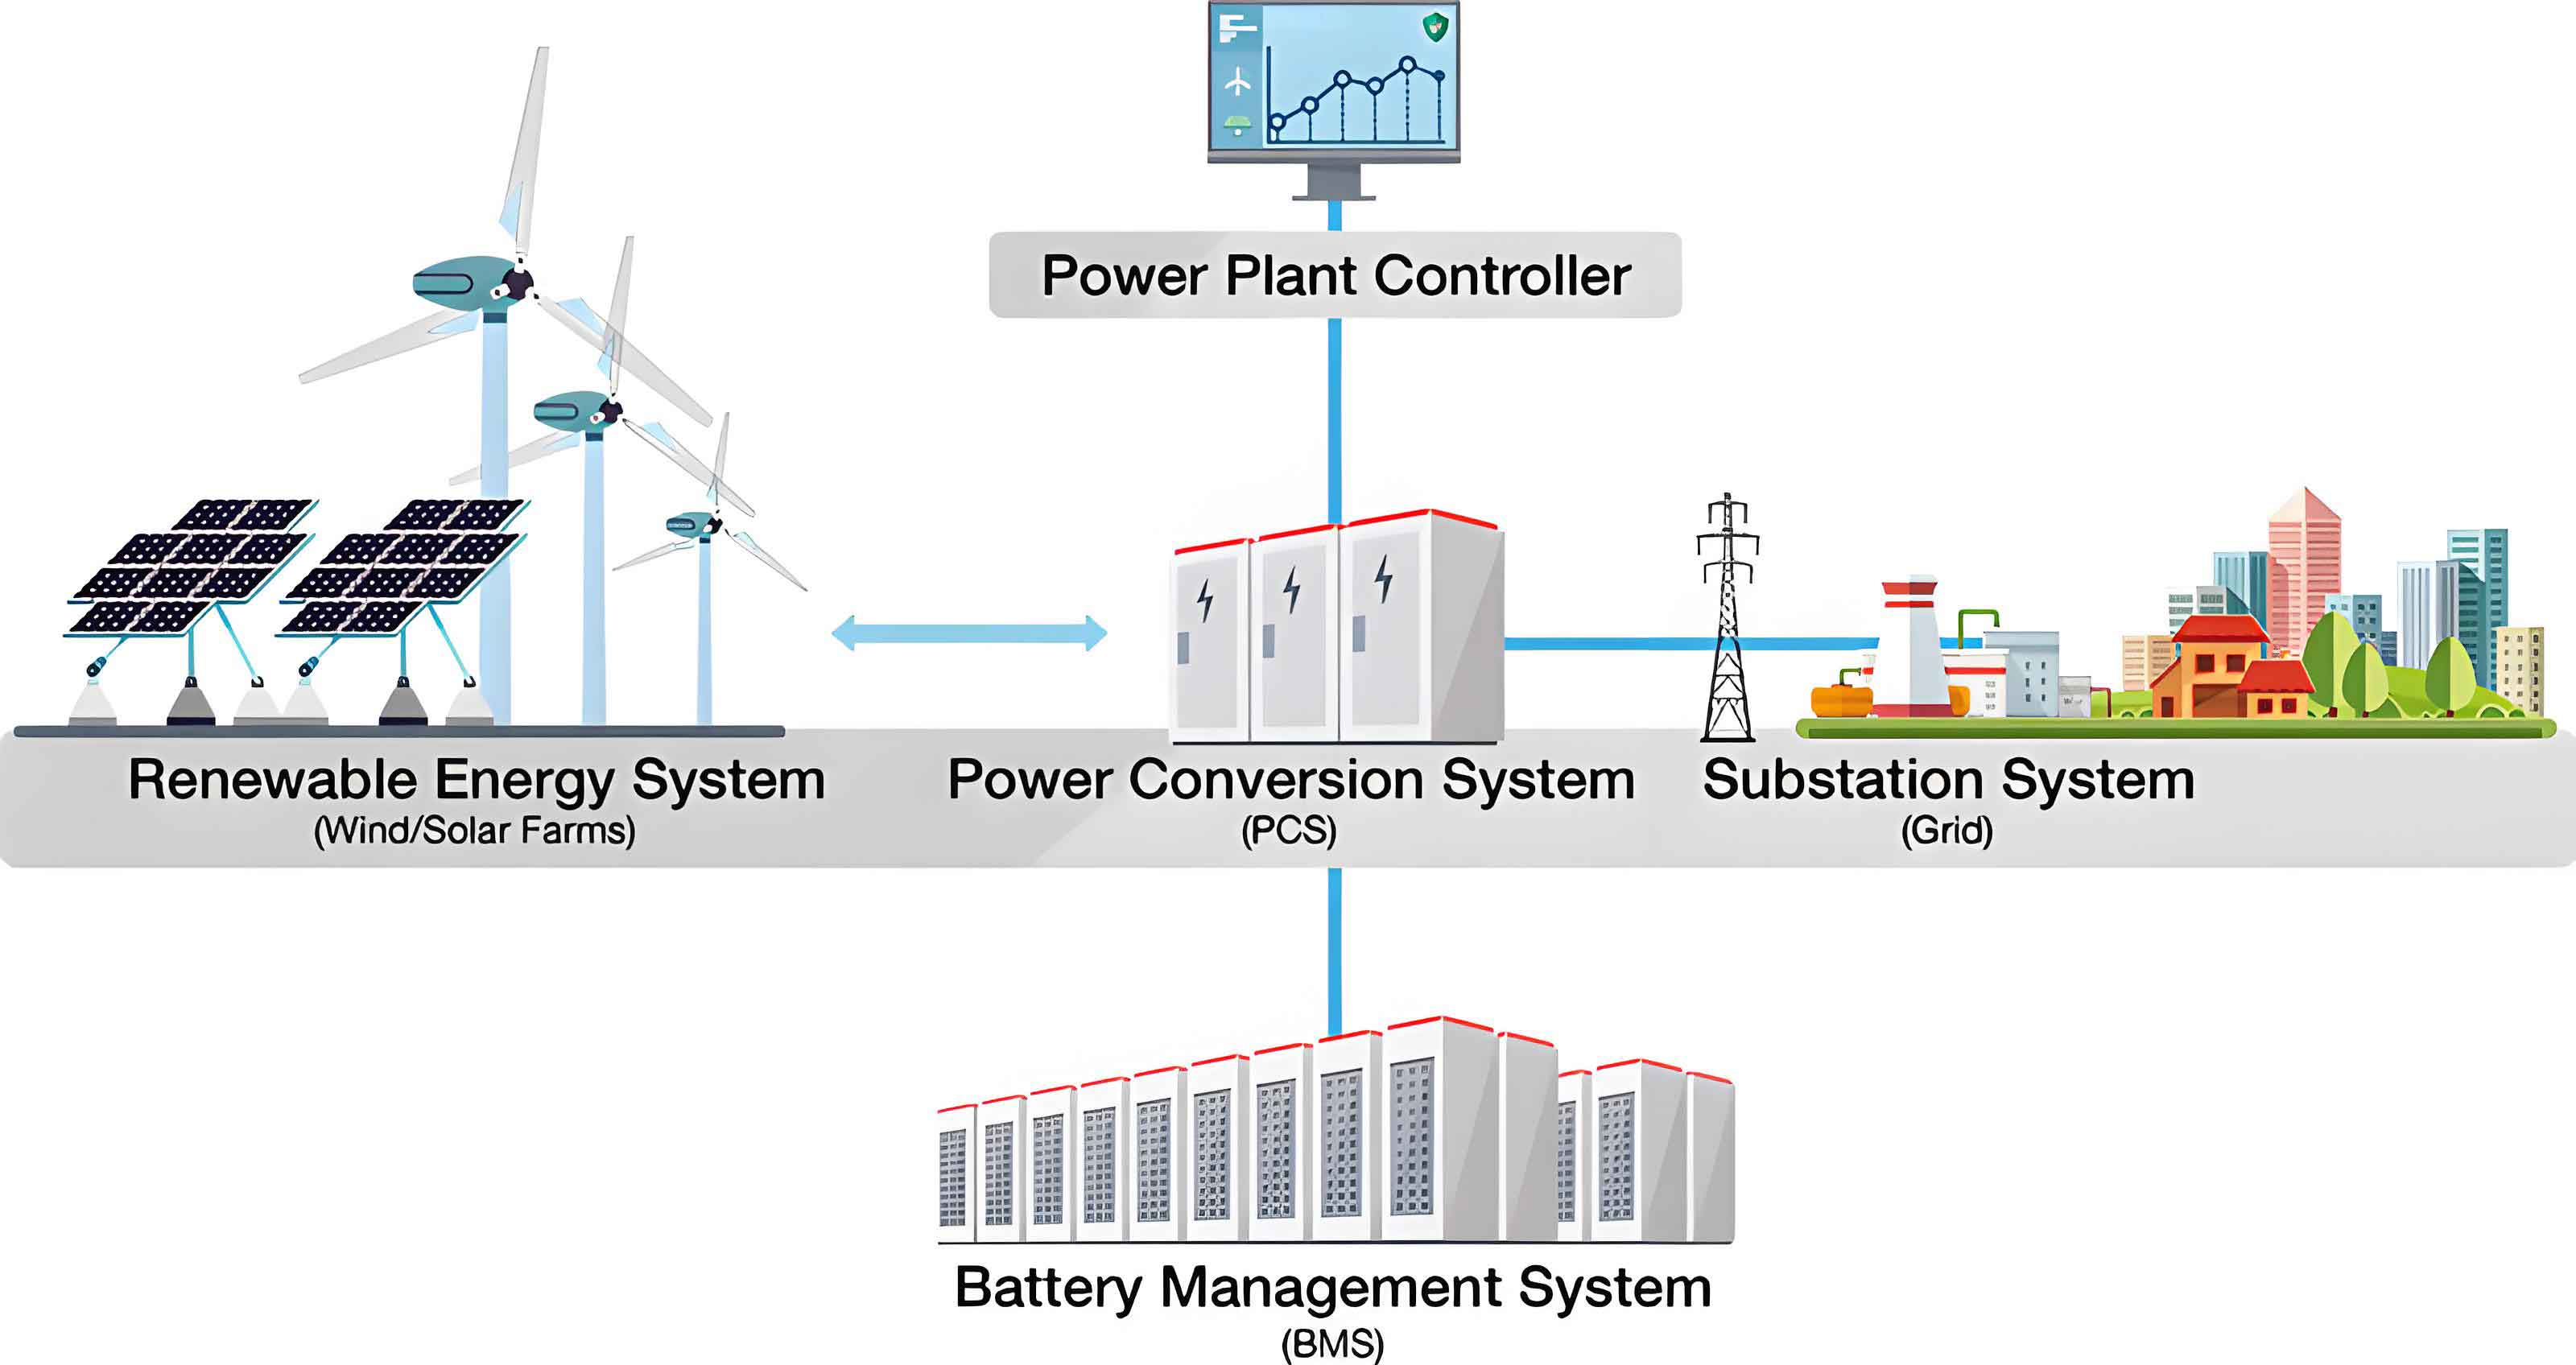
1. Economic Benefit Quantification Model
1.1 Cost Per Kilowatt-Hour for Thermal Power Unit Peak Regulation
When a thermal power unit operates under peak regulation, its cost per kilowatt-hour (LCOE) is defined as:
$$
C_{\text{Unit}} = \frac{F_{\text{Cost}} \times 10^4}{F_{\text{Grid}}}
$$
where \(C_{\text{Unit}}\) is the cost per kWh (yuan/kWh), \(F_{\text{Cost}}\) is the total generation cost during peak regulation (10⁴ yuan), and \(F_{\text{Grid}}\) is the on-grid electricity during the period (kWh).
Table 1 presents the operational parameters of the 600 MW thermal power unit under different load rates.
| Load rate (%) | Boiler thermal efficiency (%) | Turbine heat rate (kJ/kWh) | Coal consumption rate (g/kWh) | Auxiliary power rate (%) | Supply coal consumption rate (g/kWh) |
|---|---|---|---|---|---|
| 30 | 92.23 | 8098.24 | 302.62 | 8.34 | 330.26 |
| 35 | 92.84 | 8062.40 | 299.29 | 8.02 | 325.40 |
| 40 | 93.45 | 8024.60 | 296.00 | 7.70 | 320.72 |
| 45 | 94.05 | 7987.72 | 292.76 | 7.39 | 316.22 |
| 50 | 94.64 | 7950.88 | 289.55 | 7.07 | 311.58 |
Table 2 shows the resulting LCOE of the thermal power unit without an energy storage system.
| Load rate (%) | Total cost (10⁴ yuan/a) | On-grid electricity (10⁴ kWh/a) | LCOE (yuan/kWh) |
|---|---|---|---|
| 30 | 58394.6 | 244284.3 | 0.405 |
| 35 | 59848.9 | 248228.2 | 0.404 |
| 40 | 62505.0 | 252098.8 | 0.404 |
| 45 | 63222.4 | 256092.6 | 0.404 |
| 50 | 64506.2 | 260226.6 | 0.403 |
1.2 Full Life Cycle Cost Model for Energy Storage System
The full life cycle cost of an energy storage system consists of initial investment cost, operation and maintenance (O&M) cost, charging cost, decommissioning cost, and other costs.
Initial investment cost \(C_{\text{Inv}}\):
$$
C_{\text{Inv}} = C_E + C_P
$$
$$
C_E = U_E Q_E, \quad C_P = U_P W_P
$$
where \(U_E\) (yuan/kWh) is the unit capacity cost, \(Q_E\) (kWh) is the storage capacity, \(U_P\) (yuan/kW) is the unit power cost, and \(W_P\) (kW) is the installed power.
O&M cost: For LiFePO₄ battery ESS, the annual O&M cost is:
$$
C_{\text{OM}} = \sum_{n=1}^{N} \left[ C_{E,\text{OM}}(n) + C_{P,\text{OM}}(n) + C_{\text{Labor}}(n) \right]
$$
with \(C_{E,\text{OM}}(n) = U_{E,\text{OM}}(n) Q_E\), \(C_{P,\text{OM}}(n) = U_{P,\text{OM}}(n) W_P\), and \(C_{\text{Labor}}(n) = U_{L,\text{OM}}(n) Q_E\).
For VRFB and CAES systems, the annual O&M cost is a fixed proportion of the initial investment:
$$
C’_{\text{OM}} = k_{\text{OM}} C_{\text{Inv}}
$$
Charging cost \(C_C\):
$$
C_C = \sum_{n=1}^{N} \left( U_C Q_C(n) N_Y(n) \right)
$$
where \(U_C\) is the charging price (yuan/kWh), \(Q_C\) is the charging quantity per cycle (kWh), and \(N_Y(n)\) is the number of charging cycles in year \(n\). The single-cycle charging quantity is:
$$
Q_C = \frac{Q_E \theta_{\text{DOD}}}{\eta}
$$
where \(\theta_{\text{DOD}}\) is the depth of discharge, and \(\eta\) is the charging efficiency.
Decommissioning cost \(C_{\text{Rec}}\):
$$
C_{\text{Rec}} = \varepsilon C_{\text{Inv}}
$$
where \(\varepsilon\) is the scrap cost rate (%).
Other costs \(C_{\text{Oth}}\):
$$
C_{\text{Oth}} = \lambda_{\text{Oth}} \left( Q_E C_{\text{Sys},E} + W_P C_{\text{Sys},P} \right)
$$
where \(\lambda_{\text{Oth}}\) is taken as 8%.
1.3 Revenue Model for Energy Storage System
Electricity sales revenue \(E_I\):
$$
E_I = (P_S – U_C) Q_O, \quad Q_O = \theta_{\text{DOD}} Q_E
$$
where \(P_S\) is the peak selling price (yuan/kWh).
Peak regulation subsidy \(E_{S,\text{tot}}\): Includes capacity revenue, policy subsidy, and one-time subsidy:
$$
E_{S,\text{tot}} = E_{S,\text{cap}} + E_{S,\text{pro}} + E_{S,\text{dis}}
$$
$$
E_{S,\text{cap}} = K Q_t P_{S,\text{cap}}, \quad E_{S,\text{pro}} = Q_O P_{S,\text{pro}}, \quad E_{S,\text{dis}} = W_P P_{S,\text{dis}}
$$
with \(K = 0.8\) (auxiliary service market coefficient).
Residual value \(E_{\text{Res}}\):
$$
E_{\text{Res}} = \zeta C_{\text{Inv}}
$$
where \(\zeta\) is the residual value coefficient.
1.4 Economic Evaluation Indicators
Levelized Cost of Energy (LCOE):
$$
\text{LCOE} = \frac{C_{\text{Sum}}}{E_{\text{Sum}}} = \frac{C_{\text{Inv}} + C_{\text{OM}} + C_C + C_{\text{Rec}} + C_{\text{Oth}} – E_{\text{Res}}}{\sum_{n=1}^N Q_O(n)}
$$
Payback period \(P_t\): The time when cumulative net cash flow equals zero:
$$
\sum_{n=1}^{P_t} \left( C_{\text{In}}(n) – C_{\text{Out}}(n) \right) = 0
$$
Internal Rate of Return (IRR): The discount rate \(D_r\) that makes net present value zero:
$$
V_{\text{NP}} = \sum_{n=1}^{N} \frac{C_{\text{In}}(n) – C_{\text{Out}}(n)}{(1 + D_r)^n} = 0
$$
2. Case Study: Economic Analysis of Three Energy Storage Systems
We consider a 600 MW thermal power unit. Three ESS technologies are evaluated: LiFePO₄ battery (System A), vanadium redox flow battery (System B), and compressed air energy storage (System C). Table 3 summarizes their key technical and cost parameters.
| Parameter | System A (LiFePO₄) | System B (VRFB) | System C (CAES) |
|---|---|---|---|
| Unit power cost (yuan/kW) | 240 | 3980 | 5000 |
| Unit capacity cost (yuan/kWh) | 2020 | 2380 | 2000 |
| Unit power O&M cost (yuan/kW) | 20 | — | — |
| Unit capacity O&M cost (yuan/kWh) | 20 | — | — |
| Unit labor cost (yuan/kWh) | 25 | — | — |
| O&M cost proportion (%) | — | 0.5 | 2.0 |
| Charging efficiency (%) | 85–95 | 70–75 | 65–75 |
| Discharging efficiency (%) | 85–95 | 70–75 | 65–75 |
| Depth of discharge (%) | 90 | 200 | 200 |
| Cycle degradation rate (%/cycle) | 0.004 | 0.002 | 0.002 |
| Design lifetime (years) | 20 | 30 | 30 |
| Residual value coefficient (%) | 5 | 40 | 5 |
| Peak selling price (yuan/kWh) | 2.300 | 2.300 | 2.300 |
| Low-price charging price (yuan/kWh) | 0.288 | 0.288 | 0.288 |
2.1 Impact of Installed Power and Load Rate
We first set the number of peak regulation cycles to 330 per year and the charging price to 0.288 yuan/kWh. We vary the installed power of the ESS from 300 MW to 420 MW, and the deep peak regulation load rate from 30% to 50%.
2.1.1 LiFePO₄ Battery ESS (System A)
Table 4 shows the LCOE and net present value (NPV) for System A under different configurations.
| Installed power (MW) | Load rate (%) | LCOE (yuan/kWh) | NPV (10⁴ yuan) | Payback period (years) |
|---|---|---|---|---|
| 300 | 30 | 2.280 | 7850 | 7.50 |
| 300 | 50 | 2.245 | 9234.3 | 7.42 |
| 360 | 50 | 2.218 | 15260 | 7.47 |
| 420 | 50 | 2.203 | 22280.7 | 7.52 |
| 420 | 30 | 2.240 | 19500 | 7.60 |
From Table 4, the LCOE decreases with increasing installed power and load rate. At 420 MW and 50% load rate, the LCOE reaches its lowest value of 2.203 yuan/kWh, while the NPV is highest at 22280.7×10⁴ yuan. The payback period slightly increases from 7.42 to 7.52 years as power increases. Thus, 420 MW provides the best comprehensive economic performance for System A.
2.1.2 Vanadium Redox Flow Battery ESS (System B) and Compressed Air ESS (System C)
Tables 5 and 6 present the economic results for Systems B and C, respectively.
| Installed power (MW) | Load rate (%) | LCOE (yuan/kWh) | NPV (10⁴ yuan) |
|---|---|---|---|
| 300 | 50 | 2.280 | -1520 |
| 420 | 50 | 2.224 | -980 |
| 420 | 30 | 2.260 | -1850 |
| Installed power (MW) | Load rate (%) | LCOE (yuan/kWh) | NPV (10⁴ yuan) |
|---|---|---|---|
| 300 | 50 | 2.850 | -12500 |
| 420 | 50 | 2.785 | -10500 |
| 420 | 30 | 2.820 | -13000 |
Both System B and System C exhibit negative NPVs across all considered scenarios, indicating poor economic viability under the given conditions. The LCOE for System B at 420 MW and 50% load rate is 2.224 yuan/kWh, while that for System C is 2.785 yuan/kWh. The higher residual value coefficient (40%) of System B compared to System C (5%) partly explains its better, yet still negative, NPV.
2.2 Impact of Peak Regulation Frequency and Low-Price Charging Frequency
We fix the installed power at 420 MW and the load rate at 50%, with low-price charging price of 0.288 yuan/kWh. The total number of cycles (peak regulation + low-price charging) is set to 500 per year for System A and 660 per year for Systems B and C, based on their maximum design cycle life.
2.2.1 LiFePO₄ Battery ESS (System A)
Table 7 shows the economic indicators as the peak regulation frequency decreases from 360 to 280 cycles/year and low-price charging frequency increases from 240 to 220 cycles/year (note that the sum remains 500).
| Peak regulation freq. (a⁻¹) | Low-price charging freq. (a⁻¹) | LCOE (yuan/kWh) | NPV (10⁴ yuan) | Payback period (years) | IRR (%) |
|---|---|---|---|---|---|
| 360 | 240 | 0.880 | 54692.0 | 3.75 | 26.94 |
| 320 | 180 | 0.872 | 54750.0 | 3.75 | 27.00 |
| 280 | 220 | 0.860 | 54897.0 | 3.74 | 27.02 |
The minimum LCOE (0.860 yuan/kWh) and maximum IRR (27.02%) are achieved when the ratio of peak regulation frequency to low-price charging frequency is minimized (280/220). More low-price charging reduces the effective charging cost, thereby improving economic benefits.
2.2.2 Vanadium Redox Flow Battery ESS (System B)
Table 8 presents the results for System B, with a total of 660 cycles per year.
| Peak regulation freq. (a⁻¹) | Low-price charging freq. (a⁻¹) | LCOE (yuan/kWh) | NPV (10⁴ yuan) | Payback period (years) | IRR (%) |
|---|---|---|---|---|---|
| 360 | 300 | 0.935 | 3843.0 | 29.77 | 6.19 |
| 320 | 340 | 0.928 | 4260.0 | 29.74 | 6.22 |
| 280 | 380 | 0.922 | 4679.0 | 29.72 | 6.24 |
System B also benefits from a lower peak regulation to low-price charging ratio, achieving its best LCOE (0.922 yuan/kWh) and IRR (6.24%) at 280/380. Although NPV is positive (4679×10⁴ yuan), the payback period is nearly 30 years, close to its design lifetime, indicating marginal investment viability.
2.2.3 Compressed Air ESS (System C)
Table 9 gives the economic indicators for System C.
| Peak regulation freq. (a⁻¹) | Low-price charging freq. (a⁻¹) | LCOE (yuan/kWh) | NPV (10⁴ yuan) | IRR (%) |
|---|---|---|---|---|
| 360 | 300 | 0.978 | -23972.0 | 5.36 |
| 320 | 340 | 0.969 | -23615.0 | 5.38 |
| 280 | 380 | 0.960 | -23278.0 | 5.40 |
Despite achieving the lowest LCOE among its own configurations (0.960 yuan/kWh) at 280/380, the NPV remains negative across all scenarios. The IRR is only about 5.4%, well below typical commercial thresholds. The payback period exceeds the system’s 30-year lifetime, making CAES economically unattractive under the current market conditions.
3. Comparison of Optimal Economic Performance
Table 10 summarizes the best achievable LCOE and IRR for each energy storage system under the optimal frequency combination.
| Energy Storage System | Optimal frequency ratio (peak/low-price) | Optimal LCOE (yuan/kWh) | Optimal IRR (%) |
|---|---|---|---|
| LiFePO₄ battery (System A) | 280/220 | 0.860 | 27.02 |
| VRFB (System B) | 280/380 | 0.922 | 6.24 |
| CAES (System C) | 280/380 | 0.960 | 5.40 |
4. Conclusion
In this study, we developed a comprehensive economic benefit quantification model for energy storage systems participating in deep peak regulation of thermal power units in an electricity market environment. The following key conclusions are drawn:
- Among the three energy storage systems evaluated—LiFePO₄ battery, vanadium redox flow battery, and compressed air energy storage—the LiFePO₄ battery energy storage system demonstrates the best economic performance, achieving the lowest LCOE of 0.860 yuan/kWh and the highest IRR of 27.02%.
- The economic benefits of all energy storage systems are significantly influenced by the installed power, deep peak regulation load rate, and the ratio of peak regulation frequency to low-price charging frequency. A lower ratio (i.e., more charging at low electricity prices) consistently improves LCOE and IRR.
- Under the same peak regulation frequency (330 cycles/year) and charging price (0.288 yuan/kWh), increasing the installed power from 300 MW to 420 MW reduces the LCOE of the LiFePO₄ battery ESS by about 3.7% and increases its NPV by about 33.4%.
- Vanadium redox flow battery and compressed air energy storage systems are not economically viable under current cost and revenue assumptions, as indicated by long payback periods and, in the case of CAES, negative net present value. However, the VRFB system offers a positive NPV at optimal operation, albeit with a payback period close to its design life.
- Our findings underscore the importance of optimizing both the configuration and the operational strategy of energy storage systems to maximize economic returns in the context of deep peak regulation. Policy support that enhances peak regulation subsidies or reduces charging costs could further improve the viability of alternative storage technologies.