
In the context of global efforts toward carbon neutrality, energy storage systems based on lithium-ion batteries have become indispensable for stabilizing renewable power grids. Among various chemistries, lithium iron phosphate (LFP) batteries dominate the stationary storage market due to their safety, long cycle life, and low cost. However, the mechanical behavior of these cells under constrained conditions, particularly the swelling force generated during charge and discharge, remains a critical factor affecting both electrical performance and structural integrity. In this work, we systematically investigate the swelling force characteristics of large‑format prismatic LFP energy storage cells (280 Ah) assembled into modules with different series configurations. By combining long‑term cycling tests with finite element simulation, we reveal the evolution of swelling force over the full state of charge (SOC) and state of health (SOH) ranges, and provide design guidelines for energy storage cell modules.
1. Experimental Methodology
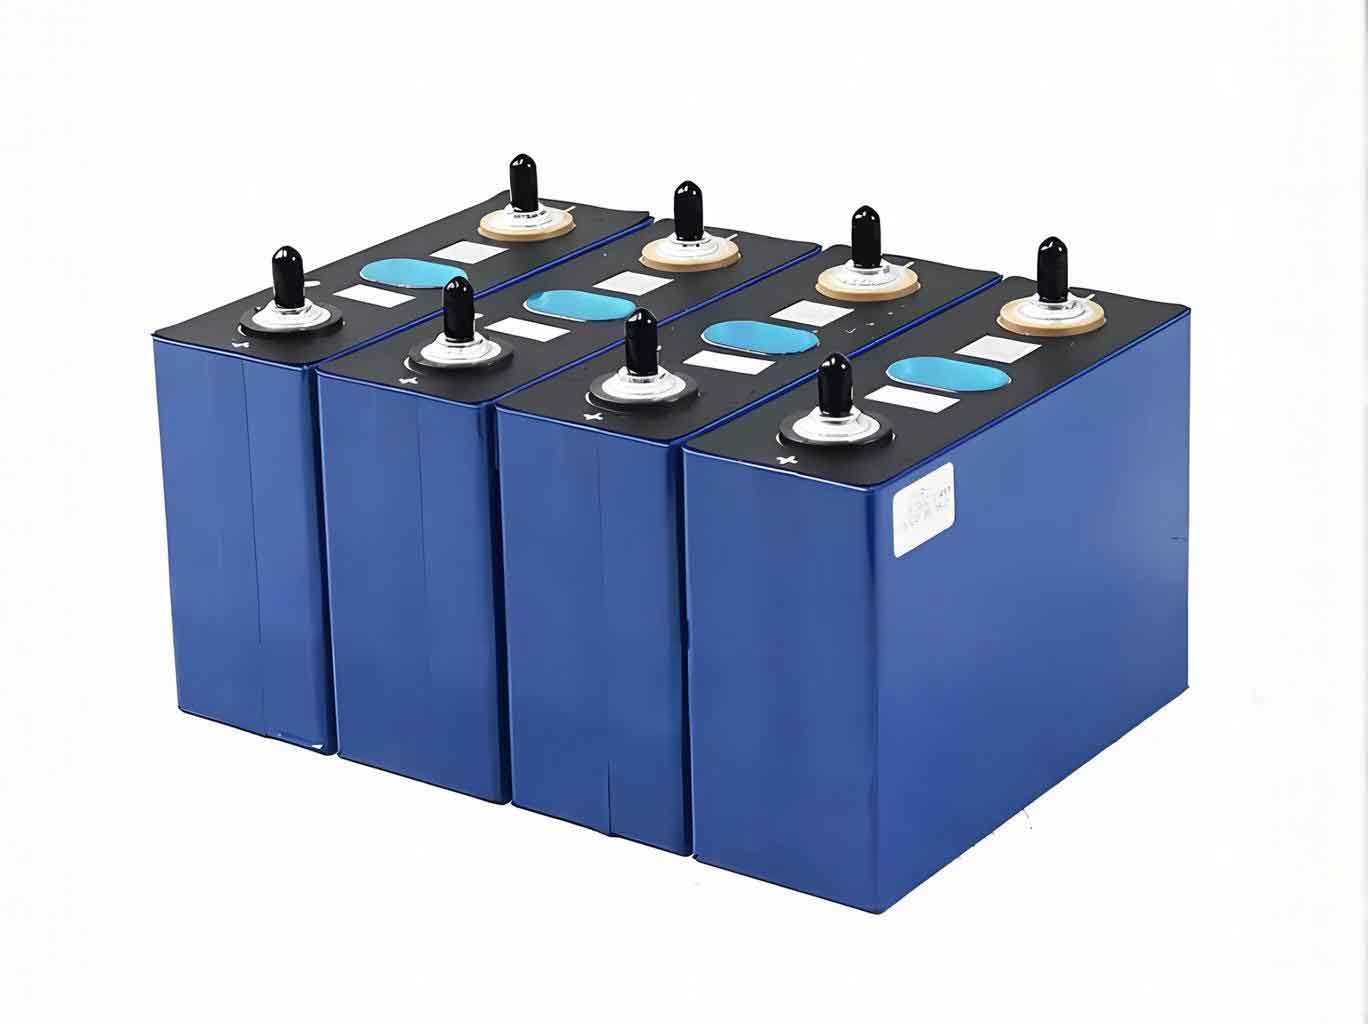
We selected a commercial prismatic LFP energy storage cell with a nominal capacity of 280 Ah. The key parameters are summarized in Table 1. The cells were assembled into two module types: a 1P12S module (12 cells in series, designated Module A) and a 1P8S module (8 cells in series, designated Module B). Each module was placed in a rigid steel fixture with an initial preload force of 300 kgf, and a pressure sensor (XJC‑S08‑2T) was mounted at the center of the fixture to record the real‑time swelling force. The test environment was maintained at (25 ± 2) °C. The modules were cycled at 0.5 P constant power (0.5 C rate equivalent) with a 30 min rest between charge and discharge steps. The detailed cycle conditions are given in Table 2.
| Parameter | Value |
|---|---|
| Cell type | Prismatic aluminum‑case LFP |
| Cell dimensions (mm) | 72.0 × 207.2 × 173.7 |
| Internal resistance | ≤ 0.25 mΩ |
| Nominal capacity | 280 Ah |
| Nominal energy | 896 Wh |
| Nominal voltage | 3.2 V |
| Standard charge/discharge power | 448 W |
| Cell weight | 5.42 kg |
| Module A (1P12S) configuration | 12S, voltage range 30 – 38.4 V, nominal 36 V, nominal energy 10.752 kWh |
| Module B (1P8S) configuration | 8S, voltage range 20 – 29.2 V, nominal 25.6 V, nominal energy 7.168 kWh |
| Step | Module A (1P12S) | Module B (1P8S) |
|---|---|---|
| Charge power | 5376 W | 3584 W |
| Charge cutoff | Any cell voltage reaches 3.65 V | Any cell voltage reaches 3.65 V |
| Rest after charge | 30 min | 30 min |
| Discharge power | 5376 W | 3584 W |
| Discharge cutoff | Any cell voltage reaches 2.5 V | Any cell voltage reaches 2.5 V |
| Rest after discharge | 30 min | 30 min |
2. Swelling Force during a Single Cycle
In the initial cycle, the swelling force of the energy storage cell module exhibited a non‑linear dependence on SOC (Figure 2 of the original work, not re‑presented here). During charging, the force increased almost linearly from the preload of 300 kgf until it reached a first peak of 357 kgf at approximately 30 % SOC. Subsequently, the force decreased to about 330 kgf near 60 % SOC, then rose again to a maximum of 485 kgf at 100 % SOC. During the 30‑min rest at full charge, the force relaxed to 458 kgf. Upon discharging, the force decreased from 458 kgf to 304 kgf at 60 % SOC, then increased again to a second peak of 372 kgf at about 30 % SOC. Finally, the force dropped to a minimum of 156 kgf at 0 % SOC, which was 6 kgf higher than the initial value before cycling.
This behavior is directly linked to the phase transitions in the graphite anode and the LFP cathode. The graphite anode undergoes several staging stages during lithium intercalation:
$$ \text{Stage IV} \rightarrow \text{Stage III} \rightarrow \text{Stage II} \rightarrow \text{Stage I} $$
Table 3 lists the lattice spacing changes for graphite and LFP materials. The volume expansion of graphite from C₆ to LiC₆ is about 12.4 %, while LFP shrinks by about 6.53 % from LiFePO₄ to FePO₄. The combination of these opposing volume changes results in the first peak near 30 % SOC (attributed to the transition from Stage IV to Stage II) and a valley near 60 % SOC where the cathode shrinkage compensates the anode expansion. The second peak at 100 % SOC corresponds to the Stage II → Stage I transition in graphite, giving the maximum overall expansion.
| Phase | Lattice spacing (Å) | Volume change (%) |
|---|---|---|
| Graphite C₆ | 3.355 | 0 |
| Stage IV/III | 3.511 | +5.33 |
| Stage IIL | 3.519 | +5.53 |
| Stage II | 3.509 | +5.57 |
| Stage I (LiC₆) | 3.706 | +12.4 |
| LiFePO₄ | a=6.01 Å, b=10.33 Å, c=4.69 Å | 0 (reference) |
| FePO₄ | a=5.79 Å, b=9.82 Å, c=4.79 Å | –6.53 |
3. Evolution of Swelling Force with Cycling
We monitored the three characteristic peaks for both modules over 1800 cycles. The peaks are denoted: C1 (charge at ~30 % SOC), C2 (charge at 100 % SOC), and D1 (discharge at ~30 % SOC). Initially, C2 was the largest, but as cycling progressed the ranking changed. For Module A, after about 500 cycles (SOH ≈ 94 %), C1 overtook C2 as the maximum peak. After about 800 cycles (SOH ≈ 92 %), the order became C1 > D1 > C2. The same trend was observed for Module B, as quantified by the ratio C1/C2.
The maximum swelling force per cycle increased monotonically with degradation. Figure 5 of the original work (not reproduced here) shows the relationship. We fitted the data after SOH fell below ~90 % using linear least‑squares regression:
$$ \text{Module A: } F_A = -7429 \cdot \text{SOH} + 7532.9 \quad (R^2 = 0.997) $$
$$ \text{Module B: } F_B = -7402 \cdot \text{SOH} + 7305.8 \quad (R^2 = 0.996) $$
The slopes are nearly identical (−7429 vs -7402), indicating that the series‑string number does not affect the growth rate of the maximum swelling force. The intercept difference (227 kgf) reflects the additional force contributed by the four extra cells in Module A. At 70 % SOH, the maximum swelling force of Module A reached 2365 kgf.
The linear regime begins when C1 becomes the dominant peak. This suggests that the irreversible volume increase associated with SEI growth and lithium inventory loss primarily affects the 30 % SOC region, while the 100 % SOC peak saturates as the actual lithium content at full charge decreases with SOH.
4. Mechanism of Swelling Force Evolution
The change in peak ranking can be explained by the coupled structural deformation of the electrodes. The average crystal‑structure deformation as a function of SOC is shown in Figure 3(d) of the original work. At beginning‑of‑life (BOL), the maximum average deformation occurs at 100 % SOC. However, as SOH decays, the amount of cyclable lithium decreases. For example, at 90 % SOH, the fully charged state corresponds to only about 90 % of the original lithium content. Referring to the deformation curve, the deformation at ~90 % SOC is comparable to that at ~30 % SOC. Therefore, the force at 100 % SOC gradually becomes smaller than that at 30 % SOC as the battery ages. The D1 peak (discharge at 30 % SOC) remains slightly lower than C1 because the previous history (discharge from full) leads to a different lithiation path.
5. Simulation of Module Structural Integrity
We built finite‑element models (using Abaqus) of the actual steel‑band modules (designated A′ for 1P12S and B′ for 1P8S) to evaluate whether the structural components can withstand the swelling forces throughout the entire lifecycle. The models included end plates, steel bands, aluminum busbars, cells, silicone pads, and base plates. Material properties are listed in Table 4.
| Component | Material | Density (t/mm³) | Elastic modulus (MPa) | Poisson ratio | Yield strength (MPa) | Tensile strength (MPa) |
|---|---|---|---|---|---|---|
| End plate | A380 | 2.76 × 10⁻⁹ | 7.2 × 10⁴ | 0.33 | 159.0 | 324.0 |
| Aluminum busbar | AL_1060_O | 2.71 × 10⁻⁹ | 6.9 × 10⁴ | 0.33 | 27.6 | 68.9 |
| Bolt | 40Cr | 7.80 × 10⁻⁹ | 2.1 × 10⁵ | 0.29 | 525.0 | 827.0 |
| Steel band | SUS201 | 7.93 × 10⁻⁹ | 2.2 × 10⁵ | 0.25 | 1168.0 | 1353.0 |
The load input was derived from the linear extrapolation of the measured swelling force to 60 % SOH. At 60 % SOH, the predicted maximum swelling forces (including the initial 300 kgf preload) were 3075.5 kgf for Module A and 2864.4 kgf for Module B. Subtracting the preload gives net expansion forces of 2775.5 kgf and 2564.4 kgf, respectively. These forces were applied uniformly to the end plates in the simulation.
The simulation results showed that the maximum displacement occurred at the center of the end plate: 1.42 mm for Module A′ and 1.57 mm for Module B′. The maximum von Mises stress in the end plate was 116.6 MPa (Module A′) and 131.7 MPa (Module B′), both well below the yield strength (159 MPa). The aluminum busbars experienced a maximum stress of 27.9 MPa (Module A′) and 28.0 MPa (Module B′), which slightly exceeds the yield strength of 27.6 MPa. However, the resulting maximum displacement of the busbars was only 0.3 mm and 0.5 mm, respectively, and the arch‑shaped design of the busbars provides an elastic deformation capacity of more than 3 mm, ensuring electrical connectivity throughout the module lifetime. The bolts and steel bands remained within their elastic limits, with maximum stresses far below their yield strengths.
6. Implications for Energy Storage Cell Module Design
Our study demonstrates that the swelling force of LFP energy storage cell modules is strongly dependent on both SOC and SOH. The peak force shifts from the fully charged state to the 30 % SOC region after approximately 500 cycles (93–94 % SOH). This transition must be accounted for when designing the clamping force and structural margins. The linear relationship between maximum swelling force and SOH below 90 % provides a simple predictive tool: the slope is essentially independent of the module series count, while the intercept scales linearly with the number of cells. This allows designers to extrapolate the swelling force of larger battery packs from module‑level tests.
The simulation verified that the current design of end plates, steel bands, and busbars can safely accommodate the swelling forces at 60 % SOH. However, extreme conditions (e.g., thermal runaway) were not considered here. The swelling force itself can serve as an early‑warning signal for internal anomalies, as suggested by previous work. By integrating a force sensor into the module or pack, real‑time monitoring of SOH and early detection of cell degradation becomes feasible.
7. Conclusion
We have systematically investigated the swelling force evolution in 280 Ah LFP energy storage cell modules. The main findings are:
- The swelling force during a single cycle exhibits three characteristic peaks: at ~30 % SOC (charge), 100 % SOC (charge), and ~30 % SOC (discharge). These peaks arise from the coupled volume changes of graphite staging transitions and LFP shrinkage/expansion.
- As the energy storage cell degrades, the peak at 30 % SOC (charge) becomes dominant after about 500 cycles (94 % SOH), while the peak at 100 % SOC diminishes due to reduced available lithium.
- Below 90 % SOH, the maximum swelling force per cycle is linearly correlated with SOH. The growth rate is independent of the number of cells in series, enabling simple extrapolation to larger configurations.
- Finite element simulation confirms that the existing mechanical design (end plates, steel bands, busbars) can withstand the forces at 60 % SOH with acceptable safety margins.
Our work provides a fundamental understanding and a practical framework for designing robust energy storage cell modules. Future studies should extend the investigation to pack‑level assemblies and incorporate thermal‑electrochemical‑mechanical coupling to further improve safety and longevity.