
In the pursuit of global carbon neutrality, the transition of electric power systems toward green and low-carbon energy sources is accelerating. Battery energy storage systems have emerged as a critical technology to support this transition by enabling the integration of renewable energy, grid stabilization, and peak shaving. However, the thermal management of energy storage cells remains a major bottleneck that limits the safety, performance, and lifespan of these systems. During operation, energy storage cells generate substantial heat, and if not effectively dissipated, the accumulated heat can lead to elevated temperatures, non-uniform temperature distribution, accelerated aging, and even thermal runaway. Among various cooling technologies, immersion liquid cooling has attracted significant attention due to its superior heat transfer capability, excellent temperature uniformity, and high reliability. In this work, we propose a novel immersion liquid-cooled energy storage cell module featuring internal baffles to address the common issues of poor temperature uniformity and uneven coolant flow observed in conventional immersion modules. We systematically compare the flow and heat transfer characteristics of the novel module with those of a traditional immersion module, investigate the effects of coolant velocity and initial temperature on the thermal performance of the module, and develop a Nusselt number correlation to predict the heat transfer process of the coolant flowing across the energy storage cells. The goal is to provide a theoretical foundation for the design and optimization of immersion liquid cooling systems for energy storage applications.
Physical Model and Numerical Methodology
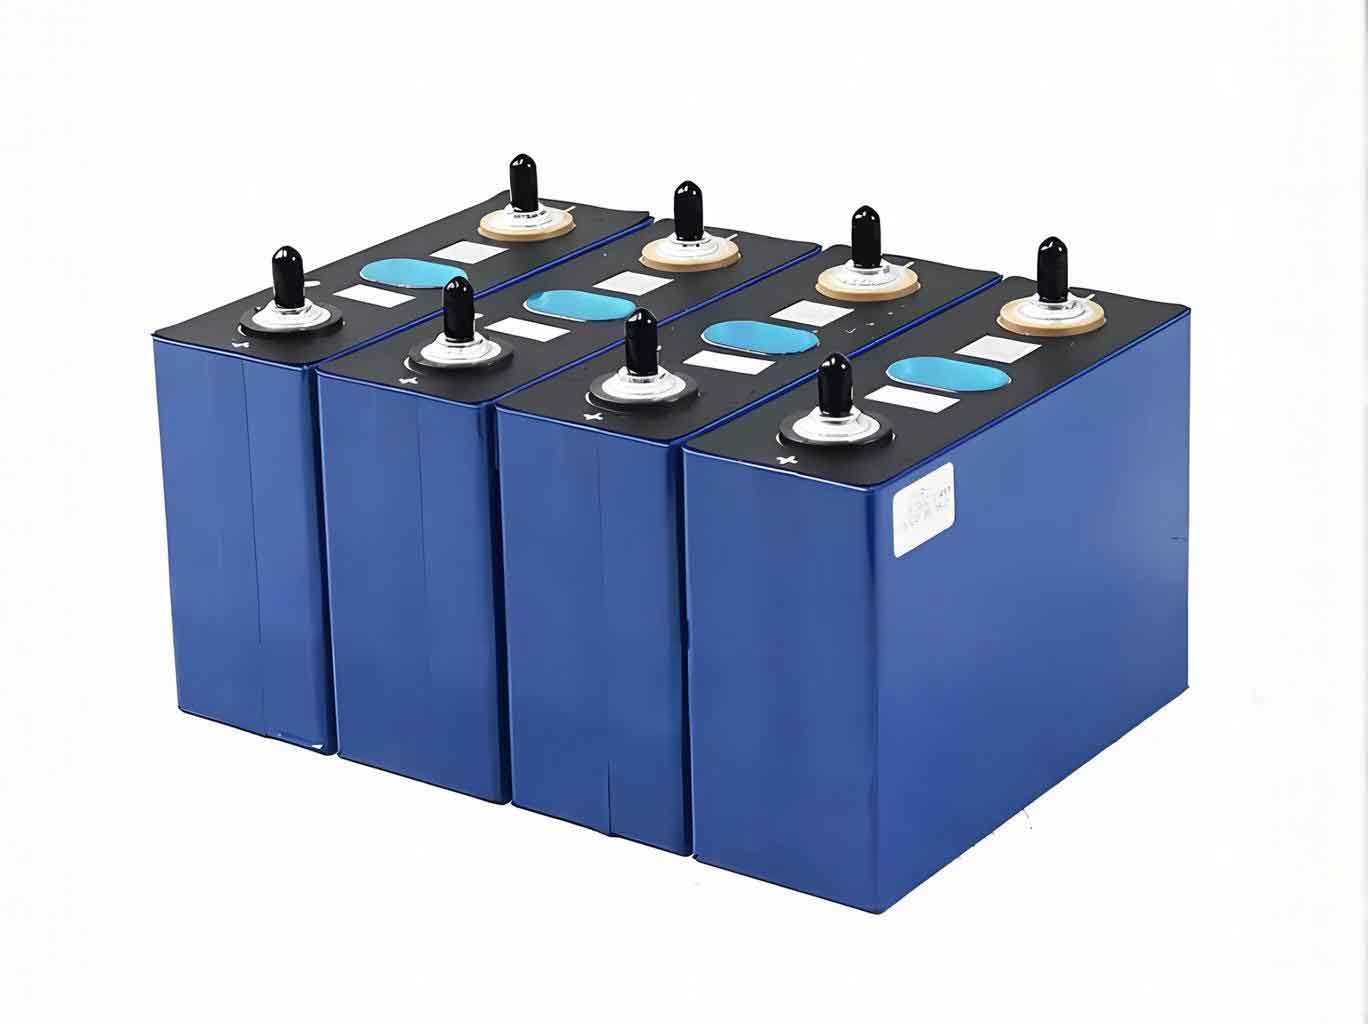
We consider a prismatic lithium iron phosphate energy storage cell with dimensions of 174 mm × 71 mm × 207 mm. The module comprises eight cells arranged in series, with a constant cell spacing of 35.5 mm (half the cell thickness). The coolant used is Novec 7000 fluorinated liquid, which has a low dielectric constant, excellent material compatibility, and outstanding heat transfer performance. The coolant enters the module from the bottom inlet on one side, flows around the cells, absorbs heat, and exits from the top outlet on the opposite side. In the conventional module, the coolant flows freely through the gaps between cells. In the proposed novel module, we strategically place baffles in the gaps between cells from cell 3 to cell 8. These baffles are designed to redirect the coolant flow, enhance mixing, and improve heat transfer in the downstream region where cells typically experience higher temperatures.
The governing equations for the fluid flow and heat transfer include the continuity equation, momentum equation, and energy equation. The shear-stress transport (SST) k-ω turbulence model is employed to capture the turbulent characteristics of the coolant flow. The energy storage cells are modeled using a multi-scale multi-domain (MSMD) three-dimensional electro-thermal coupled model, which accounts for the heat generation from ohmic losses, polarization, and electrochemical reactions. A second-order RC equivalent circuit model is used to describe the electrical behavior of the cells. The governing equations are as follows:
Continuity equation:
$$
\frac{\partial \rho_f}{\partial t} + \frac{\partial}{\partial x_i}(\rho_f u_i) = 0
$$
Momentum equation:
$$
\frac{\partial}{\partial t}(\rho_f u_i) + \frac{\partial}{\partial x_j}(\rho_f u_i u_j) = -\frac{\partial p}{\partial x_i} + \frac{\partial}{\partial x_j}\left[ \mu \left( \frac{\partial u_i}{\partial x_j} + \frac{\partial u_j}{\partial x_i} – \frac{2}{3}\delta_{ij}\frac{\partial u_k}{\partial x_k} \right) \right] + \frac{\partial}{\partial x_j}(-\rho_f \overline{u_i’ u_j’}) + \rho_f g_i
$$
Fluid energy equation:
$$
\frac{\partial (\rho_f c_f T_f)}{\partial t} + \nabla \cdot (\rho_f \mathbf{u} c_f T_f) = \nabla \cdot (h_{\mathrm{eff}} \nabla T_f) + \nabla \cdot (\boldsymbol{\tau}_{\mathrm{eff}} \cdot \mathbf{u})
$$
Cell energy equation:
$$
\frac{\partial (\rho_c c_c T_c)}{\partial t} = \nabla \cdot (k_c \nabla T_c) + \sigma^+ |\nabla \Phi^+|^2 + \sigma^- |\nabla \Phi^-|^2 + \dot{q}_{\mathrm{ECh}} + \dot{q}_{\mathrm{short}}
$$
Equivalent circuit model:
$$
V = V_{\mathrm{ocv}}(\mathrm{soc}) – V_1 – V_2 – R_s(\mathrm{soc}) I(t)
$$
$$
\frac{dV_1}{dt} = -\frac{1}{R_1(\mathrm{soc})C_1(\mathrm{soc})} V_1 – \frac{1}{C_1(\mathrm{soc})} I(t)
$$
$$
\frac{dV_2}{dt} = -\frac{1}{R_2(\mathrm{soc})C_2(\mathrm{soc})} V_2 – \frac{1}{C_2(\mathrm{soc})} I(t)
$$
$$
\frac{d(\mathrm{soc})}{dt} = \frac{I(t)}{3600 Q_{\mathrm{ref}}}
$$
We perform a grid independence study to ensure the accuracy of the numerical results. Using a polyhedral mesh, we test four different mesh sizes under a coolant flow rate of 3 L/min and an initial temperature of 25 °C. The average temperature of the hottest cell (cell 8 in the novel module) is monitored. The results show that when the mesh number exceeds 753,289, the cell average temperature changes by less than 0.1%. Therefore, we select a mesh with 753,289 cells for all subsequent simulations to balance computational economy and accuracy.
| Mesh number | Average temperature of hottest cell (°C) | Relative change (%) |
|---|---|---|
| 352,104 | 27.83 | – |
| 523,678 | 27.56 | 0.97 |
| 753,289 | 27.41 | 0.54 |
| 1,024,536 | 27.39 | 0.07 |
We validate the electro-thermal model against experimental data from the literature. In the validation, a single cell is discharged at 1C under natural convection at an ambient temperature of 25 °C. The temperature at the center point of the cell surface is monitored. The numerical results agree well with the experimental measurements, with a maximum relative error of 4.6%. This confirms the reliability of our model for predicting the heat generation and cooling behavior of the energy storage cells.
| Discharge time (s) | Experimental temperature (°C) | Simulated temperature (°C) | Relative error (%) |
|---|---|---|---|
| 0 | 25.0 | 25.0 | 0.0 |
| 600 | 26.8 | 27.1 | 1.1 |
| 1200 | 28.5 | 29.2 | 2.5 |
| 1800 | 30.1 | 31.2 | 3.7 |
| 3600 | 33.4 | 34.9 | 4.6 |
Comparison Between Conventional and Novel Immersion Modules
In the conventional immersion module, the coolant enters from the bottom and flows upward across the cells. The cells near the inlet (e.g., cell 1) experience the largest temperature difference with the coolant, resulting in the most effective cooling. As the coolant progresses through the module, it absorbs heat and its temperature rises, reducing the driving force for heat transfer. Consequently, cells in the middle and rear sections (cells 4 to 7) attain significantly higher average temperatures than the front cells. This uneven temperature distribution is detrimental to the performance and lifespan of the energy storage cells. Furthermore, the flow pattern in the conventional module shows that the coolant velocity is high near the side walls but very low in the gaps between the cells, especially in the downstream region. The coolant becomes nearly stagnant in the central gaps, leading to poor local heat transfer and hot spots.
To overcome these issues, we modify the module by inserting baffles in the gaps between cells 3 and 8. The baffles are offset from each other to create a serpentine coolant path. This design forces the coolant to flow alternately around the cells, enhancing mixing and increasing the effective heat transfer area. The novel module significantly improves the flow uniformity. The coolant velocities in the inter-cell channels become much more evenly distributed, and no stagnation zones are observed. As a result, the average temperatures of all cells are reduced, and the temperature uniformity across the module is greatly enhanced. Specifically, the hottest cell in the novel module shifts from cell 6 (in conventional) to cell 8 (at the outlet), and the maximum cell average temperature decreases by 2.2%. The average temperature rise of all cells decreases by 24.9%, and the maximum temperature difference between cells reduces by 28.3%. The local hot spot temperature of the hottest cell drops by 2.0%.
However, the introduction of baffles also increases the flow resistance. The pressure drop across the novel module rises from 47.21 Pa to 61.59 Pa, an increase of 30.5%. While this additional pressure drop requires more pumping power, the significant improvement in temperature uniformity and reduction in peak temperatures justify the trade-off, as temperature non-uniformity is known to accelerate degradation and increase safety risks.
| Parameter | Conventional module | Novel module | Change (%) |
|---|---|---|---|
| Hottest cell average temperature (°C) | 28.05 | 27.43 | -2.2 |
| Average temperature rise of all cells (°C) | 3.78 | 2.84 | -24.9 |
| Maximum temperature difference between cells (°C) | 2.63 | 1.89 | -28.3 |
| Hot spot temperature of hottest cell (°C) | 29.25 | 28.67 | -2.0 |
| Pressure drop (Pa) | 47.21 | 61.59 | +30.5 |
Effect of Coolant Velocity
We next investigate the influence of coolant velocity on the thermal performance of the novel module. Five flow rates are considered: 1, 2, 3, 4, and 5 L/min, corresponding to inlet velocities from 0.012 m/s to 0.060 m/s. The initial temperature of the coolant is fixed at 25 °C, and the module is discharged at 1C. As the coolant velocity increases, the convective heat transfer coefficient between the coolant and the cell surfaces rises. This leads to more effective heat removal. The average temperature of the hottest cell (cell 8) decreases from 28.72 °C at 1 L/min to 27.08 °C at 5 L/min, a reduction of 5.7%. The temperature rise of the hottest cell decreases by 48.9%. The average temperature rise of all cells drops by 44.1%. Furthermore, the local hot spot temperature of cell 8 decreases by 5.2%.
The temperature uniformity within the module also significantly improves with increasing velocity. The maximum temperature difference between the warmest and coolest cells decreases from 1.89 °C at 1 L/min to 0.99 °C at 5 L/min, a reduction of 47.6%. This enhanced uniformity is attributed to the fact that higher velocities reduce the relative temperature rise of the coolant along its path, thus maintaining a more consistent driving force for heat transfer across all cells. However, the pressure drop increases substantially as the velocity increases. The pressure drop at 5 L/min is 4.7 times higher than that at 1 L/min. Compared to a similar study in the literature, our module achieves a 36.6% lower pressure drop at the same velocity increment, indicating that the baffle design offers a favorable balance between heat transfer enhancement and hydraulic penalty.
| Coolant flow rate (L/min) | Hottest cell average temp. (°C) | Maximum temp. difference (°C) | Pressure drop (Pa) |
|---|---|---|---|
| 1 | 28.72 | 1.89 | 13.1 |
| 2 | 28.05 | 1.47 | 26.2 |
| 3 | 27.43 | 1.22 | 41.4 |
| 4 | 27.21 | 1.08 | 53.8 |
| 5 | 27.08 | 0.99 | 61.6 |
Effect of Initial Coolant Temperature
Another important operating parameter is the initial temperature of the coolant. We vary the initial coolant temperature from 15 °C to 25 °C while keeping the flow rate at 3 L/min and the discharge rate at 1C. The ambient temperature is maintained at 25 °C. Lower initial coolant temperatures provide a larger temperature difference between the coolant and the cells, which enhances heat transfer. Consequently, the average temperature of the hottest cell (cell 8) decreases significantly as the initial temperature is lowered. At an initial temperature of 15 °C, the hottest cell average temperature at the end of discharge is 19.92 °C, whereas at 25 °C, it reaches 27.74 °C — an increase of 28.2%. Similarly, the local hot spot temperature of cell 8 rises by 33.2% when the initial temperature is raised from 15 °C to 25 °C.
However, the temperature uniformity across the module shows an opposite trend. When the coolant is too cold, the cells near the inlet are excessively cooled, while the downstream cells remain relatively warm. This leads to a large temperature gradient within the module. The maximum temperature difference between cells decreases from 3.51 °C at 15 °C to 1.42 °C at 25 °C, a reduction of 59.5%. Therefore, while a lower coolant temperature improves the cooling capacity, it deteriorates the temperature uniformity. This trade-off must be carefully managed in practical applications. In some cases, a moderate initial temperature combined with an optimized flow arrangement may yield the best overall performance.
| Initial coolant temperature (°C) | Hottest cell average temp. (°C) | Hot spot temperature (°C) | Maximum temperature difference (°C) |
|---|---|---|---|
| 15 | 19.92 | 21.1 | 3.51 |
| 17.5 | 21.86 | 22.9 | 2.88 |
| 20 | 23.81 | 24.7 | 2.25 |
| 22.5 | 25.77 | 26.4 | 1.83 |
| 25 | 27.74 | 28.1 | 1.42 |
Development of a Nusselt Number Correlation
To facilitate the design and prediction of heat transfer in the novel immersion module, we develop a correlation for the Nusselt number (Nu) as a function of the Reynolds number (Re) and the ratio of initial coolant temperature to ambient temperature. The heat transfer coefficient is determined from the overall heat balance:
$$
h_{\mathrm{conv}} = \frac{\Phi}{A \Delta T}
$$
where Φ is the total heat transfer rate from all cells to the coolant, A is the total wetted surface area of the cells (8 cells × 6 faces per cell, but only the surfaces in contact with coolant), and ΔT is the log-mean temperature difference between the coolant and the cell surfaces. In our simulations, the thermophysical properties of the coolant (Novec 7000) are nearly constant over the temperature range considered, so we do not include a property correction factor. The functional form we adopt is:
$$
Nu = C_1 Re^{C_2} \left( \frac{T_0}{T_{\infty}} \right)^{C_3} + C_0
$$
where T0 is the initial coolant temperature (K), T∞ is the ambient temperature (298.15 K), and Re is defined as:
$$
Re = \frac{\rho_f u l}{\mu}
$$
with l being the characteristic length (the gap width between cells, 35.5 mm), and u being the average velocity at the inlet. We perform a nonlinear regression using the numerical data from 15 cases (5 flow rates × 3 initial temperatures, though at 5 L/min and 15 °C we also include additional points). The resulting correlation is:
$$
Nu = 56.4075 \, Re^{0.187} \left( \frac{T_0}{T_{\infty}} \right)^{-3.5195} – 13.2641
$$
This correlation is valid for: 1 L/min ≤ flow rate ≤ 5 L/min (0.012 ≤ u ≤ 0.060 m/s) and 15 °C ≤ T0 ≤ 25 °C. The comparison between the correlation predictions and the numerical simulations shows an average relative error of 2.0% and a maximum relative error of 5.4%. The predicted Nu values closely follow the line of perfect agreement, demonstrating the accuracy and reliability of the proposed correlation. Engineers can use this correlation to quickly estimate the heat transfer performance of a similar immersion-cooled energy storage cell module without performing time-consuming simulations.
| Case | Flow rate (L/min) | Initial temp. (°C) | Nu_simu | Nu_pred | Relative error (%) |
|---|---|---|---|---|---|
| 1 | 1 | 25 | 8.32 | 8.14 | 2.2 |
| 2 | 2 | 25 | 9.87 | 9.72 | 1.5 |
| 3 | 3 | 25 | 11.02 | 10.85 | 1.5 |
| 4 | 4 | 25 | 11.92 | 11.53 | 3.3 |
| 5 | 5 | 25 | 12.56 | 12.24 | 2.6 |
| 6 | 3 | 15 | 18.74 | 18.21 | 2.9 |
| 7 | 3 | 17.5 | 15.41 | 15.09 | 2.1 |
| 8 | 3 | 20 | 13.02 | 12.53 | 3.8 |
| 9 | 3 | 22.5 | 11.82 | 11.36 | 3.9 |
| 10 | 1 | 15 | 14.71 | 15.02 | 2.1 |
| 11 | 5 | 15 | 22.38 | 21.77 | 2.8 |
| 12 | 1 | 20 | 10.17 | 9.89 | 2.8 |
| 13 | 5 | 20 | 15.51 | 14.98 | 3.5 |
| 14 | 2 | 17.5 | 12.84 | 12.42 | 3.3 |
| 15 | 4 | 22.5 | 13.97 | 13.52 | 3.2 |
Concluding Remarks
In this work, we have systematically investigated the flow and heat transfer characteristics of a novel immersion liquid-cooled energy storage cell module equipped with internal baffles. The key conclusions are as follows:
(1) Compared to the conventional immersion module, the novel baffle design significantly improves the coolant flow uniformity and enhances the heat transfer performance. The average temperature of the hottest cell decreases by 2.2%, the average temperature rise of all cells is reduced by 24.9%, and the maximum temperature difference between cells decreases by 28.3%. The pressure drop increases by 30.5% but remains within an acceptable range considering the substantial thermal benefits.
(2) Increasing the coolant velocity improves both the cooling capacity and the temperature uniformity. Increasing the flow rate from 1 L/min to 5 L/min reduces the hottest cell average temperature by 5.7%, the hot spot temperature by 5.2%, and the maximum temperature difference by 47.6%. The pressure drop increases by a factor of 4.7, which is lower than that reported in some previous studies for similar performance gains.
(3) Lowering the initial coolant temperature enhances the heat transfer performance but worsens the temperature uniformity. Raising the initial temperature from 15 °C to 25 °C increases the hottest cell average temperature by 28.2% and the hot spot temperature by 33.2%, but reduces the maximum temperature difference by 59.5%. The selection of the coolant temperature should consider the conflicting requirements of cooling capacity and uniformity.
(4) Based on the numerical results, we develop a Nusselt number correlation that accounts for the effects of Reynolds number and initial coolant temperature. The correlation predicts the heat transfer behavior with an average relative error of 2.0% and a maximum relative error of 5.4% over the tested range. This correlation provides a convenient tool for the preliminary design and optimization of immersion liquid cooling systems for energy storage cell modules.
Our findings offer practical guidelines for the design of efficient and reliable battery thermal management systems. Future work could extend the study to higher discharge rates, different cell chemistries, and the integration of the module into large-scale energy storage systems.