
With the global transition towards renewable energy, large-scale industrial and commercial energy storage systems have become widely deployed. However, the thermal stability of lithium-ion batteries remains a critical challenge, as high operating temperatures accelerate side reactions and increase the risk of thermal runaway. To maintain the battery pack within the optimal temperature range of 20–35°C and ensure uniform temperature distribution, we conducted a comprehensive numerical investigation on the thermal behavior of an energy storage battery pack. The study focused on three key factors: the aspect ratio (W/H) of the liquid cooling plate flow channels, the layout of the cooling plates (bottom only vs. bottom plus side), and the inlet coolant flow rate. An experimentally calibrated simulation model was employed to assess the temperature rise, temperature uniformity, pressure drop, and energy consumption of the cooling system. The findings provide practical guidelines for designing efficient thermal management systems for energy storage battery packs.
1. Numerical Model
1.1 Physical Model
The physical model considers a single battery pack with a 1P52S configuration (one parallel module of 52 cells in series). Each cell is a semi-solid lithium battery with a nominal capacity of 280 A·h and dimensions of 173.8 mm × 71.6 mm × 207.2 mm (length × thickness × height). The pack includes insulating PC boards, thermal silica gel pads, and liquid cooling plates. The cooling plate features four parallel serpentine flow channels. Three aspect ratios were investigated: W/H = 7, 5, and 3, with a fixed channel height H = 6 mm. Two cooling layouts were considered: (a) cooling plate only at the bottom, and (b) cooling plates at both the bottom and the side walls.
1.2 Governing Equations
We made the following assumptions: negligible contact thermal resistance between components; temperature-independent material properties; and negligible radiative heat transfer. The governing equations include the energy conservation equation for the battery, the Navier–Stokes equations for the coolant flow, and the continuity equation. These are expressed as:
$$
\rho c_p \frac{\partial T}{\partial t} = \nabla \cdot (k \nabla T) + Q
$$
$$
\frac{\partial}{\partial t}(\rho \mathbf{v}) + \nabla \cdot (\rho \mathbf{v}\mathbf{v}) = -\nabla p + \mu \nabla^2 \mathbf{v} + \mathbf{F}
$$
$$
\frac{\partial \rho}{\partial t} + \nabla \cdot (\rho \mathbf{v}) = 0
$$
Here, \(\rho\) is density, \(c_p\) is specific heat, \(k\) is thermal conductivity, \(T\) is temperature, \(t\) is time, \(Q\) is the heat generation rate per unit volume, \(\mathbf{v}\) is the velocity vector, \(p\) is pressure, \(\mu\) is dynamic viscosity, and \(\mathbf{F}\) represents body forces.
1.3 Battery Heat Generation
Heat generation in lithium-ion batteries consists of irreversible Joule heating and reversible entropic heating, modeled by the Bernardi equation:
$$
q_v = \frac{1}{V_b} \left( I^2 R + I T \frac{dE_{\text{OC}}}{dT} \right)
$$
where \(I\) is current, \(R\) is internal resistance (including ohmic and polarization resistances), \(T\) is the cell temperature, \(E_{\text{OC}}\) is the open-circuit voltage, and \(V_b\) is the cell volume. The term \(\frac{dE_{\text{OC}}}{dT}\) is taken as a constant 0.00049 V/K. The internal resistance varies with state of charge (SOC) and temperature, which were experimentally characterized via DC resistance mappings. Table 1 presents the measured 10 s pulse discharge internal resistances for various SOC and temperature conditions.
| SOC (%) | −20°C | −10°C | 0°C | 10°C | 25°C | 35°C | 45°C | 55°C |
|---|---|---|---|---|---|---|---|---|
| 0 | — | — | — | — | — | — | — | — |
| 5 | 5.34 | 3.66 | 1.73 | 1.24 | 0.57 | 0.46 | 0.34 | 0.23 |
| 10 | 5.05 | 3.47 | 1.63 | 1.18 | 0.53 | 0.43 | 0.33 | 0.22 |
| 15 | 4.75 | 3.29 | 1.56 | 1.13 | 0.51 | 0.42 | 0.32 | 0.23 |
| 20 | 4.46 | 3.11 | 1.50 | 1.09 | 0.49 | 0.40 | 0.32 | 0.23 |
| 25 | 4.17 | 2.93 | 1.45 | 1.06 | 0.47 | 0.39 | 0.31 | 0.23 |
| 30 | 3.88 | 2.76 | 1.41 | 1.03 | 0.46 | 0.39 | 0.31 | 0.23 |
| 35 | 3.64 | 2.59 | 1.38 | 1.00 | 0.45 | 0.38 | 0.30 | 0.23 |
| 40 | 3.43 | 2.46 | 1.34 | 0.98 | 0.44 | 0.37 | 0.30 | 0.23 |
| 45 | 3.24 | 2.33 | 1.32 | 0.96 | 0.43 | 0.37 | 0.30 | 0.23 |
| 50 | 3.14 | 2.24 | 1.29 | 0.94 | 0.43 | 0.36 | 0.29 | 0.23 |
| 55 | 3.12 | 2.20 | 1.27 | 0.93 | 0.42 | 0.36 | 0.29 | 0.23 |
| 60 | 3.09 | 2.18 | 1.25 | 0.92 | 0.42 | 0.36 | 0.29 | 0.23 |
| 65 | 3.05 | 2.15 | 1.24 | 0.91 | 0.43 | 0.37 | 0.30 | 0.23 |
| 70 | 3.01 | 2.13 | 1.23 | 0.91 | 0.42 | 0.36 | 0.30 | 0.23 |
| 75 | 2.97 | 2.10 | 1.22 | 0.90 | 0.41 | 0.35 | 0.29 | 0.23 |
| 80 | 2.93 | 2.07 | 1.21 | 0.89 | 0.41 | 0.35 | 0.29 | 0.23 |
| 85 | 2.88 | 2.04 | 1.19 | 0.87 | 0.40 | 0.34 | 0.29 | 0.23 |
| 90 | 2.83 | 2.00 | 1.17 | 0.86 | 0.39 | 0.34 | 0.28 | 0.23 |
| 95 | 2.79 | 1.97 | 1.16 | 0.85 | 0.39 | 0.33 | 0.28 | 0.23 |
| 100 | 2.77 | 1.97 | 1.17 | 0.86 | 0.39 | 0.34 | 0.29 | 0.23 |
1.4 Computational Domain and Boundary Conditions
The computational domain includes the battery pack, surrounding air, and coolant fluid. The ambient temperature is set to 25°C. The external walls of the pack experience natural convection with a heat transfer coefficient of 5 W/(m²·K). The coolant (water) inlet is defined as a mass flow inlet (0.1791 kg/s for the baseline) at 22°C, and the outlet is at 1 atm pressure. A 2 mm thick thermal silica gel pad is used between the cell bottom and the cooling plate. The entire system is solved transiently for a 0.5 C constant-current discharge from 100% to 10% SOC (6480 s). The SOC-dependent internal resistance is updated using temperature and SOC mappings.
1.5 Model Validation
We validated the simulation model by comparing the single-cell surface temperature during 1C and 0.5C discharges against experimental measurements. The relative error was calculated as:
$$
\text{Relative error} = \left| \frac{T_{\text{exp}} – T_{\text{sim}}}{T_{\text{exp}}} \right|
$$
The results showed excellent agreement, with a maximum error of 2.9% under 0.5C discharge, confirming the model’s reliability. All subsequent pack-level simulations were performed under 0.5C discharge.
2. Results and Discussion
2.1 Effect of Flow Channel Aspect Ratio (W/H)
We first examined the influence of the cooling channel aspect ratio while maintaining a constant bottom cooling flow rate of 10 L/min. The maximum cell temperature at the top cover (monitoring point) after 6480 s is summarized in Table 2.
| W/H ratio | Temperature rise (°C) |
|---|---|
| 7 | 8.08 |
| 5 | 8.04 |
| 3 | 8.01 |
The temperature difference among the three aspect ratios was minimal (less than 0.1°C). However, the hydraulic performance differed significantly. The pressure drop across the cooling system and the corresponding pumping energy consumption are shown in Table 3.
| W/H ratio | Pressure drop (kPa) | Energy consumption (kJ) |
|---|---|---|
| 7 | 18.5 | 2.96 |
| 5 | 17.2 | 2.75 |
| 3 | 12.5 | 2.00 |
When W/H decreased from 7 to 3, the pressure drop reduced by 32.4%, and energy consumption dropped by 32.4% as well. The reduction in flow resistance is due to the decreased wetted perimeter at a fixed hydraulic diameter. Therefore, W/H = 3 offers the best trade-off, providing adequate cooling with significantly lower pumping power.
2.2 Effect of Cooling Plate Layout
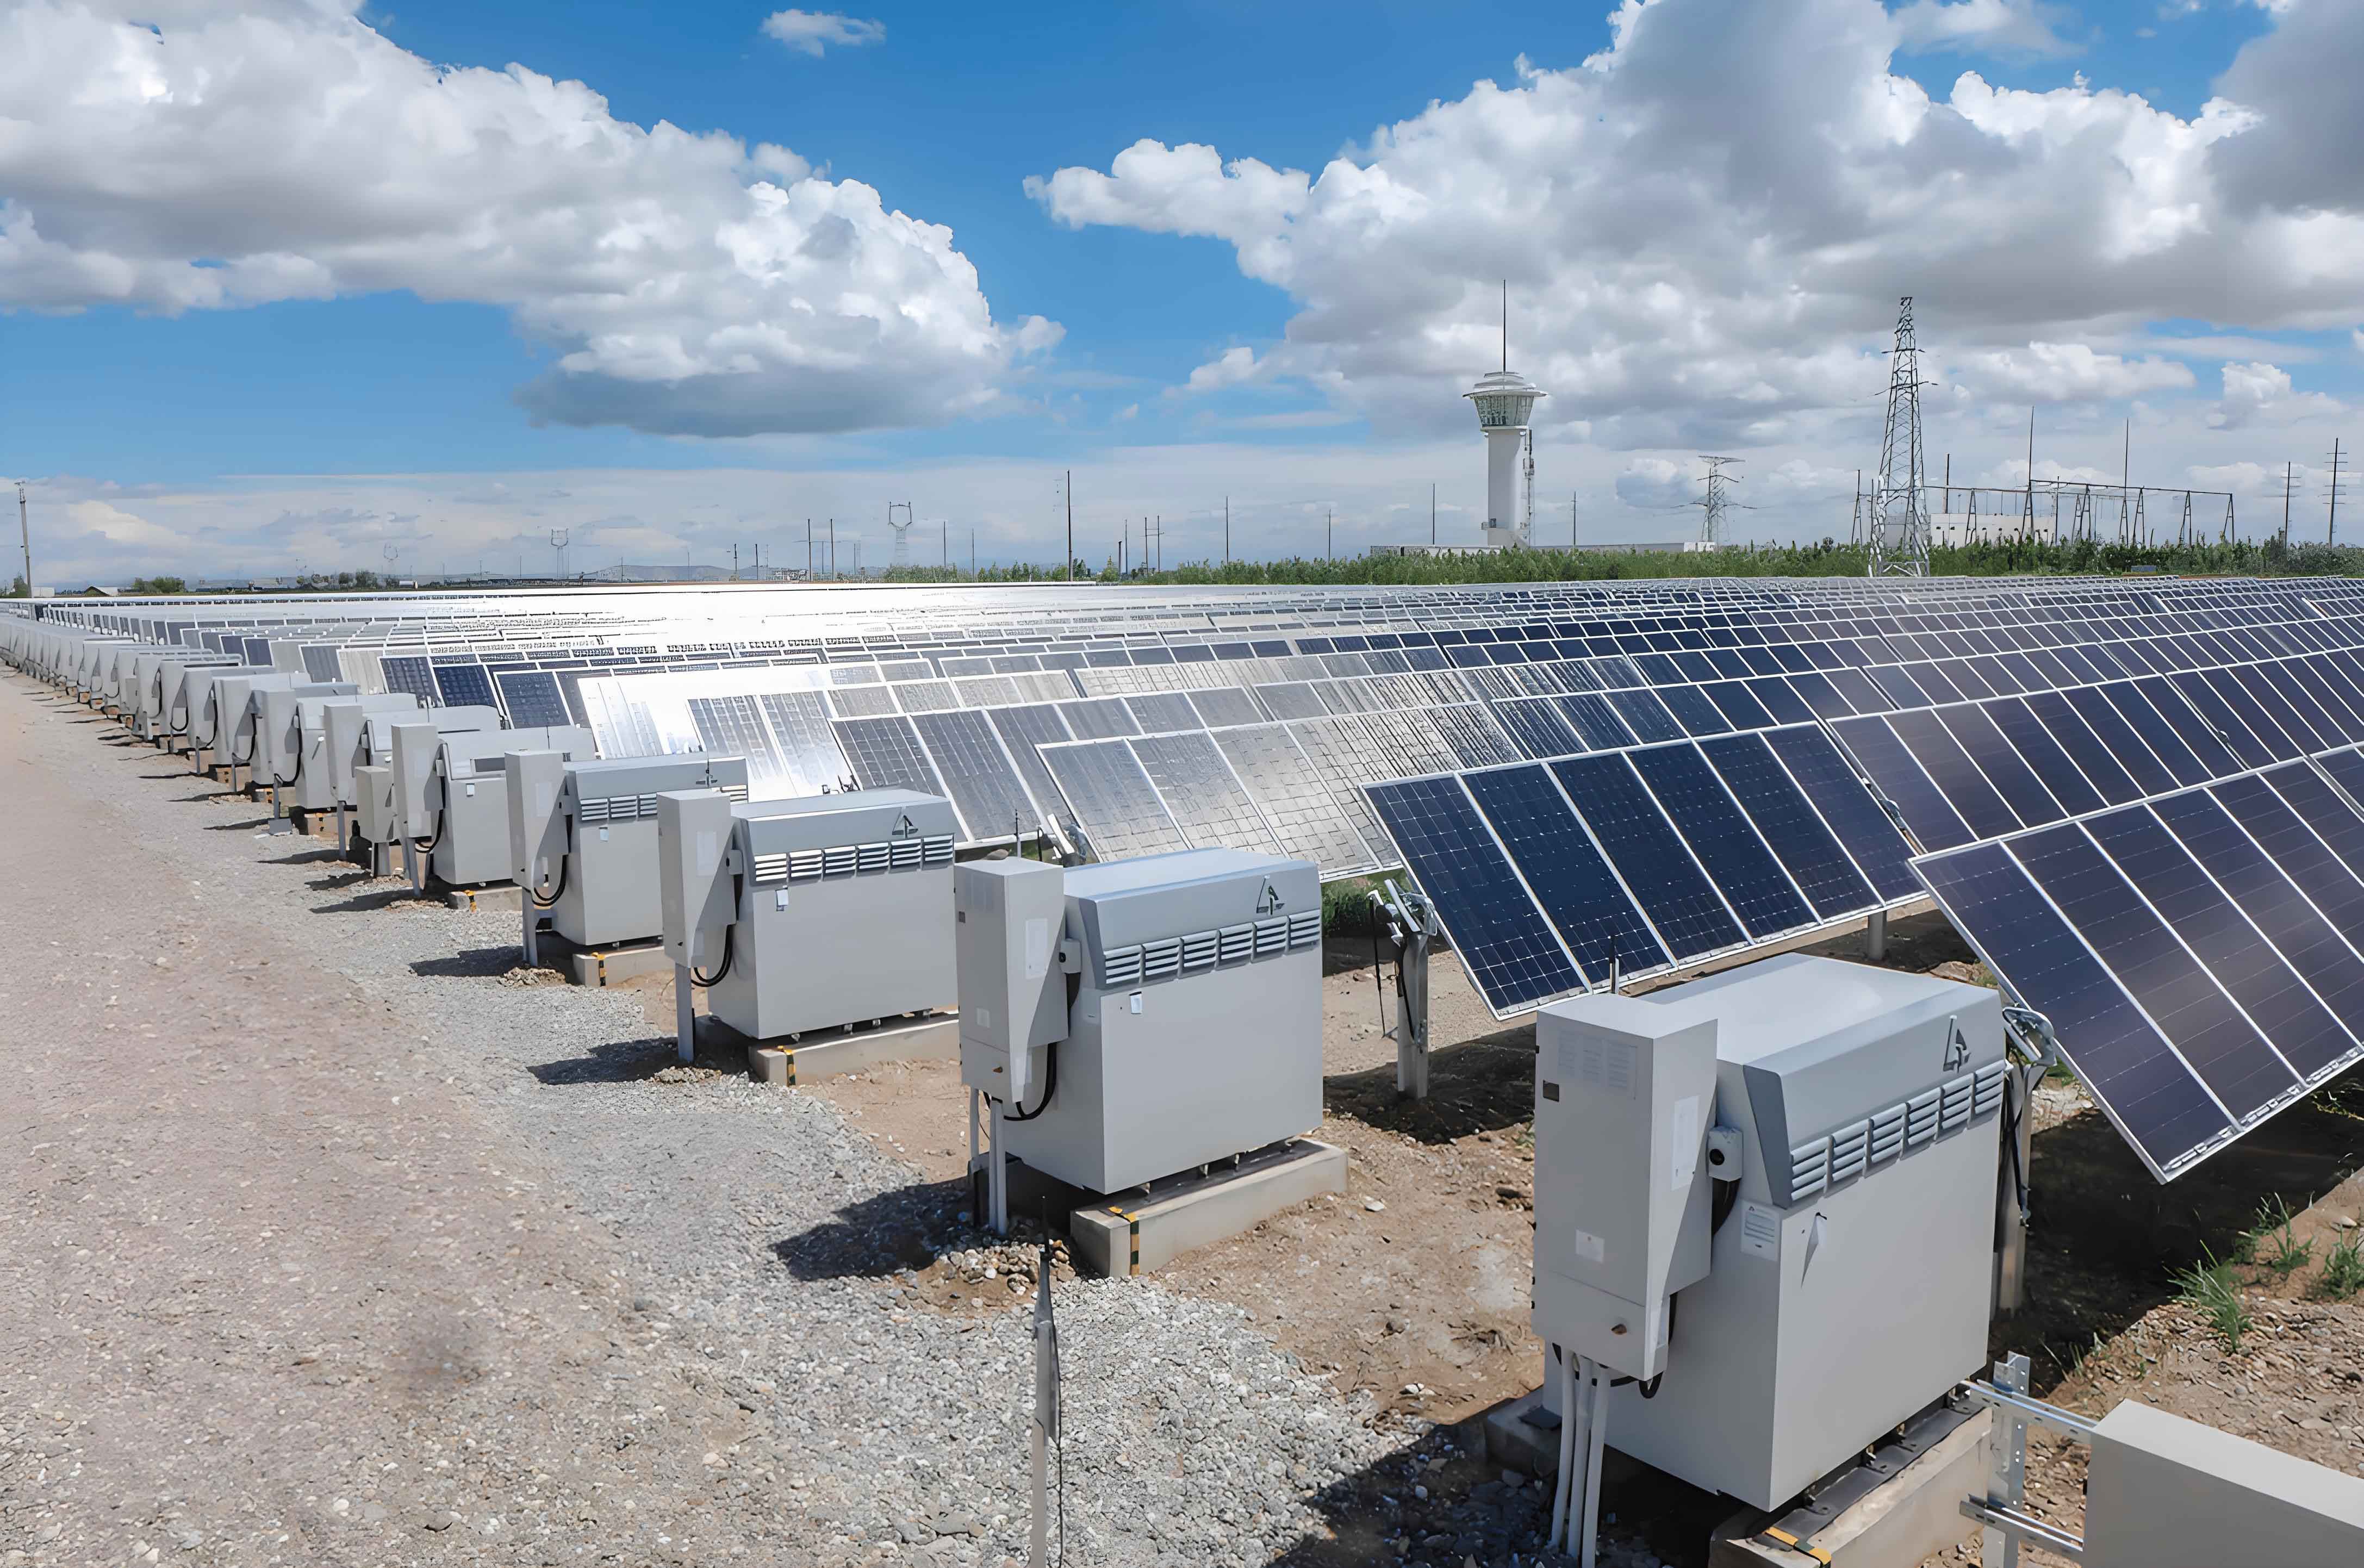
Two cooling layouts were compared: cooling only at the bottom versus cooling at both the bottom and the two side walls of the battery pack. In both cases, the total coolant flow rate was 10 L/min. Figure 1 illustrates the configuration of the bottom+side layout.
The maximum cell temperature rise and global temperature difference (maximum minus minimum) across the entire pack after 6480 s are summarized in Table 4.
| Layout | Max temperature rise (°C) | Global ΔTmax (°C) |
|---|---|---|
| Bottom only | 7.62 | 8.80 |
| Bottom + side | 0.51 | 3.00 |
The bottom+side cooling layout dramatically reduced the maximum temperature rise by 93.3% compared to the bottom-only layout, and improved temperature uniformity by 65.9% (global ΔTmax reduced from 8.80°C to 3.00°C). The heat transfer power, defined as the rate of thermal energy removed by the coolant, was also computed. At 200 s, the bottom+side layout achieved a heat transfer power 333.85% higher than the bottom-only layout, and at the end of discharge it was still 107.52% higher. This clearly demonstrates the superiority of incorporating side cooling in the energy storage battery pack design.
2.3 Effect of Coolant Flow Rate
We investigated the impact of the bottom coolant flow rate (5, 7.5, 10, 12.5, and 15 L/min) for the bottom-only layout. The resulting cell top cover maximum temperature at the end of discharge is listed in Table 5.
| Flow rate (L/min) | Max temperature (°C) | Global ΔTmax (°C) |
|---|---|---|
| 5.0 | 33.46 | 2.84 |
| 7.5 | 33.08 | 2.45 |
| 10.0 | 32.62 | 1.80 |
| 12.5 | 32.28 | 1.35 |
| 15.0 | 32.09 | 1.20 |
As flow rate increased, both the maximum temperature and the global temperature difference decreased monotonically, but the diminishing returns were evident. The incremental reduction in max temperature from 12.5 to 15 L/min was only 0.19°C. Meanwhile, the pressure drop across the cooling system increased superlinearly with flow rate (from 5.2 kPa at 5 L/min to 38.7 kPa at 15 L/min), and energy consumption rose accordingly. Hence, we identified an optimal range of 10–12.5 L/min, which achieves effective cooling without excessive parasitic losses.
2.4 Multi-Factor Optimization
Finally, we combined the three best-performing factors: W/H = 3 (lowest pressure drop), bottom+side cooling layout, and a bottom flow rate of 12.5 L/min. This optimal configuration was compared against each individual factor and the baseline (bottom-only, W/H=7, 10 L/min). Table 6 summarizes the key thermal metrics at the end of discharge.
| Configuration | Max temperature rise (°C) | Global ΔTmax (°C) |
|---|---|---|
| Baseline (W/H=7, bottom, 10 L/min) | 8.08 | 8.80 |
| Single: W/H=3 (bottom, 10 L/min) | 8.01 | 8.71 |
| Single: bottom+side (W/H=7, 10 L/min) | 0.51 | 3.00 |
| Single: 12.5 L/min (W/H=7, bottom) | 7.80 | 8.10 |
| Multi-factor (W/H=3, bottom+side, 12.5 L/min) | 0.40 | 2.90 |
The multi-factor configuration achieved the lowest maximum temperature rise (0.40°C) and the best temperature uniformity (2.9°C global ΔTmax). Remarkably, the single factor of bottom+side cooling alone already brought the max temperature rise to 0.51°C, only 0.11°C higher than the multi-factor result. This indicates that the change from bottom-only to bottom+side cooling is the dominant contributor to the overall thermal improvement, accounting for over 95% of the temperature reduction. The additional benefits from optimizing the aspect ratio and flow rate, while noticeable, are secondary. However, to minimize pumping energy and ensure robust operation at high ambient temperatures, the combination of all three factors is still recommended.
3. Conclusions
This study presented a comprehensive numerical investigation of the thermal behavior of an energy storage battery pack using an experimentally validated model. The key findings are:
- A smaller flow channel aspect ratio (W/H = 3) had minimal effect on cell temperature but significantly reduced pressure drop (by 32.4%) and pumping energy compared to larger ratios.
- The bottom+side cooling layout outperformed the conventional bottom-only layout, reducing the maximum cell temperature rise by 93.3% (from 7.62°C to 0.51°C) and improving temperature uniformity by 65.9% (global ΔTmax from 8.80°C to 3.00°C).
- An appropriate coolant flow rate in the range of 10–12.5 L/min provided effective cooling and reasonable pressure drop; further increasing the flow rate yielded diminishing returns while increasing energy consumption.
- Multi-factor optimization (W/H=3, bottom+side, 12.5 L/min) delivered the best overall performance (max temperature rise 0.40°C, global ΔTmax 2.9°C), but the side cooling layout was the single most impactful factor.
By implementing these design recommendations, the energy storage battery pack can maintain a safe and uniform operating temperature, prolonging cycle life and enhancing system reliability. Future work could explore active control strategies and phase-change materials to further improve thermal management under extreme conditions.