
As an observer and analyst of global energy trends, I find the rapid expansion of solar photovoltaic (PV) capacity to be one of the most transformative developments in the modern energy landscape. The growth of the solar system—encompassing PV panels, inverters, storage, and grid integration—has been nothing short of phenomenal. In this article, I will delve into the historical data, current status, and future projections for solar PV capacity worldwide, with a particular focus on the matching relationship between technological advancements, market dynamics, and deployment rates. I will employ tables, mathematical formulas, and detailed analysis to provide a comprehensive overview. The integration of the solar system into our energy infrastructure is not just about numbers; it reflects a broader shift toward sustainability and resilience.
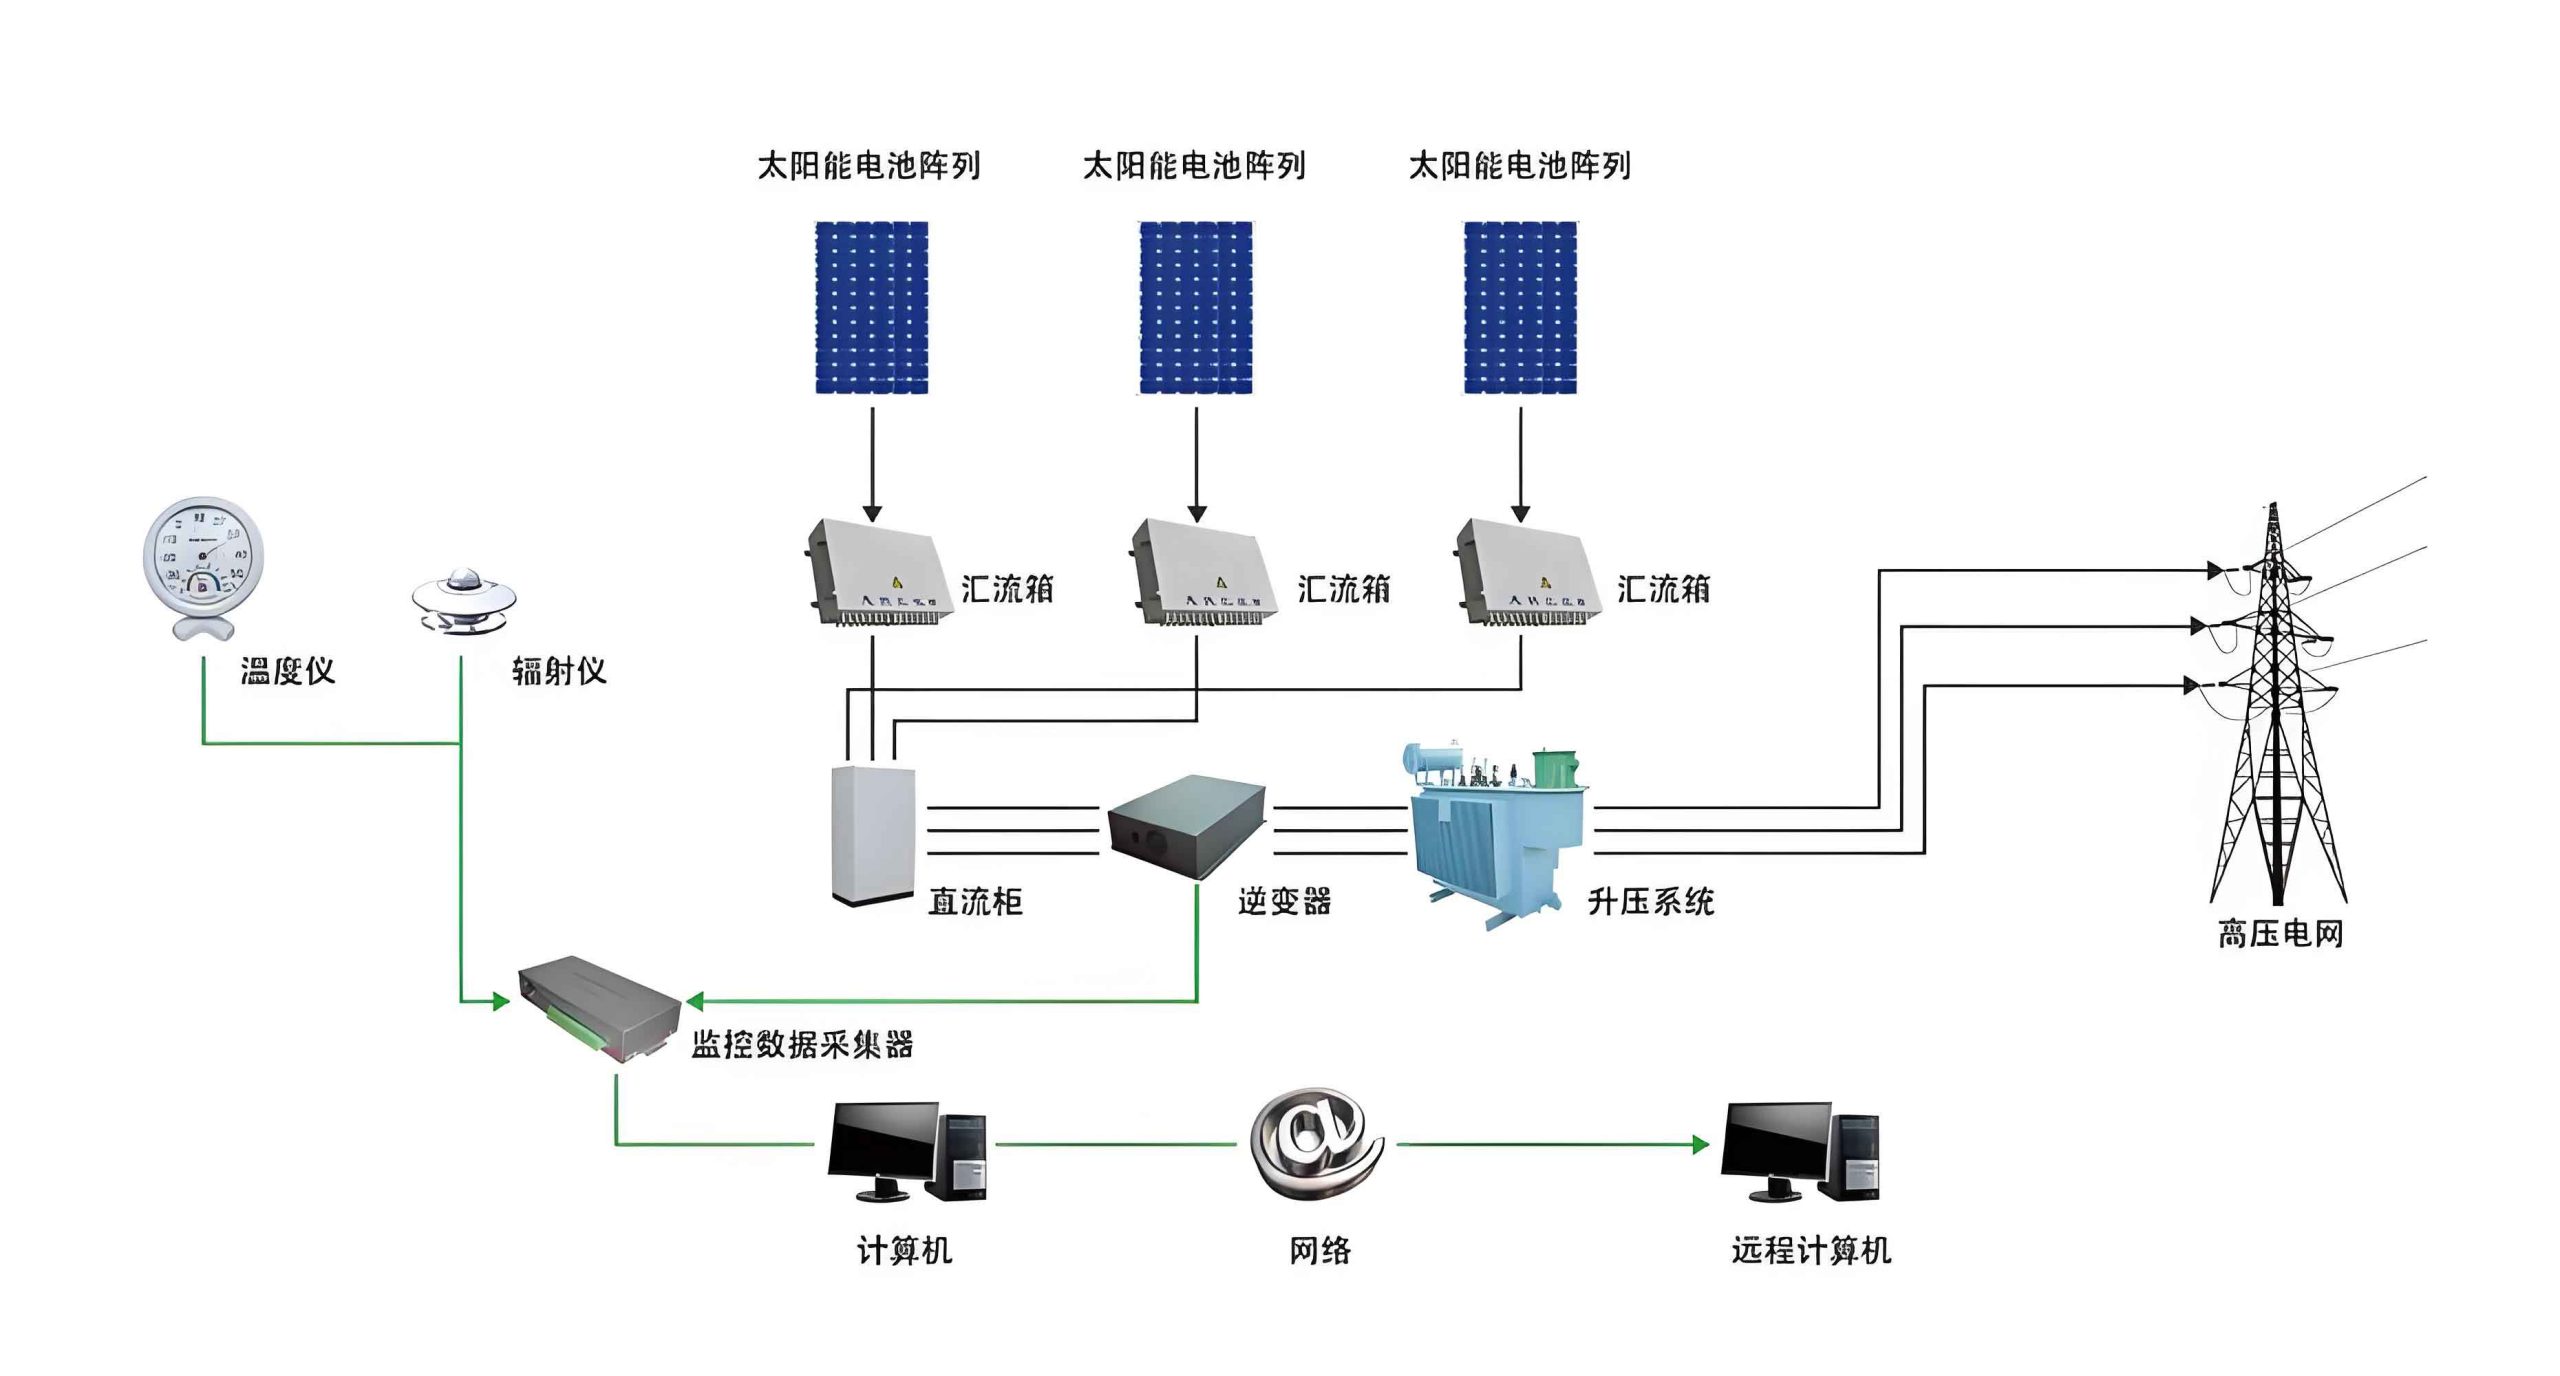
The solar system, in the context of PV energy, refers to the interconnected components that capture sunlight and convert it into electricity. Over the past decade, the cumulative installed capacity of solar PV has skyrocketed, driven by falling costs, supportive policies, and growing environmental awareness. From my perspective, understanding this growth requires examining both global and regional trends. Let me start by presenting a detailed table of global solar PV capacity from 2012 to 2022, based on available data and projections.
| Year | Cumulative Capacity (GW) | Annual Growth Rate (%) |
|---|---|---|
| 2012 | 100.5 | — |
| 2013 | 138.0 | 37.31 |
| 2014 | 177.0 | 28.26 |
| 2015 | 227.0 | 28.25 |
| 2016 | 306.5 | 35.02 |
| 2017 | 405.0 | 32.14 |
| 2018 (Projected) | 527.0 | 30.12 |
| 2019 (Projected) | 675.0 | 28.08 |
| 2020 (Projected) | 865.0 | 28.15 |
| 2021 (Projected) | 1108.0 | 28.09 |
| 2022 (Projected) | 1423.0 | 28.43 |
From the table, it is evident that the solar system has experienced consistent growth, with the cumulative capacity increasing from 100.5 GW in 2012 to a projected 1423 GW in 2022. The annual growth rates, while fluctuating, have remained high, averaging around 30% over the period. This expansion can be modeled using compound annual growth rate (CAGR) formulas. For instance, the CAGR from 2012 to 2022 can be calculated as:
$$ CAGR = \left( \frac{V_f}{V_i} \right)^{\frac{1}{n}} – 1 $$
Where \( V_f \) is the final value (1423 GW), \( V_i \) is the initial value (100.5 GW), and \( n \) is the number of years (10). Plugging in the values:
$$ CAGR = \left( \frac{1423}{100.5} \right)^{\frac{1}{10}} – 1 \approx 0.2823 \text{ or } 28.23\% $$
This matches the projected average growth rate mentioned in the data. The solar system’s scalability is a key factor here; as deployment increases, economies of scale drive down costs, further accelerating adoption. The matching relationship between cost reductions and capacity growth is crucial. I can express this relationship using a simple logarithmic model:
$$ \ln(C) = \alpha – \beta \ln(P) $$
Where \( C \) is the cumulative capacity, \( P \) is the price per watt, and \( \alpha \) and \( \beta \) are constants. Historically, for every doubling of cumulative capacity, PV module prices have fallen by about 20-30%, a phenomenon known as the learning curve. This reinforces the idea that the solar system thrives on a virtuous cycle of deployment and cost reduction.
Turning to China, the world’s largest market for solar PV, the growth has been even more staggering. The Chinese solar system has benefited from aggressive government targets, manufacturing prowess, and domestic demand. Below is a table summarizing China’s solar PV capacity from 2015 to 2022.
| Year | Cumulative Capacity (GW) | Annual Growth Rate (%) |
|---|---|---|
| 2015 | 43.18 | — |
| 2016 | 77.42 | 79.30 |
| 2017 | 130.25 | 68.24 |
| 2018 (Projected) | 215.0 | 65.07 |
| 2019 (Projected) | 318.0 | 47.91 |
| 2020 (Projected) | 470.0 | 47.80 |
| 2021 (Projected) | 690.0 | 46.81 |
| 2022 (Projected) | 1010.0 | 46.38 |
The data shows that China’s solar system expanded from 43.18 GW in 2015 to a projected 1010 GW in 2022, with a CAGR of approximately 47.22% over the 2018-2022 period. This rapid growth underscores the importance of policy support in matching supply with demand. The Chinese government’s targets, such as the 13th Five-Year Plan, have been instrumental in driving this expansion. The CAGR for China from 2015 to 2022 can be computed as:
$$ CAGR = \left( \frac{1010}{43.18} \right)^{\frac{1}{7}} – 1 \approx 0.4722 \text{ or } 47.22\% $$
This high growth rate highlights how the solar system in China is being deployed at an unprecedented pace. Factors such as grid integration, storage solutions, and technological innovations play a matching role in sustaining this growth. For example, the efficiency of PV cells has improved steadily, which can be represented by the formula for conversion efficiency:
$$ \eta = \frac{P_{out}}{P_{in}} \times 100\% $$
Where \( \eta \) is the efficiency, \( P_{out} \) is the electrical power output, and \( P_{in} \) is the solar irradiance input. Advances in materials, like perovskite solar cells, are pushing efficiencies higher, making the solar system more competitive with fossil fuels.
Beyond raw numbers, the solar system involves complex interactions between various components. The integration of energy storage, such as batteries, is becoming increasingly important to address intermittency. The matching relationship between PV capacity and storage capacity can be modeled using optimization formulas. For instance, to minimize the levelized cost of electricity (LCOE) for a solar system with storage, one might use:
$$ LCOE = \frac{\sum_{t=1}^{T} (C_t + O_t) / (1+r)^t}{\sum_{t=1}^{T} E_t / (1+r)^t} $$
Where \( C_t \) is capital cost in year \( t \), \( O_t \) is operating cost, \( E_t \) is energy generated, \( r \) is the discount rate, and \( T \) is the system lifetime. This formula helps in designing a solar system that balances upfront investment with long-term benefits.
Looking at global trends, the solar system is not uniform across regions. Europe, North America, and Asia-Pacific each have unique market dynamics. For example, Europe has focused on distributed generation, while the U.S. has seen utility-scale projects dominate. The matching of policy incentives with local resources is key. I can illustrate this with a table comparing regional capacities in 2022 (projected).
| Region | Projected Capacity (GW) | Share of Global Total (%) |
|---|---|---|
| Asia-Pacific (including China) | 1050 | 73.8 |
| Europe | 200 | 14.1 |
| North America | 150 | 10.5 |
| Rest of World | 23 | 1.6 |
| Global Total | 1423 | 100.0 |
This table shows that the Asia-Pacific region, led by China, will account for nearly three-quarters of global solar system capacity by 2022. This concentration raises questions about supply chain resilience and geopolitical factors. The matching of manufacturing capacity with deployment rates is critical; disruptions in one part of the solar system can ripple through the entire value chain.
Technological innovations are continually reshaping the solar system. Bifacial panels, tracking systems, and floating PV are examples of how the industry adapts to different environments. The energy yield of a solar system can be enhanced by tracking the sun, which can be described by the formula for daily energy capture:
$$ E_{daily} = \int_{sunrise}^{sunset} P_{max} \cdot \cos(\theta(t)) \, dt $$
Where \( P_{max} \) is the peak power output, and \( \theta(t) \) is the angle of incidence at time \( t \). Such optimizations improve the matching of solar resource availability with energy demand.
Policy frameworks also play a pivotal role in the expansion of the solar system. Feed-in tariffs, tax credits, and renewable portfolio standards have been effective in many countries. The matching of policy stability with investor confidence is essential for long-term growth. For instance, the stepwise reduction of subsidies, as seen in Germany’s Energiewende, requires careful calibration to avoid market shocks. This can be analyzed using differential equations modeling market dynamics:
$$ \frac{dC}{dt} = k \cdot I(t) – \delta C $$
Where \( C \) is capacity, \( I(t) \) is investment inflow, \( k \) is a conversion factor, and \( \delta \) is the depreciation rate. Stable policies ensure that \( I(t) \) remains positive, sustaining growth in the solar system.
Economic factors, such as the cost of capital and electricity prices, influence the adoption of the solar system. The net present value (NPV) of a solar project is a common metric:
$$ NPV = \sum_{t=0}^{T} \frac{R_t – C_t}{(1 + r)^t} $$
Where \( R_t \) is revenue from electricity sales, \( C_t \) is costs, and \( r \) is the discount rate. A positive NPV indicates viability, driving deployment. The matching of project economics with local conditions—like solar irradiance and grid tariffs—determines where the solar system flourishes.
Environmental benefits are a major driver for the solar system. By displacing fossil fuels, PV reduces greenhouse gas emissions. The carbon savings can be quantified as:
$$ \Delta CO_2 = E_{PV} \cdot (EF_{grid} – EF_{PV}) $$
Where \( \Delta CO_2 \) is the reduction in CO2 emissions, \( E_{PV} \) is the energy generated by the solar system, \( EF_{grid} \) is the emission factor of the grid, and \( EF_{PV} \) is the lifecycle emission factor of PV (typically low). This matching of clean energy generation with emission targets is crucial for climate goals.
Looking ahead, the solar system faces challenges such as grid integration, material scarcity, and recycling. Advanced inverters and smart grid technologies are needed to manage variable output. The matching of PV deployment with grid upgrades is essential to avoid curtailment. Formulas like the capacity factor (CF) help assess performance:
$$ CF = \frac{E_{actual}}{E_{max}} $$
Where \( E_{actual} \) is the actual annual energy output, and \( E_{max} \) is the maximum possible output if the solar system operated at peak capacity 24/7. Typical CF values for PV range from 15-25%, depending on location and technology.
Innovations in storage, such as lithium-ion batteries and flow batteries, are enhancing the reliability of the solar system. The matching of storage capacity with PV output can be optimized using algorithms that balance supply and demand. For example, the state of charge (SOC) of a battery system can be modeled as:
$$ SOC(t+1) = SOC(t) + \eta_{ch} \cdot P_{ch}(t) – \frac{P_{dis}(t)}{\eta_{dis}} $$
Where \( \eta_{ch} \) and \( \eta_{dis} \) are charging and discharging efficiencies, and \( P_{ch} \) and \( P_{dis} \) are power flows. This ensures the solar system can provide power even when the sun isn’t shining.
Global collaboration is key to advancing the solar system. International initiatives, like the International Solar Alliance, foster knowledge sharing and investment. The matching of research efforts with market needs accelerates innovation. For instance, perovskite solar cells are nearing commercialization, promising higher efficiencies at lower costs. The efficiency improvement over time can be approximated by an exponential growth model:
$$ \eta(t) = \eta_0 \cdot e^{gt} $$
Where \( \eta_0 \) is the initial efficiency, and \( g \) is the growth rate. Such advancements make the solar system more attractive across diverse applications.
In conclusion, the solar system—encompassing PV technology, storage, and grid integration—is on a trajectory of explosive growth. From my analysis, the matching relationship between capacity expansion, cost reductions, and policy support is fundamental. The data shows that global solar PV capacity could reach 1423 GW by 2022, with China leading at 1010 GW. Formulas like CAGR, LCOE, and NPV help quantify these trends. As the solar system evolves, addressing challenges like storage and grid stability will be crucial. Ultimately, the continued deployment of solar PV is not just an energy transition; it’s a transformation toward a sustainable future, where the sun powers our world in harmony with technological and economic realities.
The solar system, in all its complexity, offers a blueprint for renewable energy integration. By leveraging mathematical models and empirical data, we can optimize its design and deployment. I believe that with continued innovation and international cooperation, the solar system will play an increasingly dominant role in the global energy mix, matching our energy needs with environmental stewardship for generations to come.