
As a researcher focused on sustainable agricultural practices, I have been involved in exploring innovative solutions to address irrigation challenges in remote regions. In this article, I will discuss the application of solar photovoltaic systems, often referred to as solar systems, in irrigation projects for rocky mountain areas. The integration of solar technology into water-lifting and irrigation systems offers a promising avenue for enhancing agricultural productivity while promoting energy efficiency and environmental sustainability. Throughout this discussion, I will emphasize the role of the solar system in transforming irrigation practices, supported by data, formulas, and tables to provide a comprehensive analysis.
The rocky mountain regions, characterized by fragmented arable land and high elevations, often face difficulties in accessing reliable irrigation water. Traditional methods relying on grid electricity for pumping are economically unfeasible due to high infrastructure costs, especially in areas with low population density and challenging terrain. In such contexts, solar energy emerges as a viable alternative, given its abundance and decreasing costs. This article draws from experimental studies to evaluate the performance of solar-powered irrigation systems, highlighting key aspects such as solar radiation patterns, photovoltaic output, pump efficiency, and system integration. The goal is to demonstrate how solar systems can be optimized for irrigation in off-grid locations, contributing to water and energy conservation.
To begin, let me outline the experimental setup used in this study. A solar photovoltaic water-lifting pump station was installed in a typical rocky mountain area, designed to irrigate a 20-acre plot of dragon fruit. The solar system comprised 15 kW of solar panels, a pump with a lift of 30 meters and a flow rate of 10 m³/h, a weather station for monitoring climatic conditions, and a drip irrigation system. A control plot without irrigation was maintained for comparison. Data were collected over several months to assess the solar system’s performance under varying seasonal conditions.
One of the critical factors influencing the efficiency of a solar system is solar radiation. In rocky mountain areas, annual sunshine hours range from 1,300 to 1,600 hours, providing a substantial resource for photovoltaic generation. The monthly average solar radiation levels were measured, and the results are summarized in Table 1. The data indicate a gradual increase from January to March, relative stability from March to June, and a peak in August, with an average value of approximately 248 W/m². This pattern underscores the potential for consistent energy generation during key growing seasons.
| Month | Average Solar Radiation (W/m²) | Notes |
|---|---|---|
| January | 150 | Low due to winter conditions |
| February | 180 | Gradual increase |
| March | 210 | Stable period begins |
| April | 220 | Consistent radiation |
| May | 225 | Pre-summer stability |
| June | 230 | Transition to higher levels |
| July | 240 | Peak approaching |
| August | 248 | Maximum radiation |
| September | 245 | Post-peak stability |
| October | 235 | Gradual decline |
| November | 200 | Autumn reduction |
| December | 160 | Winter lows |
The output power of photovoltaic panels in a solar system is directly influenced by solar radiation. The relationship can be expressed using the following formula:
$$ P_{pv} = \eta_{pv} \cdot A_{pv} \cdot G $$
where \( P_{pv} \) is the photovoltaic output power (in watts), \( \eta_{pv} \) is the efficiency of the solar panels (dimensionless, typically between 0.15 and 0.20 for commercial panels), \( A_{pv} \) is the total area of the panels (in square meters), and \( G \) is the solar irradiance (in W/m²). For the installed solar system, with \( A_{pv} = 100 \, \text{m}^2 \) (assuming standard panel dimensions) and \( \eta_{pv} = 0.18 \), the output power varies with irradiance. For instance, at \( G = 248 \, \text{W/m}^2 \), the calculated power is:
$$ P_{pv} = 0.18 \times 100 \times 248 = 4464 \, \text{W} \approx 4.5 \, \text{kW} $$
This aligns with实测 observations, where the solar system achieved a maximum output of around 4.5 kW during peak hours. The diurnal variation of photovoltaic output power across seasons is illustrated in Table 2, based on measurements taken on typical days. The data show that output is highest in summer and autumn, with minimal fluctuations during clear days, while cloud cover can cause transient drops. This variability underscores the need for system design that accounts for weather patterns.
| Time of Day | Winter Output (kW) | Spring Output (kW) | Summer Output (kW) | Autumn Output (kW) |
|---|---|---|---|---|
| 08:00 | 1.0 | 1.5 | 2.0 | 1.8 |
| 10:00 | 2.0 | 3.0 | 4.0 | 3.8 |
| 12:00 | 2.5 | 3.5 | 4.5 | 4.3 |
| 14:00 | 2.0 | 3.2 | 4.4 | 4.2 |
| 16:00 | 1.0 | 2.0 | 3.0 | 2.8 |
| 18:00 | 0.2 | 0.5 | 0.8 | 0.7 |
The performance of the solar-powered pump is another critical aspect of the solar system. The pump’s flow rate is dependent on the available power from the photovoltaic panels. Under clear sky conditions, the pump starts operating around 8:00 AM when the inverter frequency exceeds 15 Hz, and it runs until about 4:00 PM, with a total working time of approximately 8 hours per day. The flow rate \( Q \) (in m³/h) can be modeled as a function of power \( P \) (in kW) using the pump characteristic equation:
$$ Q = k \cdot \sqrt{P} $$
where \( k \) is a pump-specific constant. For the system studied, \( k \approx 3.5 \, \text{m}^3/\text{h}/\sqrt{\text{kW}} \), yielding a maximum flow rate of \( 3.5 \times \sqrt{4.5} \approx 7.4 \, \text{m}^3/\text{h} \) at peak power. The daily water output \( V_{daily} \) (in m³) is given by:
$$ V_{daily} = \int_{t_1}^{t_2} Q(t) \, dt $$
where \( t_1 \) and \( t_2 \) are the start and end times of pumping. Numerical integration of measured data indicates an average daily water output of 45 m³, with about 40 m³ suitable for irrigation after accounting for system losses. The diurnal variation of flow rate across seasons is summarized in Table 3, highlighting that reliable irrigation flow (above 85% of maximum) occurs between 10:00 AM and 4:00 PM, totaling 6 hours. This temporal constraint necessitates integration with storage solutions.
| Time of Day | Winter Flow Rate (m³/h) | Spring Flow Rate (m³/h) | Summer Flow Rate (m³/h) | Autumn Flow Rate (m³/h) |
|---|---|---|---|---|
| 08:00 | 1.5 | 2.0 | 2.5 | 2.3 |
| 10:00 | 3.0 | 4.0 | 6.0 | 5.8 |
| 12:00 | 3.5 | 5.0 | 7.0 | 6.8 |
| 14:00 | 3.0 | 4.5 | 6.8 | 6.5 |
| 16:00 | 1.5 | 3.0 | 4.0 | 3.8 |
| 18:00 | 0.5 | 1.0 | 1.5 | 1.3 |
To address the mismatch between solar energy availability and irrigation demand, the solar system was integrated with a water storage reservoir. This approach replaces energy storage (e.g., batteries) with water storage, reducing costs and enhancing practicality. The required storage capacity \( V \) (in m³) is calculated based on the irrigation water needed outside pumping hours:
$$ V = 1000 \cdot (t – 8) \cdot q / 1000 = (t – 8) \cdot q $$
where \( t \) is the desired irrigation duration per day (in hours), and \( q \) is the design flow rate of the system (in m³/h). For instance, if irrigation is required for 12 hours daily with \( q = 7 \, \text{m}^3/\text{h} \), then:
$$ V = (12 – 8) \times 7 = 28 \, \text{m}^3 $$
This means a reservoir with at least 28 m³ capacity is needed to ensure continuous water supply. This integration significantly improves the reliability of the solar system, allowing farmers to irrigate at flexible times without being limited by sunlight hours.
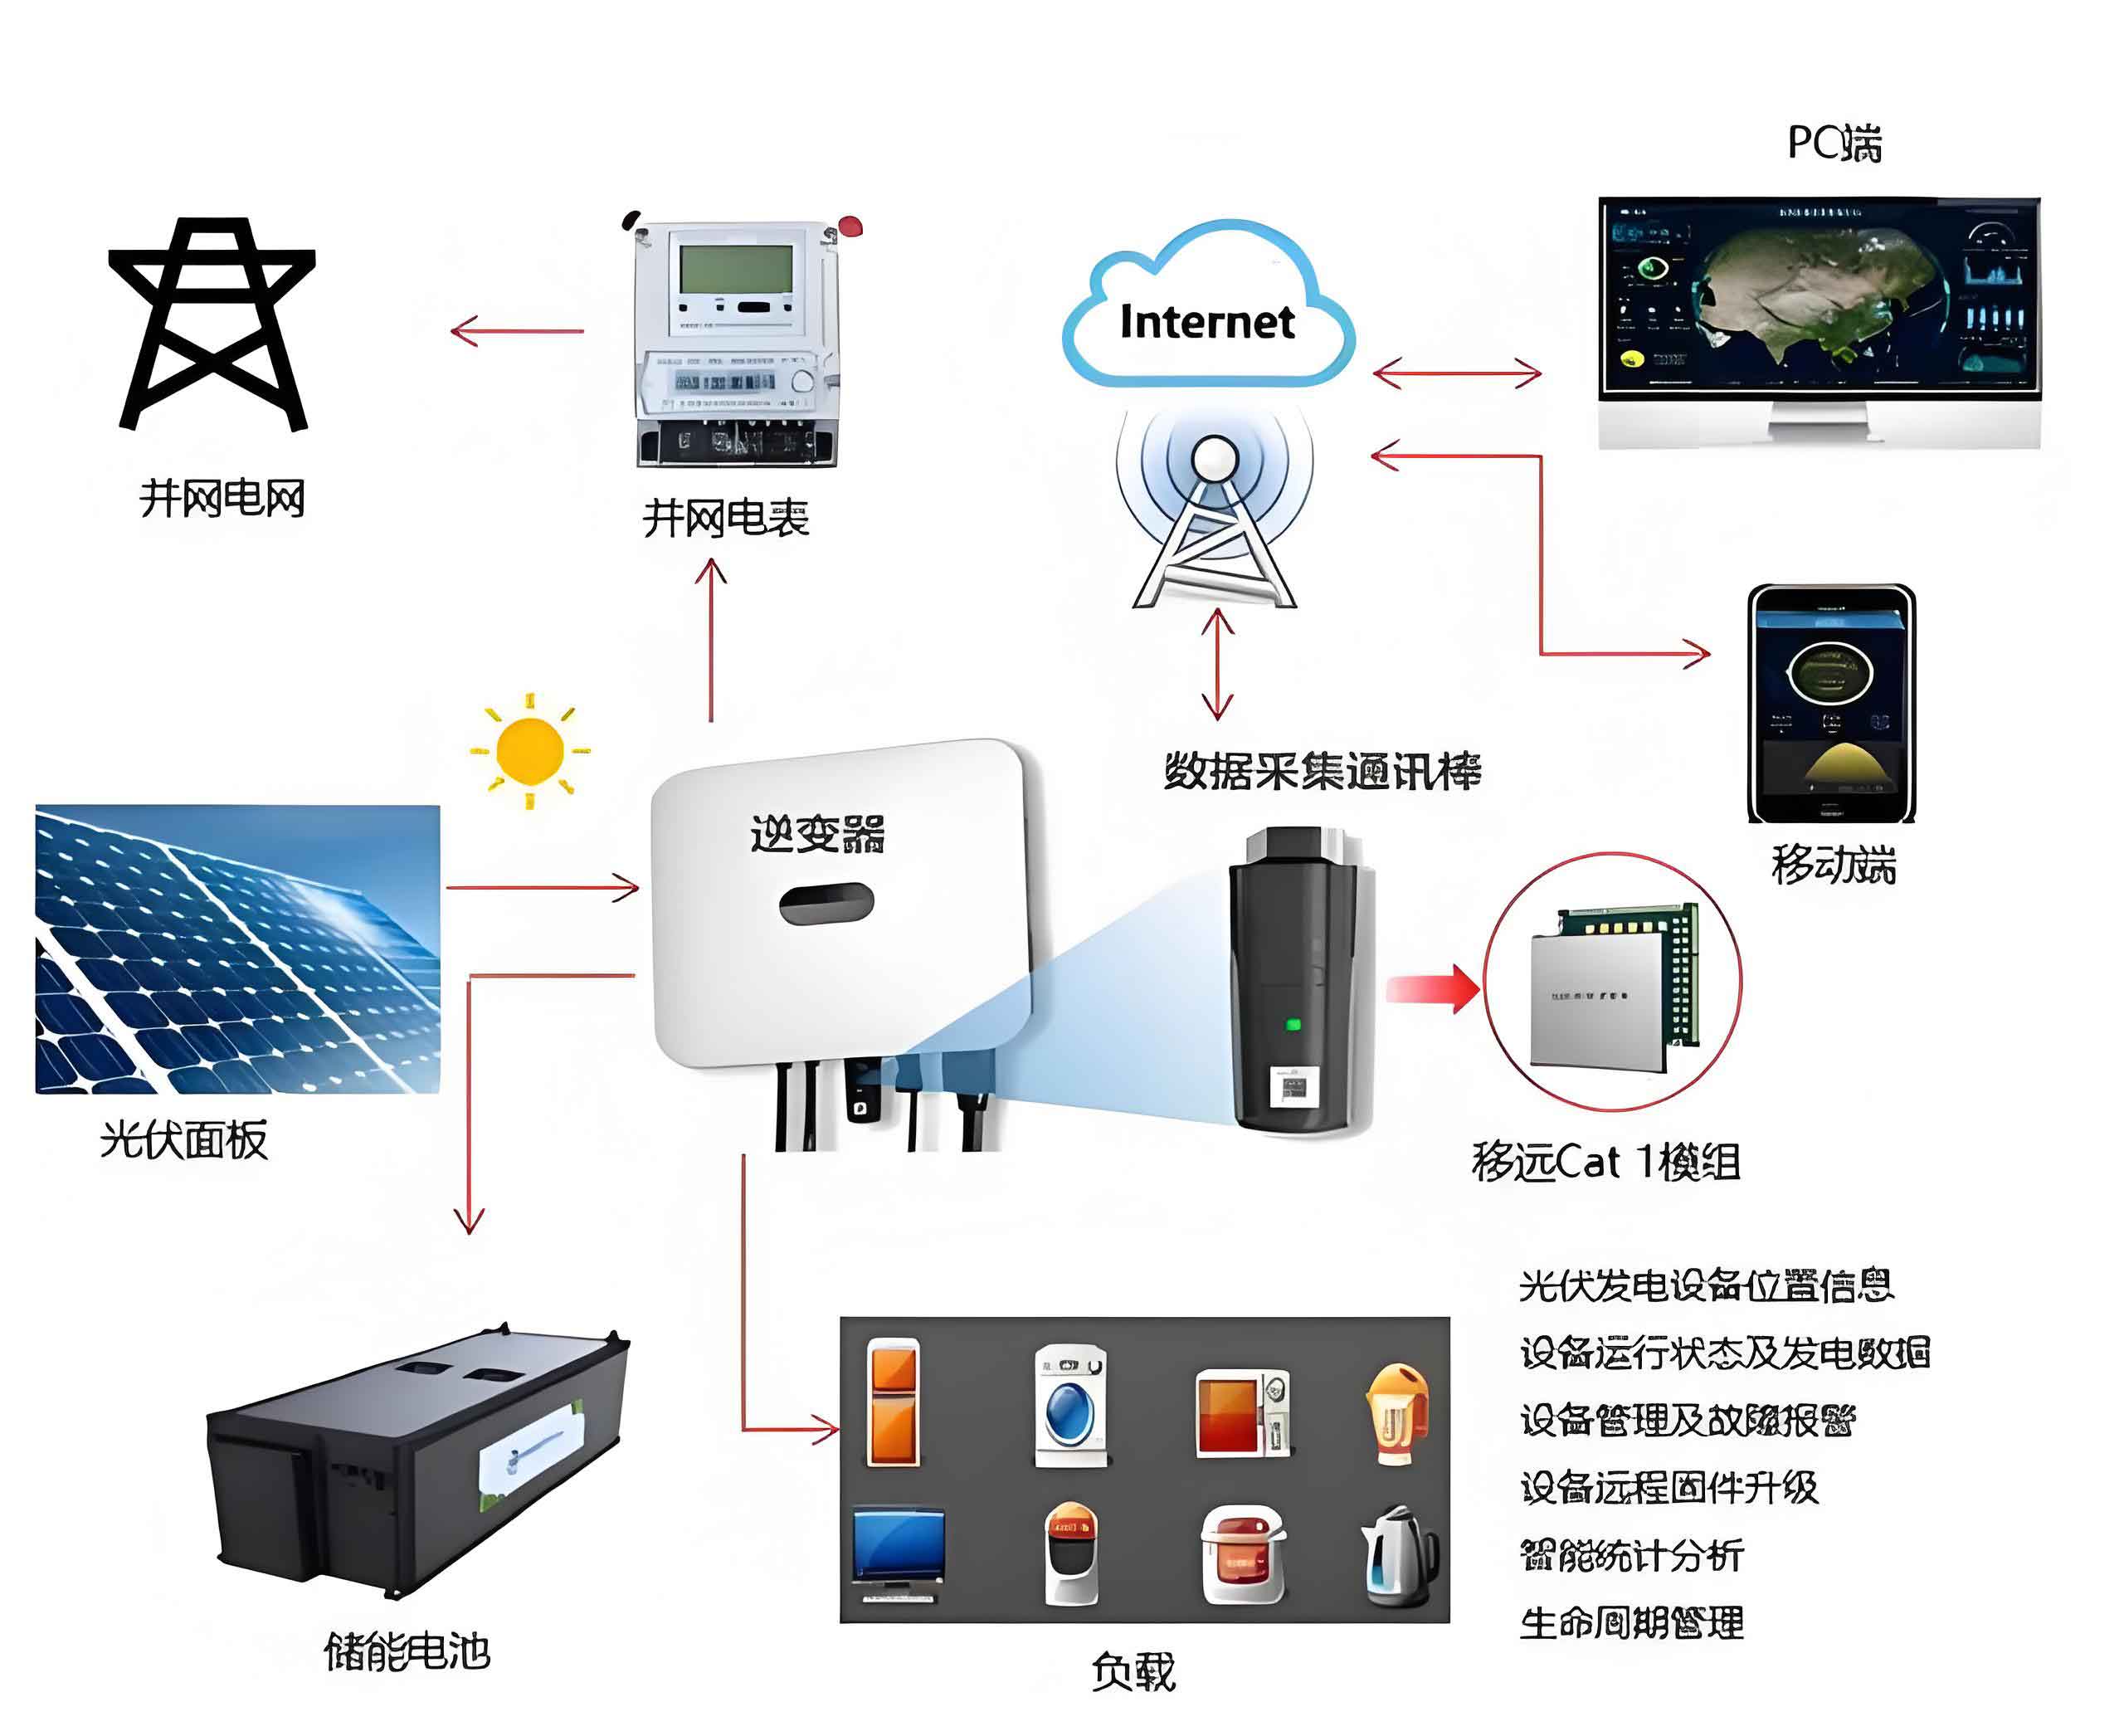
The overall configuration of the solar-powered irrigation system involves multiple components working in harmony. The solar panels convert sunlight into electricity, which powers a dedicated solar pump to lift water from a source to an elevated storage tank. From there, water flows by gravity to a drip irrigation network, ensuring efficient water delivery to crops. This setup minimizes energy losses and maximizes water use efficiency. A schematic representation of such a solar system is often useful for understanding its components and flow. Below is an image that illustrates a typical solar-powered irrigation setup, highlighting the integration of photovoltaic panels, pumps, and storage.
The benefits of using a solar system for irrigation are evident from the experimental results on dragon fruit cultivation. Compared to the non-irrigated control plot, the solar-irrigated area showed a 15.4% increase in seedling emergence rate, a 20.4% enhancement in growth rate, a 25.4% rise in fruit number per plant, and a 40.5% boost in yield per unit area. These improvements translate to economic gains; for example, with an estimated yield increase of over 1,000 kg per acre, farmers can achieve significant additional income. The solar system thus not only supports sustainable water management but also drives agricultural productivity.
To further analyze the economic viability of the solar system, consider the cost-benefit ratio. The initial investment includes solar panels, pumps, storage infrastructure, and installation. However, operating costs are minimal since sunlight is free, and maintenance requirements are low. The payback period can be estimated using the formula:
$$ T = \frac{C}{\Delta R} $$
where \( T \) is the payback period (in years), \( C \) is the initial cost (in monetary units), and \( \Delta R \) is the annual additional revenue from increased crop yield (in monetary units per year). Assuming an initial cost of $10,000 and an annual revenue increase of $2,000 per acre from dragon fruit, the payback period is:
$$ T = \frac{10000}{2000} = 5 \, \text{years} $$
This demonstrates that solar systems can be economically attractive in the long run, especially in regions with high solar insolation.
In terms of environmental impact, the solar system reduces reliance on fossil fuels and grid electricity, thereby lowering carbon emissions. The carbon savings \( S_{CO2} \) (in kg CO₂ per year) can be calculated as:
$$ S_{CO2} = E_{solar} \cdot EF_{grid} $$
where \( E_{solar} \) is the annual energy generated by the solar system (in kWh), and \( EF_{grid} \) is the emission factor of the local grid (in kg CO₂/kWh). For the studied system, with \( E_{solar} = 9 \, \text{kWh/day} \times 365 \approx 3285 \, \text{kWh/year} \) and \( EF_{grid} = 0.8 \, \text{kg CO}_2/\text{kWh} \), the annual carbon savings are:
$$ S_{CO2} = 3285 \times 0.8 = 2628 \, \text{kg CO}_2 \approx 2.6 \, \text{tons} $$
This contribution to climate change mitigation underscores the broader benefits of adopting solar systems in agriculture.
Looking ahead, the potential for scaling up solar-powered irrigation in rocky mountain areas is substantial. Advances in photovoltaic technology, such as higher efficiency panels and reduced costs, will further enhance the feasibility of solar systems. Moreover, smart control systems can be integrated to optimize water and energy use based on real-time weather data and crop requirements. For instance, automated scheduling of irrigation based on soil moisture sensors can maximize water efficiency while leveraging the solar system’s output. The formula for optimal irrigation timing \( t_{opt} \) (in hours) might consider solar radiation \( G \) and crop water demand \( D \) (in mm/day):
$$ t_{opt} = \frac{D \cdot A_{field}}{q \cdot \eta_{irr}} $$
where \( A_{field} \) is the field area (in hectares), \( q \) is the pump flow rate (in m³/h), and \( \eta_{irr} \) is the irrigation efficiency (dimensionless). By aligning \( t_{opt} \) with periods of high solar output, the solar system can operate at peak efficiency.
In conclusion, the application of solar systems in irrigation projects for rocky mountain areas offers a sustainable and effective solution to water scarcity and energy access challenges. Through careful design that integrates photovoltaic generation, water storage, and efficient irrigation methods, these systems can significantly improve agricultural outcomes while conserving resources. The experimental data presented here validate the technical and economic viability of solar-powered irrigation, with notable benefits in crop yield and environmental sustainability. As solar technology continues to evolve, the adoption of such systems is poised to expand, contributing to resilient agricultural practices in remote regions. Future research should focus on optimizing system components and developing tailored models for different agro-climatic zones, ensuring that solar systems remain at the forefront of innovative irrigation solutions.