
As environmental concerns become increasingly prominent, the development of renewable energy has become a global consensus. Wind and solar energy, as the main forces of clean energy, are continuously increasing their share in the energy structure. However, the intermittency and volatility of wind and solar energy pose significant challenges to the safe and stable operation of power grids. The complementary power generation system combining wind and solar photovoltaic resources, through rational configuration of these two energy sources, can effectively smooth power fluctuations and improve generation stability. In this study, we explore the integration methods and optimization strategies for wind-solar complementary systems, focusing on key issues such as system configuration optimization, operational control, and economic evaluation, to provide theoretical basis and technical support for large-scale renewable energy grid integration.
We begin by analyzing the power generation characteristics of wind and solar resources, which is fundamental to designing complementary systems. Based on statistical analysis of annual wind speed and solar radiation data from a specific region, we find that wind energy resources exhibit seasonal variations, with higher wind speeds in winter and spring, and lower in summer and autumn. Wind power generation is proportional to the cube of wind speed, leading to significant fluctuations in output. The solar system, on the other hand, shows distinct diurnal and seasonal patterns, with longer daylight hours and higher radiation intensity in summer, and weaker in winter. The efficiency of the solar system is affected by temperature, where increases cause efficiency drops. Comparing the temporal distribution characteristics of wind and solar energy, we observe complementarity in both daily and annual cycles. This complementarity enables the design of efficient and stable power generation systems by rationally configuring the capacity ratio of the two energy sources to achieve smoothed power output.
To model the complementary system, we construct sub-models for wind power, photovoltaic power, and energy storage, followed by an integrated system model. The wind power subsystem model is based on wind speed data and turbine characteristics. We use the Weibull distribution to fit the probability distribution of wind speed, accurately describing its statistical properties. The relationship between turbine output power and wind speed is represented by a piecewise function, including key parameters such as cut-in speed, rated speed, and cut-out speed. The power curve is fitted using the least squares method, yielding a mathematical expression. Considering the randomness of wind speed, we introduce Monte Carlo simulation to predict wind farm generation. This model accurately reflects the dynamic characteristics of wind power systems. For the solar system, the subsystem model综合考虑太阳辐射强度、环境温度和光伏组件特性, establishing a statistical model for solar radiation intensity to describe its temporal variation. The output characteristics of photovoltaic modules are represented by the I-V curve, considering temperature effects on efficiency. We use a single-diode equivalent circuit model, solving nonlinear equations to calculate output power. The model also includes shading effects and dust pollution factors for photovoltaic arrays, introducing correction coefficients to improve prediction accuracy. This solar system model accurately reflects generation characteristics under various environmental conditions.
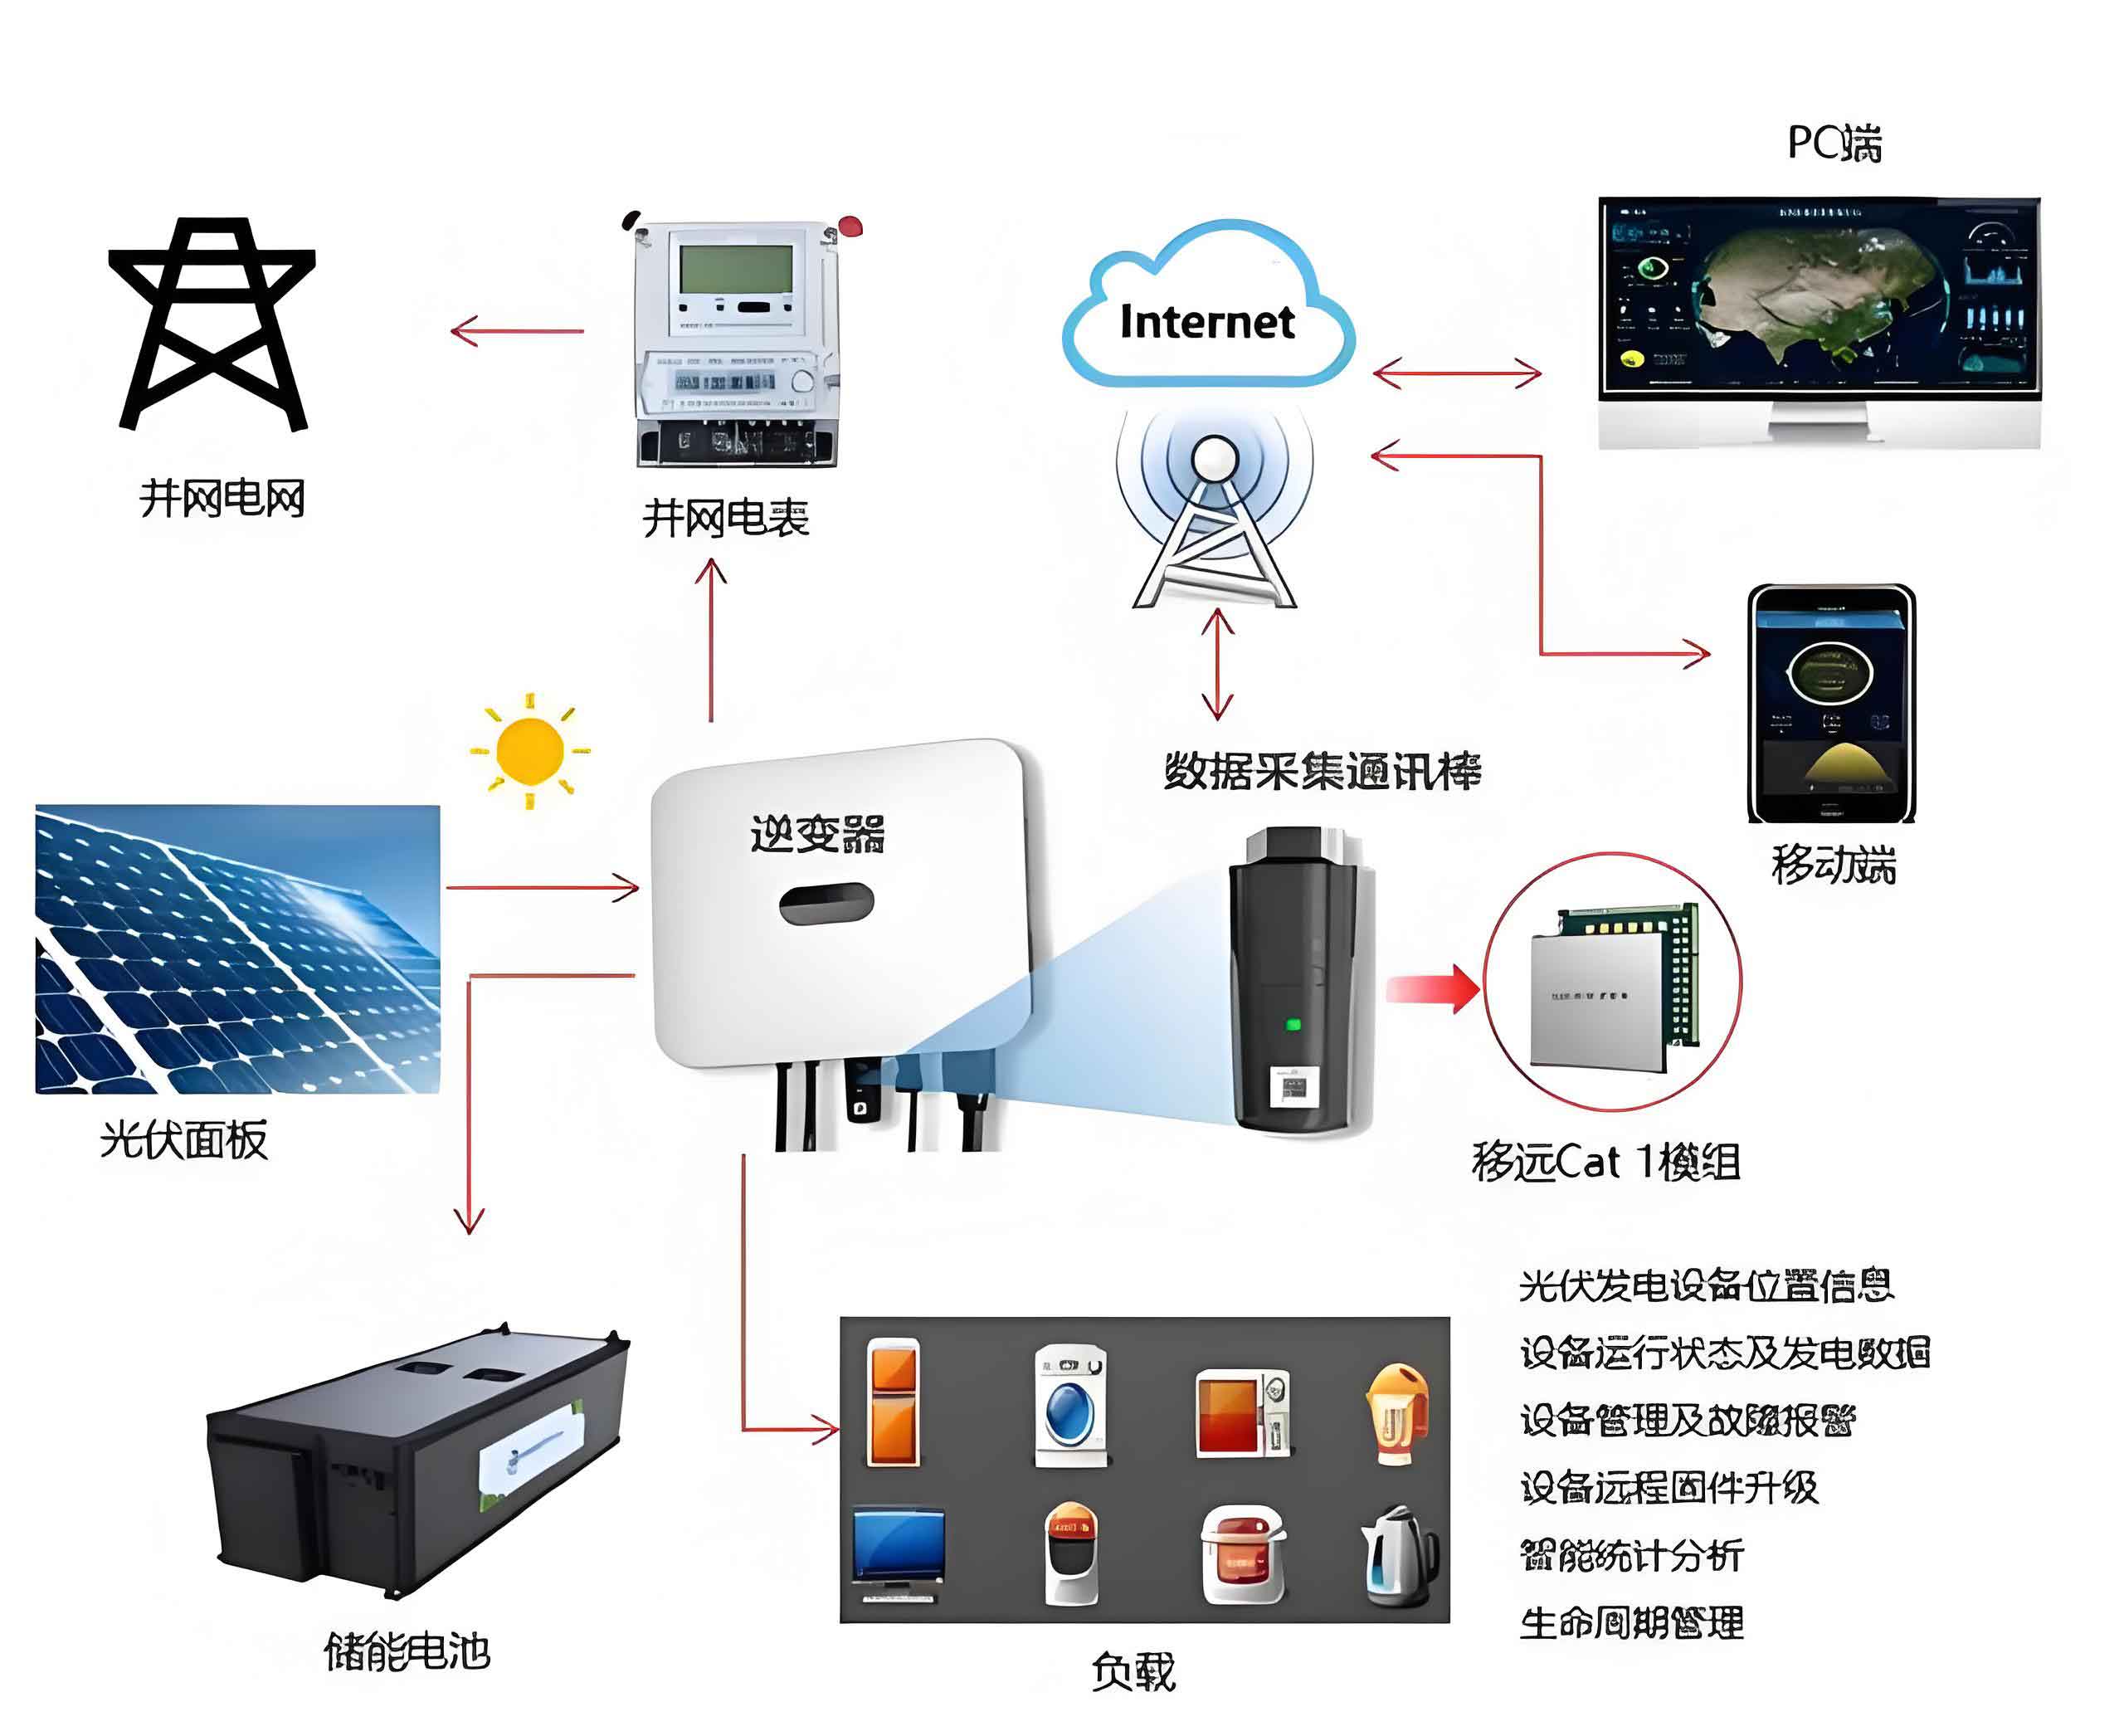
The energy storage system model is primarily based on lithium-ion battery characteristics. We develop a dynamic model for the state of charge (SOC) to describe charging and discharging processes. Considering self-discharge characteristics and charge-discharge efficiency, we introduce a temperature correction factor to reflect environmental impacts. The battery lifespan model combines cycle count and depth of discharge to predict capacity degradation. This model accurately simulates battery performance under different operating conditions. The integrated system model combines wind power, photovoltaic power, and energy storage organically. We use the equivalent load method to handle load fluctuations and establish system power balance equations. Reliability indicators such as Loss of Load Probability (LOLP) and Expected Energy Not Served (EENS) are introduced to evaluate system performance. Through time-series simulation, we calculate the system’s operational state at different time scales. The model considers interactions between subsystems, such as shading effects of wind turbines on photovoltaic panels. This integrated model provides a robust tool for optimization design and operational strategy formulation.
For optimization, we employ a multi-objective approach considering economic, reliability, and environmental factors. The economic objective minimizes total system cost, including initial investment, operation and maintenance, and replacement costs. The reliability objective maximizes power supply reliability by minimizing LOLP. The environmental objective maximizes carbon emission reduction. Constraints include power balance, energy storage capacity, and equipment operational limits. To solve this, we apply the Particle Swarm Optimization (PSO) algorithm, which simulates bird flock foraging behavior to search for optimal solutions in the solution space. Each particle represents a potential system configuration, including decision variables like wind turbine capacity, photovoltaic capacity, and storage capacity. Particle positions and velocities are updated iteratively toward the global optimum. We enhance algorithm performance with strategies like linear decreasing inertia weight and adaptive mutation to avoid local optima. The optimization problem is complex, so we use hierarchical encoding to handle continuous and discrete variables separately.
Experimental design is based on actual meteorological and load data from a specific region, analyzing typical days over a year. Meteorological data includes hourly wind speed, solar radiation intensity, and ambient temperature. Load data follows typical industrial park consumption patterns, considering seasonal and diurnal variations. Equipment parameters are derived from mainstream market models, with performance data from manufacturer tests. The solar system components are selected based on standard photovoltaic modules. For the PSO algorithm, parameters are set as follows: population size of 50, maximum iterations of 1000, inertia weight linearly decreasing from 0.9 to 0.4, and learning factors c1 and c2 both set to 2. To ensure reliability, each configuration is run 30 times, with averages taken as final results.
System performance evaluation encompasses technical, economic, and environmental aspects. Technical indicators include system reliability, energy utilization rate, and power smoothness. Reliability is measured by Reliability of Supply Capacity Index (RSCI) and Loss of Power Supply Probability (LPSP). Energy utilization rate reflects renewable energy efficiency, and power smoothness assesses output stability. Economic indicators include Levelized Cost of Electricity (LCOE), Net Present Value (NPV), and Payback Period (PBP). Environmental indicators focus on carbon emission reduction compared to fossil fuel generation. We also introduce a comprehensive performance index, System Comprehensive Benefit Index (SCBI), weighting technical, economic, and environmental factors. Below is a table summarizing key performance indicators from our optimization results.
| Category | Indicator Name | Symbol | Unit | Value |
|---|---|---|---|---|
| Technical | Reliability of Supply Capacity Index | RSCI | % | 99.2 |
| Technical | Loss of Power Supply Probability | LPSP | % | 0.8 |
| Technical | Energy Utilization Factor | EUF | % | 87.5 |
| Technical | Power Smoothness | PS | — | 0.85 |
| Economic | Levelized Cost of Electricity | LCOE | USD/kWh | 0.45 |
| Economic | Net Present Value | NPV | thousand USD | 1200 |
| Economic | Payback Period | PBP | years | 7.5 |
| Environmental | Carbon Emission Reduction | CER | tons/year | 3500 |
| Comprehensive | System Comprehensive Benefit Index | SCBI | — | 0.92 |
Optimization results demonstrate significant advantages of the wind-solar complementary system over single-source systems. In the baseline scenario, the optimal configuration includes wind capacity of 2 MW, photovoltaic capacity of 1.5 MW, and storage capacity of 500 kWh. This configuration reduces LPSP to below 1%, and LCOE is lowered by 15% compared to single wind or solar systems. Sensitivity analysis shows that equipment costs have the greatest impact on optimization results; a 10% cost decrease can reduce LCOE by approximately 8%. Load characteristic variations significantly affect storage capacity配置; increased peak-valley differences lead to higher required storage capacity. Optimization results vary by region: areas rich in wind resources favor larger wind proportions, while sunny regions increase solar system shares. Multi-objective optimization yields a Pareto front, allowing decision-makers to权衡 economic and reliability trade-offs. Incorporating carbon trading mechanisms further enhances economic performance, reducing LCOE by 5–10%. Long-term simulations verify system stability, with performance degradation controlled within design expectations over a 20-year operation period. Below is a comparison table of different configuration schemes.
| Configuration Scheme | Wind Capacity (MW) | Solar Capacity (MW) | Storage Capacity (kWh) | LPSP (%) | LCOE (USD/kWh) | Carbon Reduction (tons/year) | SCBI |
|---|---|---|---|---|---|---|---|
| Optimized Scheme | 2.0 | 1.5 | 500 | 0.8 | 0.45 | 3500 | 0.92 |
| Wind-Only | 3.5 | 0 | 300 | 2.5 | 0.53 | 2800 | 0.78 |
| Solar-Only | 0 | 3.0 | 700 | 3.2 | 0.58 | 2200 | 0.75 |
| No Storage | 2.5 | 1.0 | 0 | 5.6 | 0.42 | 3100 | 0.70 |
To mathematically represent the models, we formulate key equations. For wind power, the output power \( P_w \) as a function of wind speed \( v \) is given by:
$$ P_w(v) =
\begin{cases}
0 & \text{if } v < v_{ci} \text{ or } v > v_{co} \\
\frac{1}{2} \rho A C_p v^3 & \text{if } v_{ci} \leq v < v_r \\
P_r & \text{if } v_r \leq v \leq v_{co}
\end{cases} $$
where \( \rho \) is air density, \( A \) is swept area, \( C_p \) is power coefficient, \( v_{ci} \) is cut-in speed, \( v_r \) is rated speed, \( v_{co} \) is cut-out speed, and \( P_r \) is rated power. For the solar system, the photovoltaic output power \( P_{pv} \) is calculated using the single-diode model:
$$ I = I_{ph} – I_0 \left( \exp\left(\frac{V + I R_s}{a V_t}\right) – 1 \right) – \frac{V + I R_s}{R_{sh}} $$
where \( I \) is current, \( V \) is voltage, \( I_{ph} \) is photocurrent, \( I_0 \) is diode saturation current, \( R_s \) is series resistance, \( R_{sh} \) is shunt resistance, \( a \) is ideality factor, and \( V_t \) is thermal voltage. The energy storage system SOC dynamics are modeled as:
$$ \text{SOC}(t+1) = \text{SOC}(t) + \frac{\eta_c P_c(t) \Delta t}{C} – \frac{P_d(t) \Delta t}{\eta_d C} $$
where \( \eta_c \) and \( \eta_d \) are charge and discharge efficiencies, \( P_c \) and \( P_d \) are charge and discharge powers, \( \Delta t \) is time step, and \( C \) is capacity. The integrated system power balance equation is:
$$ P_w(t) + P_{pv}(t) + P_{dis}(t) – P_{ch}(t) = P_{load}(t) + P_{grid}(t) $$
where \( P_{dis} \) and \( P_{ch} \) are discharge and charge powers, \( P_{load} \) is load demand, and \( P_{grid} \) is grid exchange power. Optimization objective functions include minimizing total cost:
$$ \text{Minimize } C_{total} = C_{inv} + \sum_{t=1}^{T} C_{om}(t) + C_{rep} $$
and maximizing reliability by minimizing LOLP:
$$ \text{Minimize } \text{LOLP} = \frac{\sum_{t=1}^{T} \delta(t)}{T} $$
where \( \delta(t) = 1 \) if load is not met at time \( t \), else 0. The PSO algorithm updates particle positions \( x_i \) and velocities \( v_i \) as:
$$ v_i^{k+1} = w v_i^k + c_1 r_1 (pbest_i – x_i^k) + c_2 r_2 (gbest – x_i^k) $$
$$ x_i^{k+1} = x_i^k + v_i^{k+1} $$
where \( w \) is inertia weight, \( c_1 \) and \( c_2 \) are learning factors, \( r_1 \) and \( r_2 \) are random numbers, \( pbest_i \) is personal best, and \( gbest \) is global best.
In conclusion, the integration and optimization of wind-solar complementary power generation systems provide an effective solution to the intermittency issues of renewable energy. By establishing mathematical models and applying the PSO algorithm for optimization, we achieve significant improvements in system performance. Experimental results validate the feasibility and effectiveness of this approach. However, large-scale application of wind-solar complementary systems still faces challenges such as weather prediction accuracy and energy storage technology levels. Future research should focus on enhancing system intelligence, improving adaptability to complex weather conditions, and further boosting economic and reliability aspects. This will contribute to building a clean, efficient, and secure modern energy体系. Throughout this study, the solar system plays a crucial role in balancing energy output, and optimizing its integration with wind resources is key to achieving stable power generation. The complementary nature of these resources, especially when combined with advanced storage solutions, underscores the potential of such systems in global energy transitions. We emphasize that continuous innovation in solar system technologies, along with better forecasting models, will drive further advancements in renewable energy integration.