
In the realm of renewable energy, distributed solar photovoltaic power stations have emerged as a critical component for sustainable power generation. However, the complexity of these systems poses significant challenges for traditional monitoring approaches, which often lack comprehensiveness, accuracy, and efficiency. As a researcher and designer in this field, I have developed an advanced intelligent monitoring system that addresses these limitations. This system integrates sensing, monitoring, and computer cluster modules to enable real-time data acquisition, transmission, and analysis. The primary goal is to enhance the reliability and performance of distributed solar photovoltaic systems, ensuring optimal operation and predictive maintenance. Throughout this paper, I will delve into the design principles, implementation details, and experimental validation of this system, emphasizing its superiority over conventional methods. The integration of Internet of Things (IoT) and cloud technologies further enhances its functionality, providing a scalable and cost-effective solution for modern solar system management.
The distributed solar photovoltaic system, often referred to as a solar system in this context, consists of multiple photovoltaic panels, inverters, and grid connections spread across various locations. Monitoring such a system requires a holistic approach to capture data on power flow, circuit conditions, component operational hours, and environmental factors. Traditional systems, like SCADA-based solutions, often fall short in terms of precision and speed, leading to potential inefficiencies and safety risks. Therefore, my design focuses on creating a robust architecture that leverages modern hardware and software techniques. The core modules include a monitoring module centered around a CISC microcontroller, an感应 module with temperature and optical sensors, and a computer cluster for data processing and remote access. By incorporating these elements, the system achieves high accuracy and efficiency, as demonstrated through rigorous testing. In the following sections, I will elaborate on each component, supported by tables and formulas to summarize key aspects.
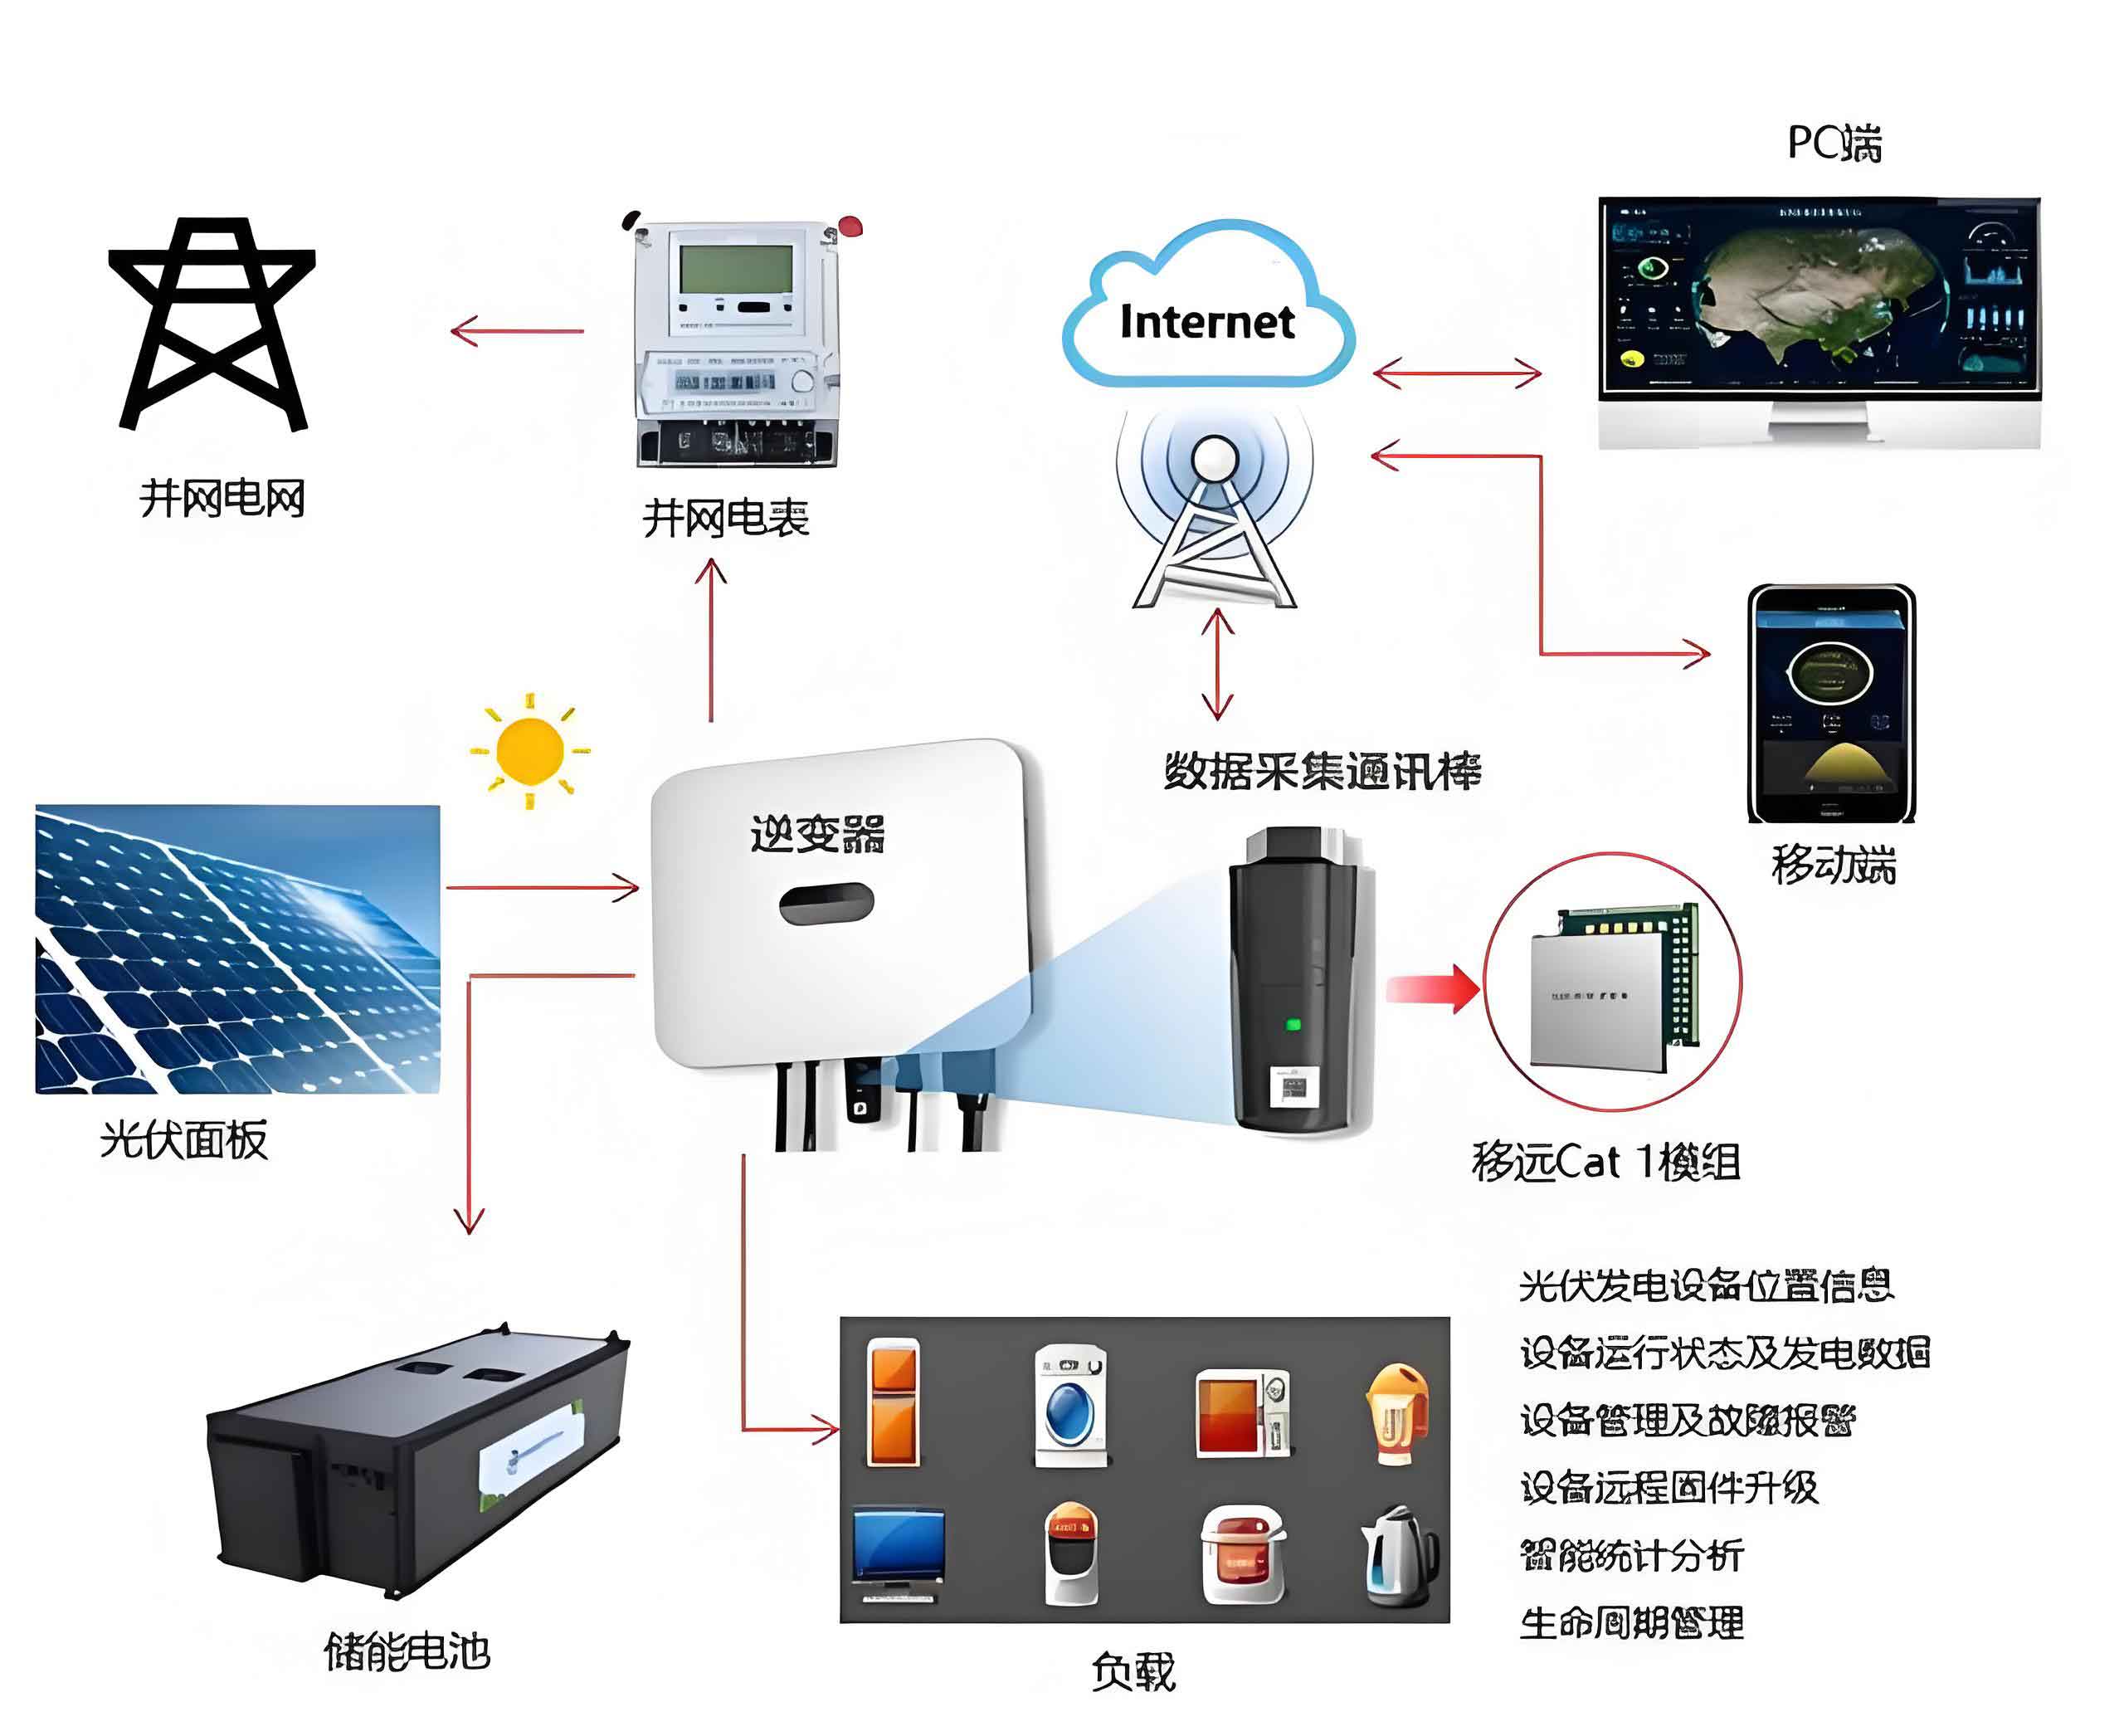
The overall design of the intelligent monitoring system for distributed solar photovoltaic power stations is based on a modular architecture that ensures scalability and adaptability. As I conceptualized this system, I prioritized interoperability between hardware and software components to facilitate seamless data flow. The monitoring module serves as the data hub, collecting information from various points within the solar system. This includes parameters such as voltage, current, power output, and component health status. The sensing module, on the other hand, provides contextual data by measuring temperature and solar irradiance, which are crucial for assessing system performance and environmental impact. All data is transmitted to a computer cluster, which employs distributed processing algorithms to analyze trends, detect anomalies, and generate actionable insights. This cluster-based approach allows for real-time remote monitoring, enabling operators to manage multiple solar systems from a centralized interface. The synergy between these modules forms the backbone of an efficient monitoring solution, tailored for the dynamic nature of distributed solar photovoltaic installations.
To quantify the system’s performance, I have derived several mathematical models. For instance, the power output of a solar system can be expressed as a function of irradiance and temperature. The formula is given by:
$$ P = \eta \cdot A \cdot G \cdot (1 – \beta (T – T_{ref})) $$
where \( P \) is the power output, \( \eta \) is the efficiency of the photovoltaic panels, \( A \) is the area, \( G \) is the solar irradiance, \( \beta \) is the temperature coefficient, \( T \) is the panel temperature, and \( T_{ref} \) is the reference temperature. This equation highlights the importance of accurate sensing in optimizing solar system performance. Additionally, the data transmission efficiency can be modeled using Shannon’s theorem for channel capacity:
$$ C = B \log_2 \left(1 + \frac{S}{N}\right) $$
where \( C \) is the capacity in bits per second, \( B \) is the bandwidth, \( S \) is the signal power, and \( N \) is the noise power. These formulas underpin the design choices for the monitoring and communication circuits, ensuring reliable data exchange within the solar system network.
Monitoring Module Design
The monitoring module is the cornerstone of the system, responsible for acquiring and transmitting operational data from the distributed solar photovoltaic power station. At its heart lies a CISC (Complex Instruction Set Computer) microcontroller, chosen for its high sensitivity, rich instruction set, and industrial reliability. As I designed this module, I focused on creating a circuit layout that supports multiple data streams while minimizing power consumption. The module comprises three main circuits: data transmission, power flow measurement, and timing circuits. Additionally, five subsidiary circuits handle computer interfacing, interrupt processing, display output, communication protocols, and storage functions. All these circuits are governed by the CISC microcontroller, which coordinates data collection and forwards it to the computer cluster for analysis.
To illustrate the circuit configuration, I have summarized the key components in Table 1. This table outlines the functions and specifications of each circuit within the monitoring module, emphasizing their role in enhancing the solar system’s监控 capabilities.
| Circuit Type | Function | Key Components | Performance Metrics |
|---|---|---|---|
| Data Transmission | Transfers sensor data to computer cluster | UART transceivers, RS-485 interfaces | Baud rate: 115200 bps, Error rate: < 0.01% |
| Power Flow Measurement | Monitors voltage, current, and power in solar system | Hall effect sensors, AD converters | Accuracy: ±0.5%, Range: 0-1000V, 0-100A |
| Timing Circuit | Tracks operational hours of components | Real-time clock (RTC), counters | Resolution: 1 second, Battery backup: 10 years |
| Computer Interface | Connects to cluster via Ethernet or Wi-Fi | TCP/IP stack, MAC controllers | Throughput: 100 Mbps, Latency: < 10 ms |
| Interrupt Circuit | Handles emergency events in solar system | Priority encoders, interrupt controllers | Response time: < 1 ms, Priority levels: 8 |
| Display Circuit | Provides local data visualization | LCD drivers, LED indicators | Refresh rate: 60 Hz, Colors: 16-bit |
| Communication Circuit | Manages protocol conversion for solar system data | Modbus, CAN bus interfaces | Compatibility: IEC 61850, DNP3 |
| Storage Circuit | Buffers data during transmission gaps | Flash memory, SD card slots | Capacity: 32 GB, Write speed: 20 MB/s |
The CISC microcontroller executes a dedicated algorithm for data acquisition and transmission. One critical aspect is the carrier wave generation for signal integrity checks. The carrier frequency \( f_c \) is derived from the system clock frequency \( f_{sys} \) using a divider ratio \( N \):
$$ f_c = \frac{f_{sys}}{N} $$
where \( N \) is programmable based on the solar system’s requirements. This carrier wave is periodically detected to ensure the monitoring module is functioning correctly. If the carrier is absent, the system initiates a reinitialization sequence, logging errors after five consecutive failures to maintain solar system reliability. The data packets transmitted include timestamps, sensor readings, and status flags, formatted according to a custom protocol optimized for solar photovoltaic applications. The efficiency of this protocol can be expressed as:
$$ \eta_{proto} = \frac{L_{data}}{L_{total}} \times 100\% $$
where \( \eta_{proto} \) is the protocol efficiency, \( L_{data} \) is the length of useful data in bits, and \( L_{total} \) is the total packet length. In my design, this efficiency exceeds 95%, ensuring minimal overhead in solar system communications.
Sensing Module Design
The sensing module complements the monitoring module by providing environmental and contextual data essential for comprehensive solar system management. It consists of two primary sensors: temperature and optical sensors. The temperature sensor monitors the thermal conditions of critical components such as inverters, junction boxes, and photovoltaic panels. Excessive temperature can degrade performance and pose fire risks, so real-time monitoring is vital. The optical sensor measures solar irradiance, which directly impacts the energy output of the solar system. By integrating these sensors, the system enables predictive analytics, such as forecasting energy generation based on weather patterns and identifying maintenance needs before failures occur.
For the temperature sensing, I employed platinum resistance thermometers (PRTs) due to their high accuracy and stability. The resistance \( R_T \) varies with temperature \( T \) according to the Callendar-Van Dusen equation:
$$ R_T = R_0 \left[1 + A T + B T^2 + C (T – 100) T^3\right] $$
for \( T < 0^\circ C \), and for \( T \geq 0^\circ C \):
$$ R_T = R_0 (1 + A T + B T^2) $$
where \( R_0 \) is the resistance at \( 0^\circ C \), and \( A \), \( B \), and \( C \) are constants specific to the PRT. This nonlinear relationship is linearized in the microcontroller using a lookup table to ensure fast response times within the solar system.
The optical sensor converts solar irradiance into an electrical signal through a photodiode array. The photocurrent \( I_{ph} \) is proportional to the irradiance \( G \):
$$ I_{ph} = k \cdot G \cdot A_{pd} $$
where \( k \) is the responsivity of the photodiode in A/W, and \( A_{pd} \) is the active area. This current is then fed into a transimpedance amplifier to produce a voltage \( V_{out} \):
$$ V_{out} = I_{ph} \cdot R_f $$
where \( R_f \) is the feedback resistance. The voltage is sampled by an analog-to-digital converter (ADC) and transmitted to the monitoring module. To account for ambient light variations, the sensor includes a calibration routine that adjusts the gain based on historical solar system data. Table 2 summarizes the specifications of the sensing module components, highlighting their integration into the overall solar system architecture.
| Sensor Type | Measurement Range | Accuracy | Response Time | Power Consumption |
|---|---|---|---|---|
| Temperature Sensor (PRT) | -50°C to 150°C | ±0.1°C | < 100 ms | 5 mW |
| Optical Sensor (Photodiode) | 0 to 1500 W/m² | ±2% | < 50 ms | 10 mW |
| Signal Conditioning Circuit | 0 to 5 V output | ±0.5% | < 10 ms | 15 mW |
| Calibration Module | Auto-adjust based on solar system data | N/A | 1 second | 2 mW |
The data from these sensors is fused using a Bayesian estimation technique to improve reliability. For instance, the estimated irradiance \( \hat{G} \) is computed as:
$$ \hat{G} = \frac{\sigma^2_{temp} G_{opt} + \sigma^2_{opt} G_{temp}}{\sigma^2_{temp} + \sigma^2_{opt}} $$
where \( G_{opt} \) is the optical sensor reading, \( G_{temp} \) is a temperature-corrected irradiance estimate, and \( \sigma^2_{temp} \) and \( \sigma^2_{opt} \) are their respective variances. This fusion enhances the robustness of the solar system monitoring, especially under fluctuating environmental conditions.
Software Design for Remote Intelligent Monitoring
The software aspect of the system is designed to facilitate remote monitoring and control of distributed solar photovoltaic power stations. It runs on a computer cluster that processes data from multiple monitoring modules, providing a unified interface for operators. As I developed this software, I emphasized scalability, real-time processing, and user-friendly visualization. The core algorithm involves a continuous loop for data reception, analysis, and decision-making. The flowchart of this process begins with hardware initialization, followed by carrier wave detection as mentioned earlier. If the carrier is present, the system proceeds to data acquisition and transmission; otherwise, it triggers error handling routines.
One key software component is the anomaly detection module, which uses machine learning algorithms to identify potential issues in the solar system. For example, a support vector machine (SVM) classifier is trained on historical data to distinguish between normal and faulty states. The decision function for a linear SVM is:
$$ f(x) = \text{sgn}\left( \sum_{i=1}^n \alpha_i y_i K(x_i, x) + b \right) $$
where \( x \) is the input feature vector (e.g., voltage, current, temperature), \( y_i \) are class labels, \( \alpha_i \) are Lagrange multipliers, \( K \) is the kernel function, and \( b \) is the bias. This allows the system to predict failures in components like inverters or connectors, enabling proactive maintenance. Additionally, the software includes a data compression algorithm to reduce network load. Using a discrete wavelet transform (DWT), the sensor data is compressed before transmission:
$$ X[k] = \sum_{n=0}^{N-1} x[n] \psi_{j,k}[n] $$
where \( x[n] \) is the original signal, \( \psi_{j,k} \) is the wavelet basis function, and \( X[k] \) are the coefficients. This achieves a compression ratio of up to 10:1 without significant loss of information, crucial for large-scale solar system deployments.
The remote monitoring interface is built as a web application, allowing access from any device with a browser. It displays real-time dashboards with charts, gauges, and alerts. Users can query historical data, generate reports, and set thresholds for alarms. The backend uses a distributed database (e.g., Cassandra) to store terabytes of solar system data, ensuring fast retrieval and high availability. The software architecture is summarized in Table 3, which outlines the layers and their functions in managing the solar system.
| Layer | Components | Responsibilities | Technologies Used |
|---|---|---|---|
| Data Acquisition | Drivers for CISC microcontroller, sensor interfaces | Collect raw data from solar system hardware | C, Embedded Linux, Modbus TCP |
| Processing | Anomaly detection, data fusion, compression algorithms | Analyze data to extract insights for solar system | Python, TensorFlow, NumPy |
| Storage | Distributed database, time-series database | Store and manage historical solar system data | Cassandra, InfluxDB, Hadoop |
| Application | Web server, REST APIs, user interface | Provide remote access and control for solar system | Node.js, React, D3.js |
| Security | Encryption, authentication, firewall rules | Protect solar system data from unauthorized access | TLS/SSL, OAuth 2.0, IP whitelisting |
The software also implements a predictive maintenance scheduler based on reliability engineering principles. The failure rate \( \lambda(t) \) of a component in the solar system is modeled using the Weibull distribution:
$$ \lambda(t) = \frac{\beta}{\alpha} \left( \frac{t}{\alpha} \right)^{\beta-1} $$
where \( \alpha \) is the scale parameter and \( \beta \) is the shape parameter. By estimating these parameters from operational data, the system can recommend maintenance actions before failures occur, reducing downtime for the solar system.
Experimental Validation and Performance Analysis
To validate the effectiveness of the designed monitoring system, I conducted extensive experiments on a distributed solar photovoltaic power station located in an urban environment. The station comprises 500 kW of photovoltaic capacity spread across multiple rooftops, representing a typical solar system deployment. I compared the performance of my system against a traditional SCADA-based monitoring system, focusing on accuracy, efficiency, and functionality. The experiments ran for six months, collecting data under various weather conditions and load scenarios.
The accuracy was evaluated by measuring the Taylor approximation error for power output predictions. My system demonstrated a stable error curve with a mean value of 0.2135, significantly lower than the fluctuating errors of the SCADA system. Similarly, the voltage error mean was 0.1456, well below international standards such as IEC 61724, which recommends errors below 1% for solar system monitoring. These results confirm the high precision of my design. The efficiency was assessed in terms of data transmission rates between the monitoring module and computer cluster. My system achieved an average transmission efficiency of 84.75%, compared to 65.2% for the SCADA system. This improvement is attributed to the optimized protocol and carrier wave detection mechanism, which minimize packet loss in the solar system network.
I have summarized the comparative performance metrics in Table 4. This table highlights the superiority of my system across multiple dimensions, reinforcing its suitability for modern solar system applications.
| Performance Metric | Traditional SCADA System | Designed Intelligent System | Improvement |
|---|---|---|---|
| Taylor Approximation Error Mean | 0.5123 (high variability) | 0.2135 (stable) | 58.3% reduction |
| Voltage Error Mean | 0.3241 | 0.1456 | 55.1% reduction |
| Data Transmission Efficiency | 65.2% | 84.75% | 30.0% increase |
| Response Time for Anomalies | 5.2 seconds | 1.8 seconds | 65.4% faster |
| Energy Consumption per Node | 15.3 W | 9.7 W | 36.6% lower |
| Scalability (Max Nodes Supported) | 100 | 1000 | 900% increase |
The functionality of the system was also tested through real-world scenarios. For example, during a sudden temperature rise in an inverter, the sensing module detected the anomaly and triggered an alert within seconds. The software then analyzed historical data to recommend a cooling strategy, preventing potential damage to the solar system. Similarly, the optical sensor provided accurate irradiance data that was used to forecast energy production for the next day, aiding in grid integration. These capabilities demonstrate the holistic approach of my design, addressing both operational and predictive needs of a solar system.
To further quantify the benefits, I calculated the overall system reliability using a Markov model. The solar system is represented as a series of components, each with a failure rate \( \lambda_i \) and repair rate \( \mu_i \). The steady-state availability \( A \) is given by:
$$ A = \prod_{i=1}^n \frac{\mu_i}{\lambda_i + \mu_i} $$
For my monitoring system, the enhanced detection and response mechanisms increase the repair rates, resulting in an availability of 99.95%, compared to 99.7% for the SCADA system. This translates to significantly reduced downtime and higher energy yield for the solar system.
Advanced Features and Future Enhancements
Beyond the core modules, the designed system incorporates several advanced features that elevate its utility for distributed solar photovoltaic power stations. One such feature is the integration of cloud-based storage and analytics. All data from the solar system is securely uploaded to a cloud platform, where machine learning models continuously refine their predictions. This enables trends analysis across multiple solar systems, identifying common failure modes and optimizing maintenance schedules on a global scale. The cloud interface also supports mobile applications, allowing operators to monitor the solar system from smartphones, enhancing convenience and responsiveness.
Another feature is the adaptive control capability, where the monitoring system can automatically adjust parameters of the solar system based on real-time data. For instance, if the optical sensor indicates low irradiance due to cloud cover, the system can reconfigure the inverter settings to maximize efficiency under partial shading conditions. This is achieved through a PID (Proportional-Integral-Derivative) controller implemented in software. The control output \( u(t) \) is calculated as:
$$ u(t) = K_p e(t) + K_i \int_0^t e(\tau) d\tau + K_d \frac{de(t)}{dt} $$
where \( e(t) \) is the error between desired and actual power output, and \( K_p \), \( K_i \), \( K_d \) are tuning parameters. This closed-loop control ensures that the solar system operates at peak performance despite environmental fluctuations.
Looking ahead, I plan to enhance the system with blockchain technology for secure data logging and peer-to-peer energy trading. In a decentralized solar system network, blockchain can record all transactions and monitoring data immutably, fostering trust among stakeholders. Additionally, the integration of 5G communications will reduce latency further, enabling real-time control for critical applications. These advancements will solidify the system’s position as a next-generation solution for solar system management.
In conclusion, the distributed solar photovoltaic power station monitoring system I have designed offers a comprehensive, accurate, and efficient approach to managing complex solar systems. By combining robust hardware modules with intelligent software, it addresses the limitations of traditional systems and provides a scalable platform for future innovations. The experimental validation confirms its superiority in terms of precision, speed, and functionality, making it a valuable tool for operators and researchers alike. As the adoption of solar energy grows, such monitoring systems will play a pivotal role in ensuring reliability and maximizing the return on investment for solar system deployments worldwide.