
The efficiency of photovoltaic (PV) modules, the core components of a solar system, is inherently temperature-dependent. As the operating temperature of the solar cells increases, their electrical conversion efficiency decreases significantly, typically at a rate of 0.4% to 0.5% per degree Celsius rise. This thermal characteristic poses a major challenge for maximizing the energy yield from any solar system. Consequently, effective thermal management strategies are crucial for enhancing the overall performance and economic viability of photovoltaic installations. Various cooling techniques have been explored, ranging from passive air convection to active fluid-based systems. This article presents a comprehensive comparative study of three distinct cooling methodologies for a standard solar system: a naturally air-cooled fixed-tilt system, a copper tube water-cooled photovoltaic/thermal (PV/T) system, and a novel surface-water-film cooled PV system.
The fundamental energy balance for a PV module, which is applicable to any solar system configuration, can be expressed by a transient heat equation. The net energy gain determines the module’s temperature. The general form of this equation is:
$$ C_{mod} \frac{dT}{dt} = A(1-R)I_s – Q_c – Q_r – P_{out} $$
Where:
- $C_{mod}$ is the total heat capacity of the PV module (J/K).
- $T$ is the module operating temperature (K).
- $A$ is the surface area of the module (m²).
- $R$ is the surface reflectance.
- $I_s$ is the incident solar irradiance (W/m²).
- $Q_c$ is the convective heat loss to the environment (W).
- $Q_r$ is the radiative heat loss (W).
- $P_{out}$ is the electrical power output (W).
The convective heat loss $Q_c$ depends on the cooling mechanism. For a standard, naturally cooled solar system, it involves natural convection from both front and back surfaces:
$$ Q_c = A (h_{c,fe} + h_{c,fo}) (T – T_a) $$
where $h_{c,fe}$ and $h_{c,fo}$ are natural convection coefficients for the front and back, and $T_a$ is the ambient temperature.
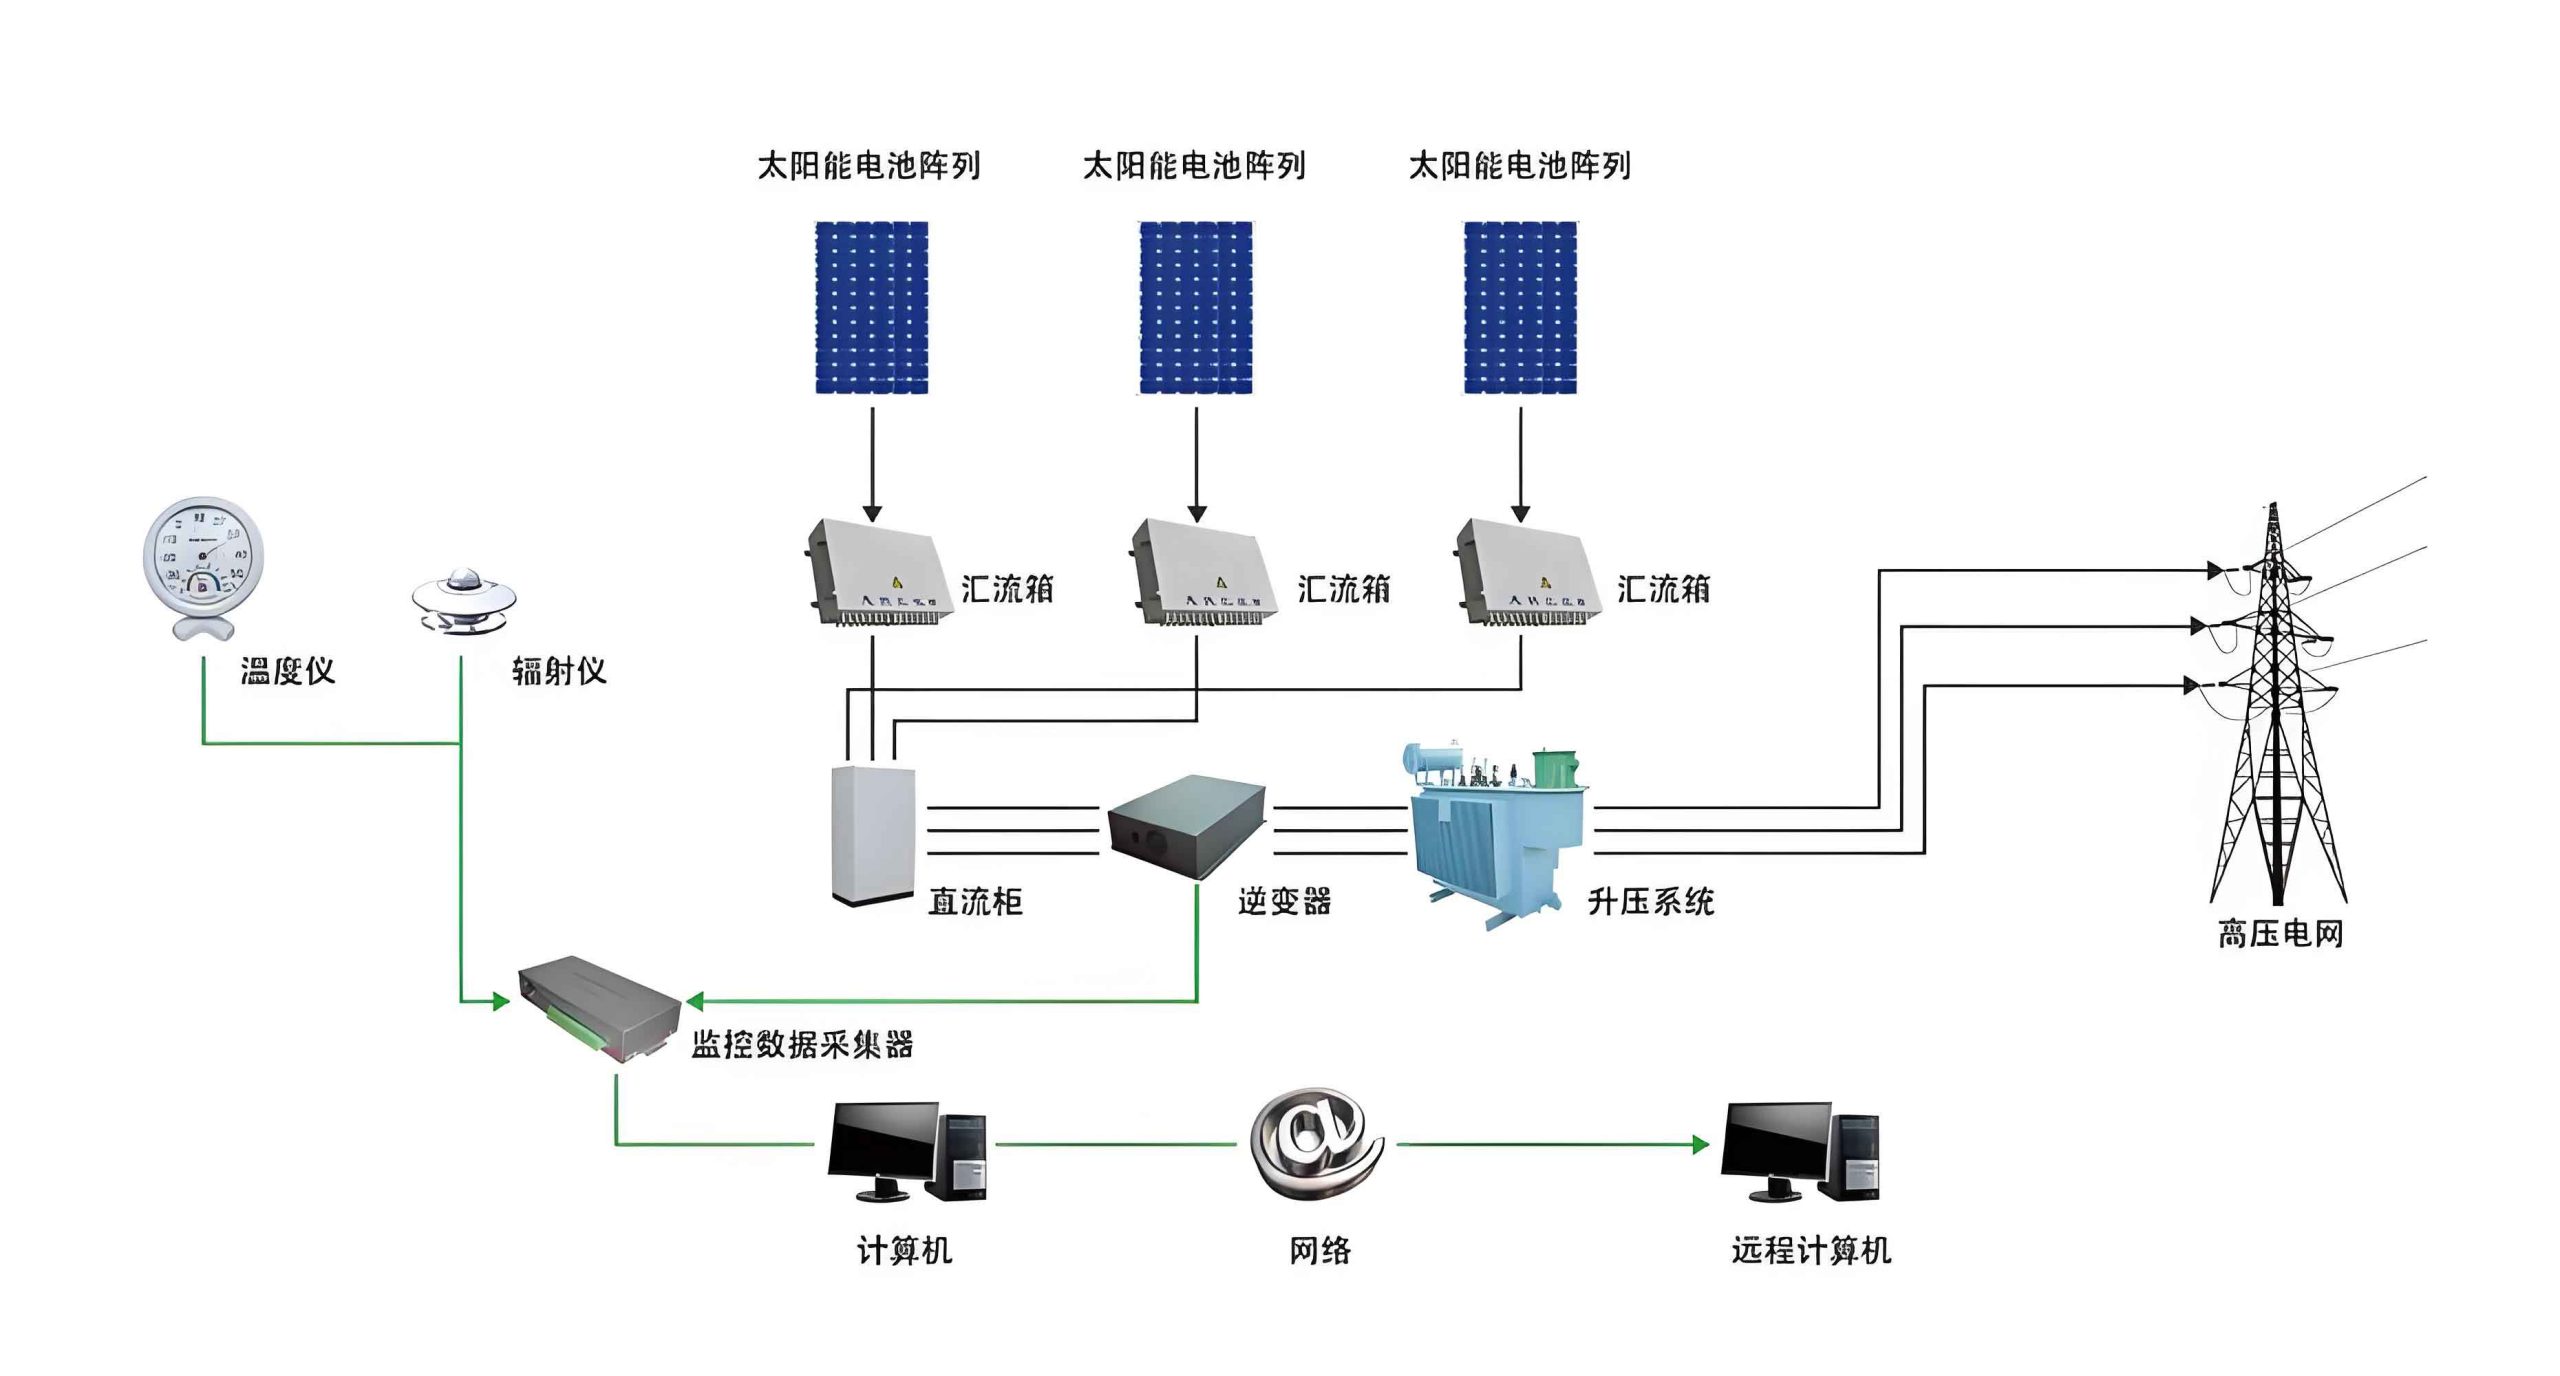
The electrical output $P_{out}$ is a function of irradiance and temperature. A simplified model based on the fill factor can be used:
$$ P_{out} = C_{FF} \frac{I_s \ln(C I_s)}{T} $$
where $C_{FF}$ and $C$ are empirical constants. The instantaneous cell conversion efficiency $\eta_e$ is then:
$$ \eta_e = \frac{P_{out}}{A I_s} $$
Solving the differential equation for $T$ allows for the theoretical prediction of performance for a baseline solar system.
Theoretical Models for Active Cooling Systems
1. Copper Tube Water-Cooled PV/T System
This hybrid solar system integrates a fluid cooling circuit at the rear of the PV module. Copper tubes are attached to a metal absorber plate bonded to the module’s backsheet. The circulating water extracts thermal energy, reducing cell temperature and simultaneously providing useful heat. The energy equation for this PV/T solar system modifies the general balance to include heat extraction by the fluid $Q_{fluid}$:
$$ C_{mod} \frac{dT}{dt} = A(1-R)I_s – Q_c – Q_r – P_{out} – Q_{fluid} $$
The heat extracted by the fluid can be modeled as:
$$ Q_{fluid} = \dot{m} C_p (T_{out} – T_{in}) $$
where $\dot{m}$ is the mass flow rate, $C_p$ is the specific heat of water, and $T_{in}$ and $T_{out}$ are the inlet and outlet fluid temperatures. The electrical output model must account for the lower operating temperature, often using a temperature coefficient $\beta$:
$$ P_{PV/T} = P_{STC} \cdot \frac{I_s}{I_{STC}} \cdot [1 – \beta (T – T_{STC})] $$
where the subscript $STC$ denotes Standard Test Conditions (25°C, 1000 W/m²).
2. Surface Water-Film Cooled PV System
This approach represents an innovative cooling method for a standard PV solar system. A thin, continuous film of water (approximately 1 mm thick) is cascaded over the front glass surface of the module. This achieves dual benefits: cooling via forced convection/evaporation and cleaning of dust. The heat transfer dynamics change substantially. The front-side convection $Q_{c,front}$ is now forced convection over a flat plate with a water film:
$$ Q_{c,front} = A h_{c,f} (T – T_{water}) $$
The forced convection coefficient $h_{c,f}$ is calculated using empirical correlations for flow over a flat plate:
$$ Nu_L = 0.037 Re_L^{0.8} Pr^{1/3} $$
$$ h_{c,f} = \frac{Nu_L \cdot k}{L} $$
where $Nu_L$ is the Nusselt number, $Re_L$ is the Reynolds number based on module length $L$, $Pr$ is the Prandtl number of water, and $k$ is the thermal conductivity of water. The rear-side convection $Q_{c,rear}$ typically remains natural convection to air. The overall energy balance becomes:
$$ C_{mod} \frac{dT}{dt} = \tau A I_s – A[h_{c,f}(T-T_{water}) + h_{c,rear}(T-T_a)] – Q_r – P_{out} $$
Note the inclusion of the transmittance $\tau$ of the water-glass interface, which may slightly reduce the effective irradiance reaching the cells.
Experimental Setup and Methodology
To validate the theoretical models and conduct a fair comparison, three identical monocrystalline silicon PV modules (190W each) were configured into different solar system archetypes. Key module specifications are summarized below:
| Parameter | Specification |
|---|---|
| Model | S-190C (Monocrystalline) |
| Rated Power ($P_{max}$) | 190 W |
| Open-Circuit Voltage ($V_{oc}$) | 45.5 V |
| Short-Circuit Current ($I_{sc}$) | 5.70 A |
| Temperature Coefficient of $P_{max}$ ($\beta$) | -0.47 %/°C |
| Number of Cells | 72 (6×12) |
System 1: Fixed-Tilt, Naturally Cooled (Reference TPV System)
A module was mounted at a fixed optimal tilt angle. Its back surface was exposed to ambient air for natural convection cooling. This setup represents a conventional, utility-scale solar system configuration.
System 2: Copper Tube Water-Cooled PV/T System
The second module was modified. A copper absorber plate was thermally bonded to its rear. Eight parallel copper tubes were soldered to this plate, forming a hydraulic circuit connected to a insulated storage tank and a circulation pump. This active solar system simultaneously generates electricity and hot water.
System 3: Surface Water-Film Cooled PV System
The third module was equipped with a distribution manifold at its top edge to create a uniform water film over the front glass. A pump recirculated water from a temperature-controlled reservoir. The flow rate was adjusted to maintain the target ~1 mm film thickness. This design mimics a potential cooling sub-system for large solar system installations in arid regions.
All systems were installed co-laterally. Data acquisition systems recorded global horizontal irradiance, module front and back temperatures, ambient temperature, wind speed, output current and voltage (from which power and efficiency were calculated), and for the active systems, fluid flow rates and temperatures. Testing was conducted over multiple clear and partially cloudy days.
Results and Comparative Analysis
The performance of the three solar system configurations was evaluated primarily based on two metrics: the operating temperature of the PV module (specifically the back-surface temperature as a proxy for cell temperature) and the instantaneous electrical conversion efficiency $\eta_e$.
Temperature Profiles
The back-surface temperature trends for a representative sunny day are illustrated in the data below. The fixed-tilt (TPV) system showed the highest temperatures, peaking shortly after solar noon. The surface-water system maintained the lowest temperatures consistently. The copper-tube PV/T system’s temperature was intermediate but notably higher than the surface-cooled module during peak irradiation, indicating a potential limitation in heat extraction rate or thermal contact resistance.
| Time Interval | Avg. Back Temp. – Fixed Tilt (°C) | Avg. Back Temp. – Copper Tube (°C) | Avg. Back Temp. – Surface Water (°C) | Avg. Irradiance (W/m²) |
|---|---|---|---|---|
| 09:00-10:00 | 38.2 | 35.1 | 29.5 | 512 |
| 11:00-12:00 | 56.7 | 49.8 | 41.3 | 892 |
| 13:00-14:00 | 58.9 | 51.4 | 42.8 | 905 |
| 15:00-16:00 | 51.4 | 45.6 | 38.1 | 687 |
Electrical Conversion Efficiency
The electrical efficiency directly correlates with the operating temperature. The surface water-cooled solar system demonstrated the highest efficiency throughout the day due to its superior cooling. The efficiency gain for the copper-tube system was measurable but smaller. The average relative improvements over the fixed-tilt reference system are quantified as follows:
| Cooling System Type | Average Cell Temp. Reduction vs. Fixed-Tilt (°C) | Average Efficiency Gain vs. Fixed-Tilt (%-points absolute) | Peak Efficiency Observed (%) |
|---|---|---|---|
| Copper Tube PV/T | 6.5 – 8.0 | ~0.3 | ~15.9 |
| Surface Water Film | 12.0 – 16.0 | ~2.0 – 3.0 | ~18.4 |
| Fixed-Tilt (Reference) | 0 | 0 | ~15.6 |
The efficiency $\eta_e$ can be modeled as a linear function of temperature:
$$ \eta_e(T) = \eta_{ref} \cdot [1 – \beta (T – T_{ref})] $$
Where $\eta_{ref}$ is the efficiency at reference temperature $T_{ref}$. Plotting the experimental data against this model confirms the inverse relationship and validates the temperature coefficients.
Model Validation and Discussion
The theoretical models developed earlier were solved numerically using measured environmental data as inputs (e.g., $I_s(t)$, $T_a(t)$). The predicted module temperatures were compared against experimental readings.
For the Fixed-Tilt System:
The theoretical model based on natural convection correlations showed good agreement with measured data, with a root-mean-square error (RMSE) of approximately 2.1°C. Discrepancies were attributed to varying wind speeds not fully captured by the model’s convection coefficients.
For the Copper Tube PV/T System:
The model incorporating fluid heat extraction required careful calibration of the thermal resistance between the cells and the flowing water. After calibration, the temperature prediction RMSE was around 3.5°C. The model successfully captured the trend that this solar system offers more stable temperatures than the fixed-tilt system but is less effective at peak cooling than the surface film method.
For the Surface Water System:
The forced convection model for the water film provided excellent predictions during stable flow conditions. The key finding was the profound cooling effect, which the model accurately predicted. The steady-state energy balance for this system under high irradiance simplifies to:
$$ \tau A I_s \approx A h_{c,f} (T – T_{water}) + P_{out} $$
This shows that the module temperature $T$ is pulled close to the water temperature $T_{water}$ due to the large $h_{c,f}$, which is orders of magnitude greater than natural air convection coefficients. This explains its superior performance.
Practical Implications and System Considerations
Choosing a cooling strategy for a large-scale solar system involves a trade-off between performance gains and added complexity, cost, and water/energy consumption.
| Aspect | Copper Tube PV/T System | Surface Water-Film System | Fixed-Tilt System |
|---|---|---|---|
| Primary Benefit | Co-generation of heat & power (higher total energy yield). | Highest electrical efficiency gain; inherent panel cleaning. | Simplicity, low cost, zero operational water/energy use. |
| Key Drawback | Higher initial cost & complexity; risk of freezing; lower peak electrical gain. | Water consumption & pumping energy; bio-fouling/scale risk; requires water treatment. | Lowest electrical yield per module; significant efficiency loss on hot days. |
| Best Application | Applications with concurrent demand for low-grade heat (e.g., domestic hot water, space heating). | Large utility-scale plants in hot, arid, dusty regions where water is available (e.g., treated wastewater). | Most utility-scale and distributed installations where simplicity and LCOE are paramount. |
| Impact on solar system LCOE | Can be positive if thermal energy is valorized; otherwise, added cost may not be justified by electrical gain alone. | Positive if efficiency gain and reduced soiling losses outweigh water and pumping costs. Highly site-specific. | Baseline. Any cooling system must beat this LCOE to be viable. |
The net electrical gain $\Delta P_{net}$ for an active cooling solar system must account for the parasitic power consumption $P_{pump}$ of the pumps:
$$ \Delta P_{net} = \Delta P_{cooling} – P_{pump} $$
where $\Delta P_{cooling}$ is the increase in PV power output due to lower temperature. For the surface water solar system, the net benefit is clear only if $\Delta P_{net} > 0$ over the operational cycle.
Conclusion
This study systematically analyzed the thermodynamic and electrical performance of three distinct cooling configurations for a photovoltaic solar system. Theoretical models based on energy balance principles were developed and validated against experimental data. The results unequivocally demonstrate that active cooling can significantly enhance the electrical performance of a PV solar system by mitigating temperature-related efficiency losses.
Among the methods investigated, the surface water-film cooling technique proved to be the most effective in lowering the operating temperature of the PV cells, yielding an absolute efficiency improvement of 2-3 percentage points over an uncooled, fixed-tilt solar system. This method offers the additional, valuable benefit of automated panel cleaning, which combats soiling losses—a major concern in many regions. The copper tube water-cooled PV/T solar system provided more moderate electrical gains (~0.3%-points) but delivers useful thermal energy, making it a compelling option for applications where both electricity and heat are required.
The choice of an optimal cooling strategy is not universal; it depends critically on the local climate (ambient temperature, solar resource, dust conditions), water availability and cost, energy prices, and the specific value streams for electricity versus thermal energy. For large-scale, electricity-only solar system plants in hot and dusty environments, surface film cooling presents a promising, high-impact technology worthy of further engineering development to optimize water use and system reliability. Ultimately, integrating effective thermal management is a crucial step toward unlocking the full potential of photovoltaic solar system technology, pushing the boundaries of energy yield and economic performance.