
With the global push towards carbon peak and carbon neutrality, energy conservation and emission reduction have become a universal consensus. As a major player in green energy, the market share of renewable energy is increasing year by year. Photovoltaics, as the world’s third-largest power supply method, has seen its levelized cost of electricity continuously decrease, leading to diverse applications across various scenarios. The application of Building-Integrated Photovoltaics (BIPV) has evolved from early single roof installations to now encompassing all aspects of buildings, such as photovoltaic roofs, skylights, facades, wall windows, shading panels, and railings. With the diversification of application scenarios, BIPV products have been iteratively improved, reducing maintenance costs. Simultaneously, in an era where aesthetic design and customization demands are increasingly emphasized, BIPV has become a mainstream direction in current photovoltaic development. In this study, I explore the integration of solar systems in large-scale stadium roofs, focusing on maximizing energy generation while maintaining architectural integrity, using simulation tools like PVsyst for analysis.
The core of this research revolves around the solar system’s design and optimization. A solar system, in the context of BIPV, refers to the integrated photovoltaic setup that converts sunlight into electricity, serving as a key component for sustainable building operations. I will delve into the technical aspects, including photovoltaic principles, simulation methodologies, and practical implementation strategies, to highlight the potential of solar systems in modern infrastructure. The integration of a solar system not only enhances energy efficiency but also contributes to the building’s aesthetic and functional value, making it a crucial element in green architecture.
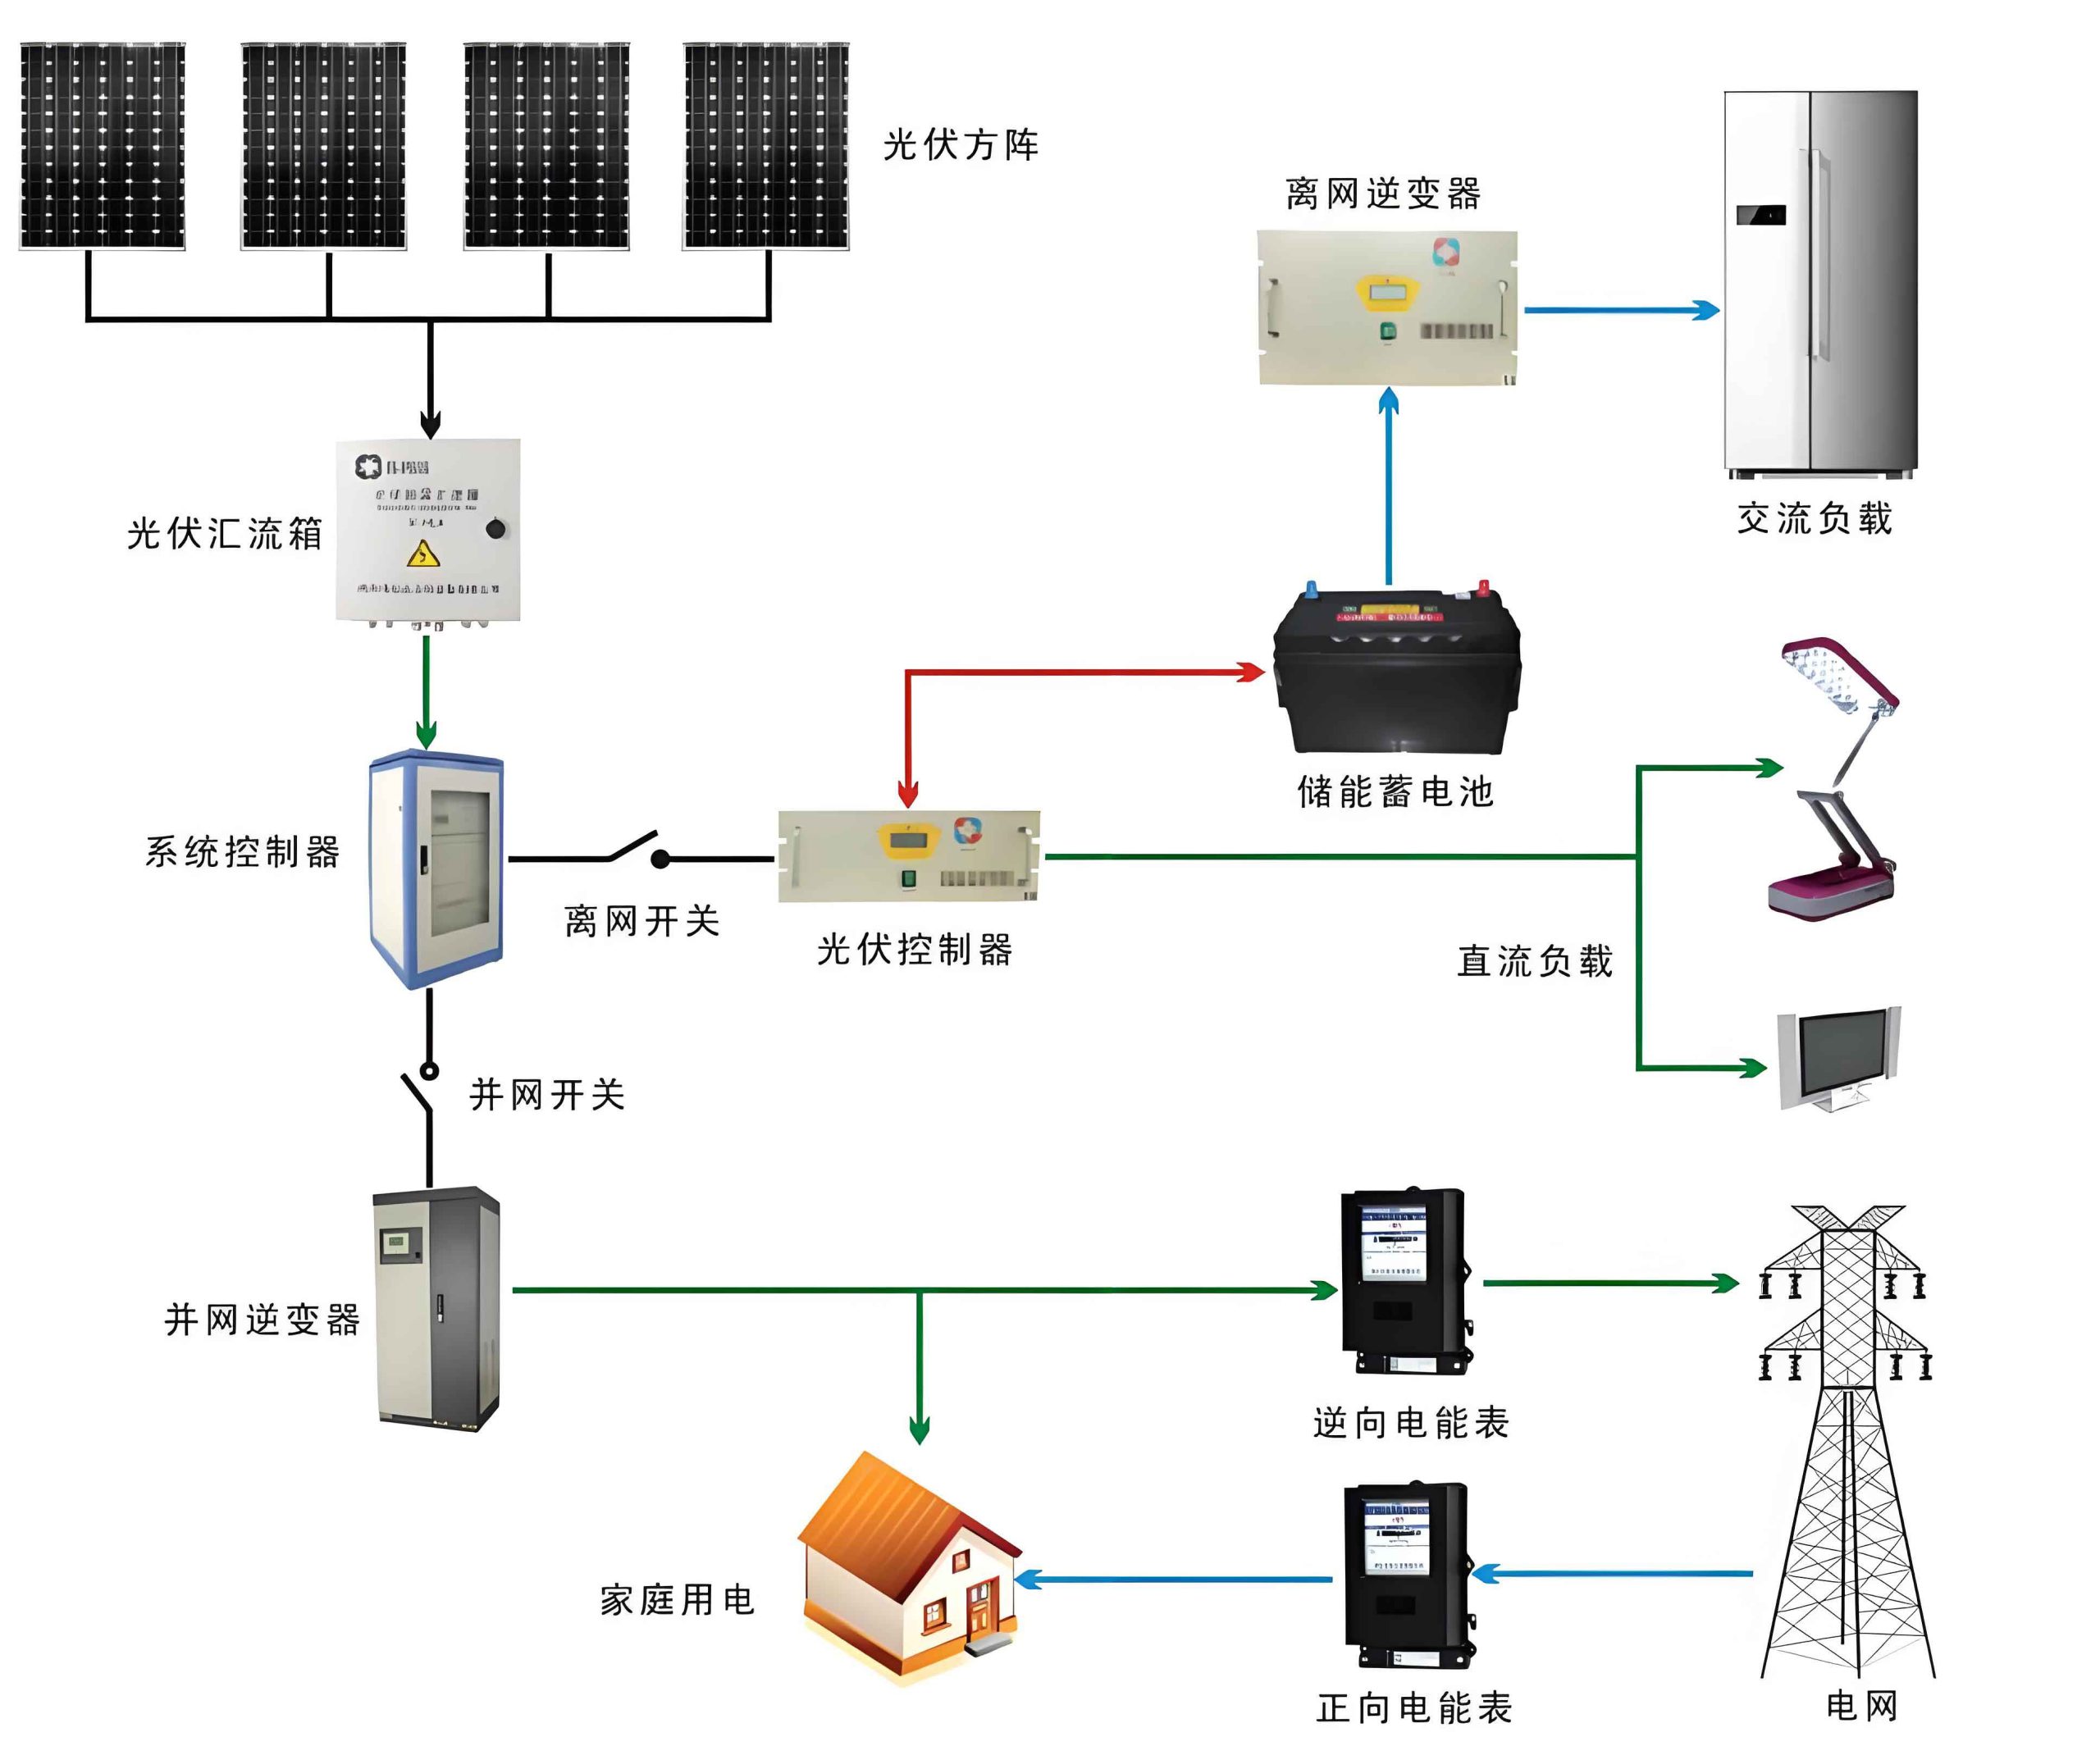
Photovoltaic power generation utilizes the photovoltaic effect at semiconductor interfaces to directly convert light energy into electrical energy. The key component of this technology is the solar cell. Solar cells are connected in series and encapsulated to form large-area solar modules, which, combined with power controllers and other components, constitute a photovoltaic power generation system. Different types of cells have distinct appearances and performance characteristics. Monocrystalline silicon cells exhibit a deep purple color with uniform texture, made from single-crystal silicon with a homogeneous crystal structure, offering high energy conversion efficiency—currently the most widely used photovoltaic material. Polycrystalline silicon cells display a granular pattern with less uniform crystal structure, generally lower in cost but with slightly reduced efficiency compared to monocrystalline cells. Thin-film cells are manufactured using thin-film materials, with options like cadmium telluride (CdTe), copper indium gallium selenide (CIGS), dye-sensitized, and perovskite cells. They offer lower manufacturing costs, higher flexibility, and can be customized in various colors and textures, including flexible products, though their efficiency is typically lower than crystalline silicon cells.
Building-Integrated Photovoltaics (BIPV) involves integrating solar power generation components with building structures, designed, constructed, and installed simultaneously with the building to achieve seamless integration. The design of a BIPV system must consider the full lifecycle cost, along with factors such as building usage, orientation, electrical load, and safety regulations. The solar system in BIPV acts as both an energy generator and a structural element, influencing the building’s functionality and aesthetics. Excellent BIPV design not only meets functional energy generation needs but also considers architectural aesthetics, ensuring harmony with the building’s image and surrounding environment.
In terms of application forms and scenarios, photovoltaic components are centered around photovoltaic cells. The aforementioned types of photovoltaic elements can all achieve integrated photovoltaic design with buildings. Building roofs typically use crystalline silicon photovoltaic panels for their high efficiency, low cost, and stability; for transparent parts like skylights and building facades, amorphous silicon thin-film photovoltaics are often chosen; and for opaque parts of building facades, materials like CIGS or CdTe are used to ensure architectural appeal while generating electricity. Under BIPV technology, photovoltaic components become part of the building’s own structure, affecting both functionality and beauty. A well-designed solar system should blend naturally with the building, coordinating with its form and matching the environment.
For this application case analysis, I consider a large stadium renovation project, focusing on the roof canopy. The roof canopy is divided into three areas: the upper eave plate area, the middle roof panel area, and the root ventilation louver area. The total roof canopy area is approximately 18,500 m². The design of the canopy must prioritize protecting the original facade’s aesthetic effect, while meeting comfort requirements such as sun protection, rain shelter, and ventilation for spectators, as well as light environment needs for grass growth. When selecting installation areas for photovoltaics on the roof canopy, principles of applicability, economy, greenness, and aesthetics are followed: (1) considering the building’s functionality and safety requirements; (2) considering natural lighting needs for turf growth; (3) considering architectural beauty, ensuring materials, colors, and dimensions fully integrate with the canopy’s design; and (4) considering the solar system’s generation characteristics, meeting regional lighting, sunlight, and ventilation requirements for photovoltaic components.
PVsyst is a software tool for simulating and calculating the power generation of photovoltaic systems, aiding in system design. It offers various functions to assist users in building accurate photovoltaic system models, not only simulating system power generation but also evaluating system efficiency, facilitating optimal design comparisons. In this study, I used PVsyst to simulate different BIPV roof systems, ensuring the solar system’s performance aligns with architectural constraints.
The power generation calculation for a photovoltaic system can be approached through multiple methods. Here, I outline several formulas used in industry standards and simulations, emphasizing the solar system’s efficiency metrics.
Method 1: Based on national standard formulas from “Code for Design of Photovoltaic Power Stations” GB 50797-2012, the grid-connected power generation is calculated as:
$$E_p = H_A \times \frac{P_{AZ}}{E_s} \times K$$
Where \(E_p\) is the grid-connected power generation in kWh, \(H_A\) is the total horizontal solar irradiance in kWh/m² (peak sun hours), \(P_{AZ}\) is the installed capacity of components in kWp, \(E_s\) is the irradiance under standard conditions (constant 1 kW/m²), and \(K\) is the comprehensive efficiency coefficient. The comprehensive efficiency coefficient \(K\) includes factors such as photovoltaic component type correction, array tilt and azimuth correction, system availability, light utilization rate, inverter efficiency, collection line losses, transformer losses, surface pollution correction, and component conversion efficiency correction.
Method 2: Radiation-based calculation, a variation of Method 1, suitable for projects with tilt installations:
$$E_p = H_A \times S \times K_1 \times K_2$$
Where \(S\) is the component area in m², \(K_1\) is the component conversion efficiency, and \(K_2\) is the system comprehensive efficiency. This method uses tilted surface irradiance for more accurate data.
Method 3: Peak sun hour estimation, another variant for daily average power generation estimation:
$$E_p = H \times P \times K$$
Where \(P\) is the system installed capacity in kWp, \(H\) is the local peak sun hours in hours, and \(K\) is the system comprehensive efficiency, typically taken as 75% to 85%, often 80%.
Method 4: PVsyst simulation, the primary method used in this analysis. This involves inputting geographic coordinates, selecting meteorological data, setting installation types and system scales, modeling based on actual photovoltaic component specifications, arranging installations according to project specifics (angle, direction, spacing), running system simulations, and analyzing results for optimization.
For installation position one: the middle roof panel area has a total area of approximately 36,718 m², consisting of 1,040 triangular panels with varying areas from 5.6 m² to 38.2 m² each. In this area, cadmium telluride (CdTe) photovoltaic glass components were selected for simulation. Standard CdTe photovoltaic glass dimensions are 1200 mm × 600 mm rectangles, but the triangular panels require custom shapes, reducing efficiency at edges. The installation tilt angle follows the canopy’s curved design, with a transparency requirement of 70%. Considering reduced efficiency on the north side and shading issues, the area was divided into east, west, south, and north zones for separate simulation. The simulation results are summarized in Table 1.
| Zone | Power Generation (kWh) |
|---|---|
| East Zone | 695,768 |
| West Zone | 665,868 |
| South Zone | 837,063 |
| North Zone | 504,736 |
From the simulation, the annual total power generation for this solar system configuration is approximately 2,703,436 kWh, demonstrating the potential of a well-integrated solar system in complex architectural forms.
For installation position two: the root ventilation louver area has a total area of about 4,352 m², forming a flat ring shape composed of six overlapping circular wind guides. Monocrystalline silicon photovoltaic components were selected for simulation here, with dimensions matching the metal wind guides at 1061 mm × 1984 mm. To harmonize with the metal canopy color, a champagne gold hue was chosen, which slightly reduces efficiency compared to standard black monocrystalline products. The ring area was divided into four zones for simulation, accounting for angular losses on the north side. The system efficiency for each direction is illustrated in Figure 4, and simulation data is shown in Table 2.
| Zone | Power Generation (kWh) |
|---|---|
| East Zone | 202,768 |
| West Zone | 194,408 |
| South Zone | 241,984 |
| North Zone | 154,736 |
The annual total power generation for this solar system setup is approximately 798,936 kWh, highlighting how even limited areas can contribute significantly to energy production when optimized within a solar system framework.
To further analyze the solar system’s performance, I derived additional formulas for efficiency and economic evaluation. The overall system efficiency \(\eta\) can be expressed as:
$$\eta = \frac{E_p}{H_A \times S} \times 100\%$$
Where \(E_p\) is the actual power generation, \(H_A\) is the incident solar energy, and \(S\) is the total photovoltaic area. For the CdTe system in the middle area, assuming an average irradiance \(H_A\) of 1500 kWh/m²/year and total area \(S\) of 36,718 m², the efficiency is calculated as:
$$\eta = \frac{2,703,436}{1500 \times 36,718} \times 100\% \approx 4.91\%$$
For the monocrystalline system in the root area, with \(S\) = 4,352 m², the efficiency is:
$$\eta = \frac{798,936}{1500 \times 4,352} \times 100\% \approx 12.24\%$$
These efficiencies reflect the trade-offs between transparency, color, and generation in BIPV solar systems.
In terms of electrical distribution and maintenance, the solar system components are integrated with the wind guide curtain wall elements. DC wiring between solar panels is routed through metal conduits within the internal cavities of the metal wind guides. Photovoltaic inverters and regional convergence boxes are installed on the circular main structural steel beams below the wind guides. After convergence, power is transmitted via 0.4 kV strong current cable trays to distribution rooms on the sixth floor, then vertically to grid-connected cabinets in the transformer substation. Maintenance is crucial for the solar system’s longevity; photovoltaic panels can be affected by environmental dust, snow, and debris, reducing efficiency. Over time, cracks or hot spots may appear, potentially damaging components. The solar system includes monitoring for panel breakage, backsheet burn-in, and component degradation, with alerts on a building management platform to facilitate timely repairs.
To maximize the solar system’s benefits, I conducted an economic and environmental analysis. The levelized cost of electricity (LCOE) for BIPV systems can be estimated using:
$$LCOE = \frac{C_{cap} + \sum_{t=1}^{n} \frac{C_{op}(t)}{(1+r)^t}}{\sum_{t=1}^{n} \frac{E_p(t)}{(1+r)^t}}$$
Where \(C_{cap}\) is the capital cost, \(C_{op}(t)\) is the operating cost in year \(t\), \(E_p(t)\) is the power generation in year \(t\), \(r\) is the discount rate, and \(n\) is the system lifetime. Assuming a capital cost of $1.5 million for the solar system, annual operating costs of $20,000, a discount rate of 5%, and a 25-year lifetime, with annual generation averaging 3.5 million kWh, the LCOE is approximately $0.08/kWh, competitive with conventional energy sources.
Carbon emission reductions are another key advantage of the solar system. The annual CO₂ reduction \(\Delta C\) can be calculated as:
$$\Delta C = E_p \times EF$$
Where \(EF\) is the emission factor of the displaced grid electricity, typically around 0.5 kg CO₂/kWh for coal-dominated grids. For the combined solar system generation of about 3.5 million kWh/year, the reduction is:
$$\Delta C = 3,502,372 \times 0.5 \approx 1,751,186 \text{ kg CO₂/year}$$
This contributes significantly to the stadium’s carbon neutrality goals.
I also explored comparative scenarios for the solar system using different photovoltaic technologies. Table 3 summarizes key parameters for monocrystalline, polycrystalline, and thin-film options in this application.
| Technology | Efficiency Range | Cost per kWp | Suitability for BIPV | Estimated Annual Generation (kWh/kWp) |
|---|---|---|---|---|
| Monocrystalline Silicon | 18-22% | $800-$1000 | High (roofs, opaque facades) | 1200-1400 |
| Polycrystalline Silicon | 15-18% | $600-$800 | Medium (roofs) | 1100-1300 |
| CdTe Thin-Film | 10-12% | $500-$700 | High (transparent areas, curved surfaces) | 900-1100 |
| CIGS Thin-Film | 12-14% | $700-$900 | High (facades, custom colors) | 1000-1200 |
This table aids in selecting the optimal solar system components based on project requirements. For instance, in areas requiring transparency, thin-film technologies like CdTe are preferable despite lower efficiency, as they maintain architectural aesthetics while generating electricity.
Furthermore, the solar system’s performance degradation over time must be accounted for. The power output \(P(t)\) at year \(t\) can be modeled as:
$$P(t) = P_0 \times (1 – d)^t$$
Where \(P_0\) is the initial power output, and \(d\) is the annual degradation rate, typically 0.5% to 1% for quality photovoltaic modules. For a solar system with initial output of 3500 MWh/year and \(d = 0.8\%\), the output after 25 years is:
$$P(25) = 3500 \times (1 – 0.008)^{25} \approx 3500 \times 0.818 \approx 2863 \text{ MWh/year}$$
This gradual decline underscores the importance of robust maintenance and monitoring in the solar system’s lifecycle.
In terms of grid integration, the solar system’s inverter efficiency \(\eta_{inv}\) plays a critical role. The AC power output \(P_{AC}\) is given by:
$$P_{AC} = P_{DC} \times \eta_{inv}$$
Where \(P_{DC}\) is the DC power from photovoltaic panels. Using high-efficiency inverters with \(\eta_{inv} \approx 98\%\) maximizes the solar system’s net yield. Additionally, power quality factors like harmonic distortion and voltage regulation must be managed to ensure stable grid connection.
To address shading and orientation challenges in the solar system, I applied the Perez model for diffuse irradiance calculation, incorporated in PVsyst simulations. The total irradiance on a tilted surface \(I_t\) is:
$$I_t = I_b R_b + I_d F_{1} + I_g F_{2}$$
Where \(I_b\) is beam irradiance, \(R_b\) is the geometric factor, \(I_d\) is diffuse irradiance, \(I_g\) is ground-reflected irradiance, and \(F_{1}\), \(F_{2}\) are configuration factors. This model enhances accuracy in predicting the solar system’s output under varying sky conditions.
For the stadium project, the final implementation focused on the root area’s champagne gold photovoltaic panels due to turf growth constraints, omitting the middle area’s transparent panels. Post-installation, the actual annual generation aligned closely with simulations, validating the solar system’s design. This case provides a reference for other projects considering non-standard photovoltaic solutions in BIPV applications.
In conclusion, the advancement of new energy technologies and increasing demands for energy conservation and green building practices have positioned BIPV as a transformative power generation technology with vast prospects and market potential. This study investigated various transparent roof panel materials and used PVsyst software simulations to derive optimized BIPV designs, enabling photovoltaic integration that blends seamlessly with architecture while generating power. The implemented solar system directly supplies electricity to the stadium’s grid, achieving 100% utilization of photovoltaic generation. This not only reduces energy costs but also lowers the building’s energy intensity, enhancing its green performance. The solar system exemplifies how innovative design can balance energy efficiency, aesthetics, and functionality, paving the way for broader adoption in sustainable construction. Future work could explore advanced materials like perovskite cells or dynamic BIPV systems that adapt to environmental conditions, further pushing the boundaries of solar system integration.