
In my extensive research into energy storage systems, the li ion battery stands out for its pivotal role in modern technology, from portable electronics to electric vehicles and grid storage. Its superior energy density, lack of memory effect, and long cycle life have cemented its dominance. However, a persistent challenge that limits its long-term application is capacity fade—the gradual loss of the battery’s ability to hold charge over repeated charge-discharge cycles. This degradation directly dictates the operational lifespan and economic viability of a li ion battery system. Among the myriad factors contributing to this decline, the formation and continuous growth of the Solid Electrolyte Interphase (SEI) layer on the graphite-based negative electrode is universally recognized as a primary culprit during normal operation.
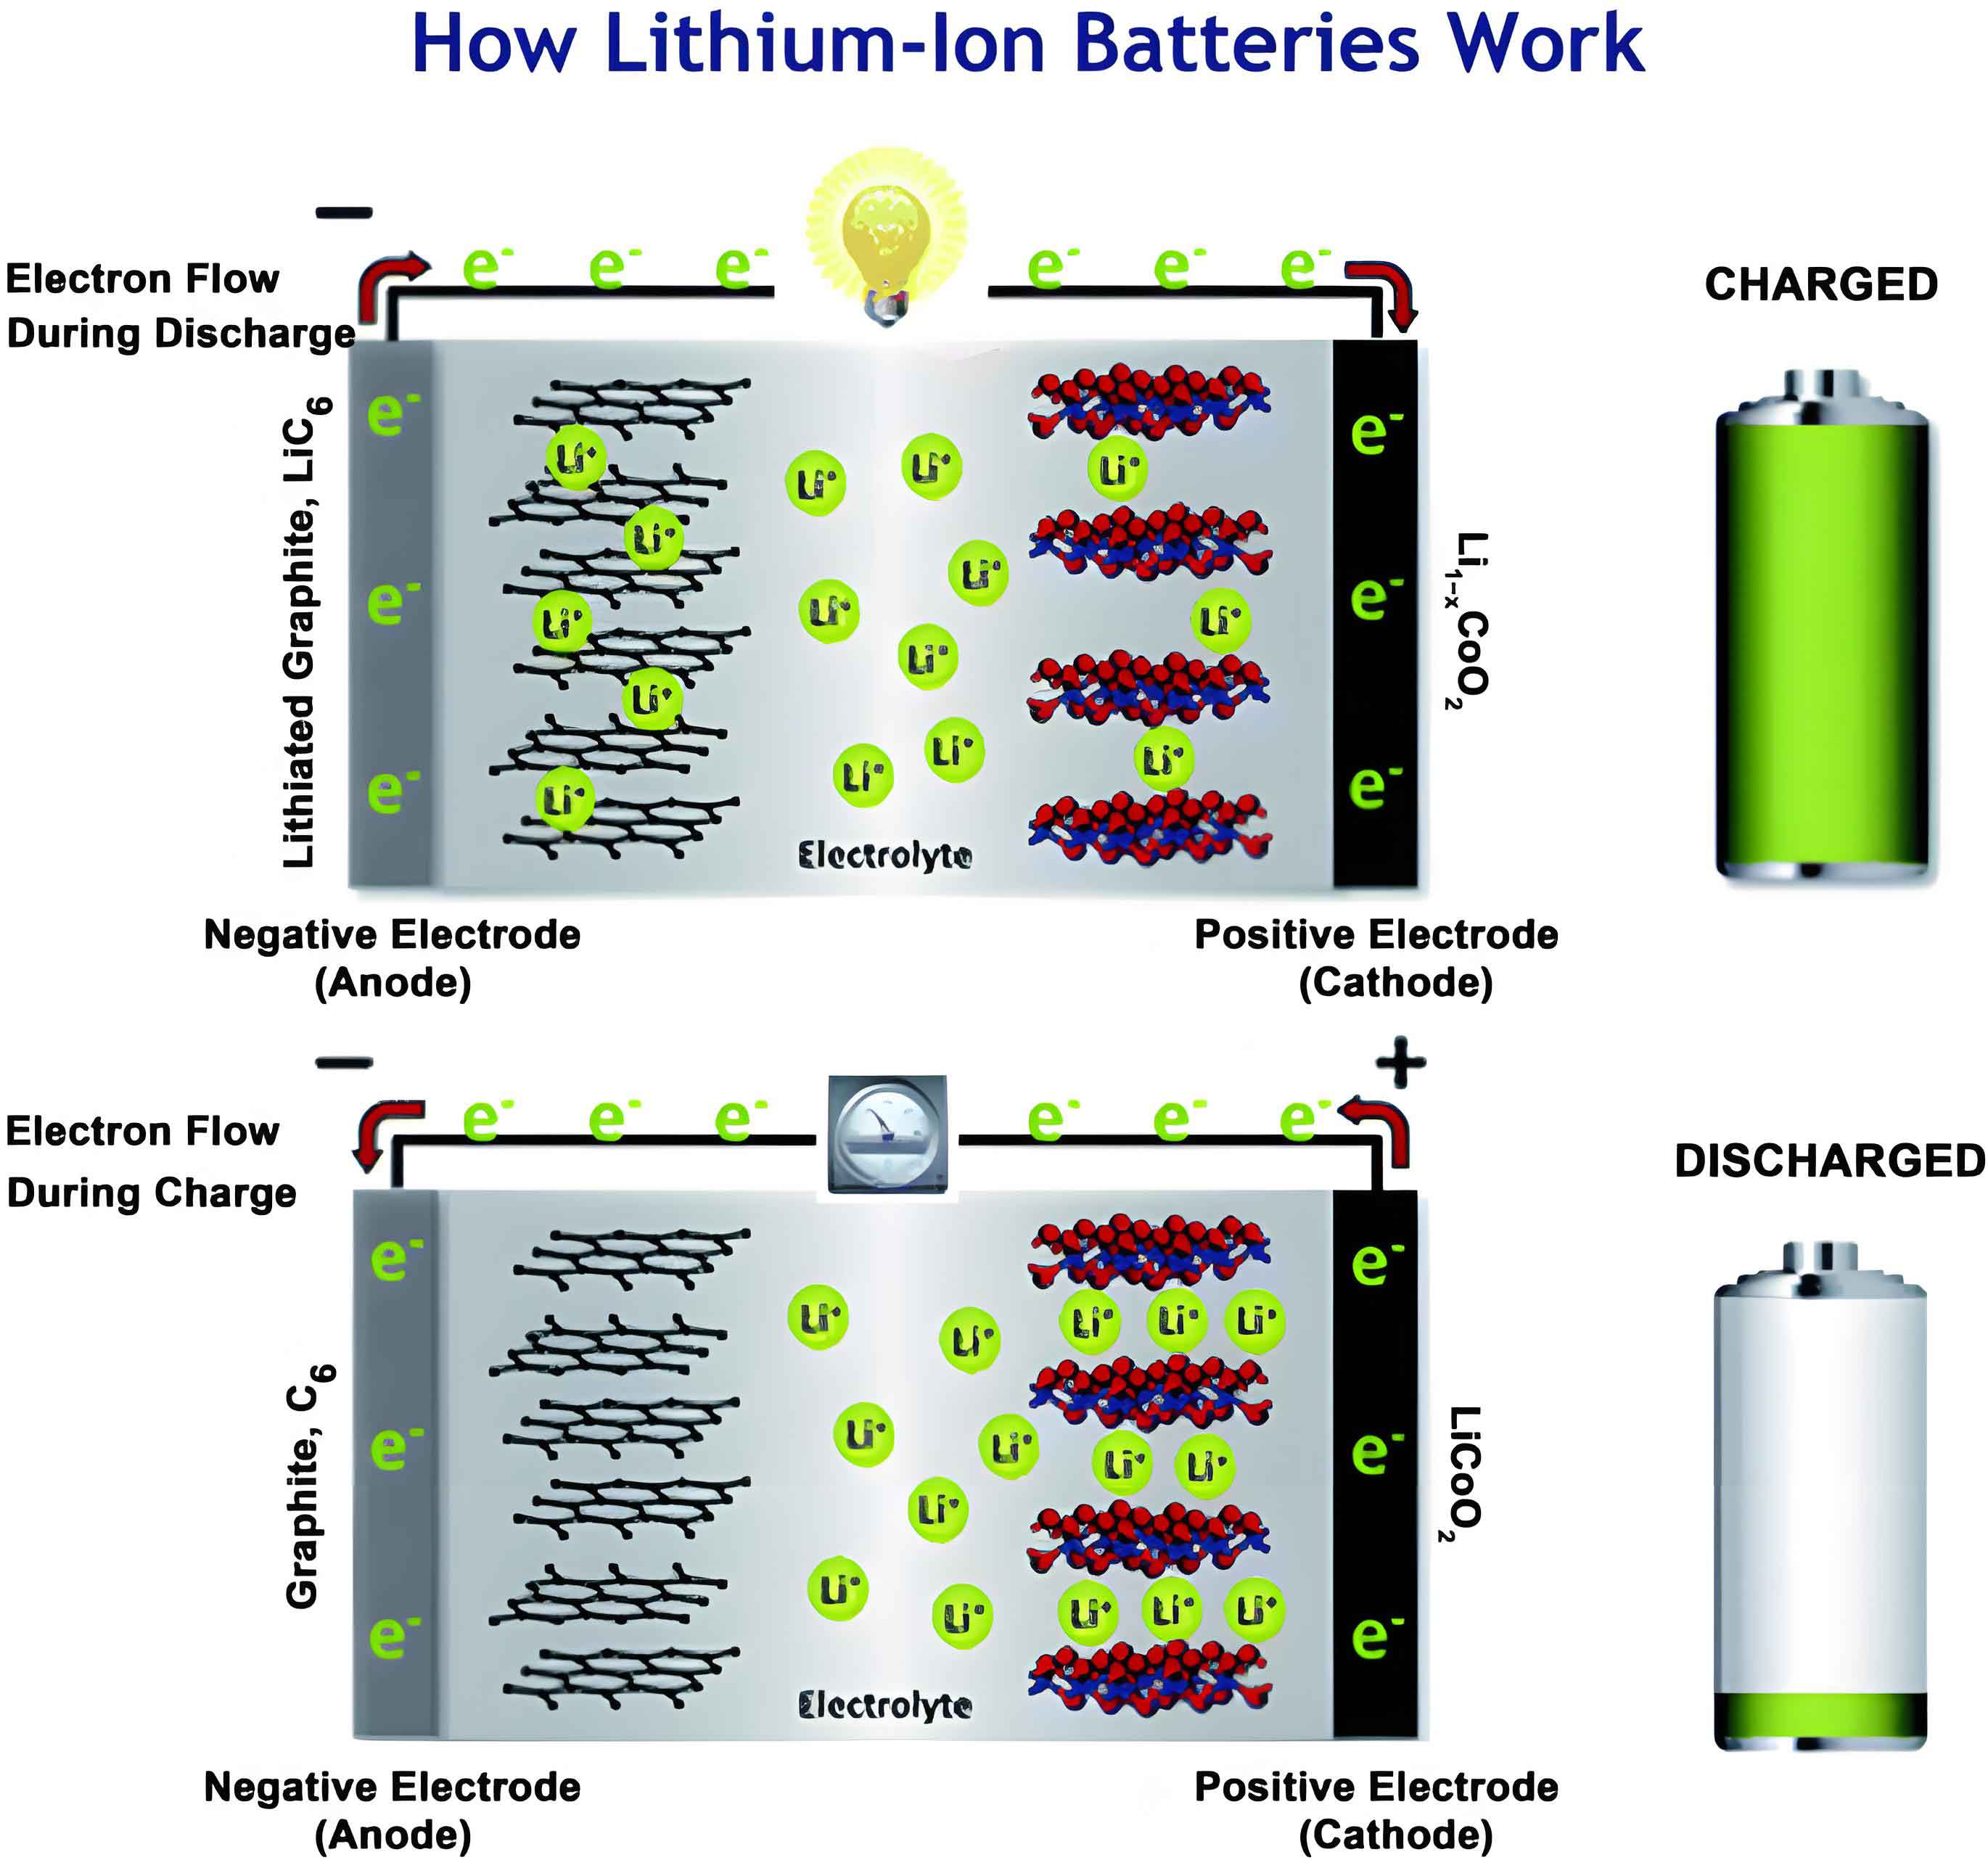
The SEI is a fascinating and complex nano-scale layer that forms during the initial cycles of a li ion battery. It is born from the electrochemical reduction of the electrolyte components at the anode surface, which is at a low potential versus lithium. This layer plays a paradoxical role: it is electronically insulating, which passivates the electrode and prevents further massive electrolyte decomposition, but it is ionically conductive, allowing lithium ions to shuttle through during cycling. This dual nature is essential for the stable operation of a graphite anode, as it prevents co-intercalation of solvent molecules that would exfoliate the graphite structure. However, this beneficial passivation comes at a cost. The SEI formation irreversibly consumes active lithium ions and electrolyte, leading to an initial capacity loss. More critically, the SEI is not a static, perfectly protective barrier. During long-term cycling, it continues to grow slowly, consuming more lithium and increasing the cell’s internal resistance. This ongoing growth is a primary driver of the gradual capacity fade observed over hundreds or thousands of cycles in a commercial li ion battery.
Understanding and controlling SEI growth is therefore paramount. While much research has focused on electrolyte engineering—using additives, novel salts, and solvents to form a more stable SEI—the intrinsic properties of the graphite anode material itself, particularly its particle size and morphology, exert a profound yet often under-quantified influence. Larger graphite particles present a different surface area, defect density, and stress profile compared to smaller ones, all of which can alter the nucleation, morphology, growth kinetics, and mechanical stability of the SEI layer. Experimentally probing these nano-scale, interface-limited processes in real-time is exceptionally challenging. This is where physics-based mathematical modeling becomes an indispensable tool. By constructing a reliable electrochemical model that couples SEI growth kinetics with standard cell operation, we can virtually “observe” the long-term evolution of the SEI, quantify its impact on capacity, and isolate the effect of specific design parameters like particle size.
In this work, I develop and employ a one-dimensional aging model for a graphite-LiFePO4 li ion battery to systematically investigate the impact of graphite anode particle size on capacity fading and SEI film growth. The model integrates the well-established pseudo-two-dimensional (P2D) framework for cell electrochemistry with a lumped-parameter kinetic model for the solvent reduction reaction responsible for SEI growth. This approach allows me to simulate thousands of charge-discharge cycles and analyze how different micro-scale graphite structures influence nano-scale interface phenomena and, consequently, macro-scale battery lifetime.
Modeling Framework and Governing Equations
To simulate the behavior of a li ion battery, I base my work on the Newman P2D model, which is the standard continuum approach for simulating lithium-ion cell performance. The model resolves lithium concentration and potential in the solid electrode particles (spherical diffusion) and the electrolyte phase across the one-dimensional cell sandwich (negative electrode, separator, positive electrode). For this study, the positive electrode (LiFePO4) and separator domains use standard equations and parameters from literature. The key extension for aging simulation lies in the treatment of the negative graphite electrode.
At the graphite electrode, the total local charge-transfer current density is the sum of the main intercalation reaction current and a side reaction current. This side reaction is the reduction of the electrolyte solvent (e.g., ethylene carbonate), which forms the SEI layer products. The reaction can be schematically represented as:
$$\text{S} + \text{Li}^+ + e^- \rightarrow \text{P}_{\text{SEI}}$$
where S is the solvent molecule and PSEI represents the solid reduction products that constitute the SEI layer. This reaction irreversibly consumes cyclable lithium ions, leading to capacity fade.
Modeling the detailed, complex chemistry of the SEI is prohibitive. Therefore, I adopt a pragmatic, lumped-parameter kinetic model for the side reaction current density \(i_{\text{SEI}}\). This model accounts for the fact that SEI growth occurs both on covered, intact surfaces of graphite particles and at cracks or defects that form due to particle volume changes during lithiation/delithiation. The expression is:
$$i_{\text{SEI}} = -\left(1 + H K_{\text{crd}}\right) J i_{1C} \exp\left(\frac{\alpha_{\text{SEI}} F \eta_{\text{SEI}}}{RT}\right) – Q_{\text{SEI}} f J i_{1C}$$
where:
- \(i_{1C}\) is the current density at 1C rate.
- \(\alpha_{\text{SEI}}\) is the charge transfer coefficient for the SEI formation reaction.
- \(\eta_{\text{SEI}}\) is the overpotential for the side reaction (assumed to have an equilibrium potential of 0 V vs. Li/Li+).
- \(F\), \(R\), \(T\) are Faraday’s constant, gas constant, and temperature, respectively.
- \(J\), \(H\), and \(f\) are dimensionless lumped parameters representing the exchange current density, graphite expansion factor, and SEI property factor.
- \(K_{\text{crd}}\) is a cracking factor, nonzero only during charging (lithiation) when graphite expands.
- \(Q_{\text{SEI}}\) is the local cumulative charge passed due to the side reaction.
The lumped parameters are defined as follows, linking microscopic properties to the empirical model:
$$J = \frac{\epsilon_{\text{cov}} i_0}{i_{1C}}, \quad H K_{\text{crd}} = \frac{a_{\text{crd}}}{\epsilon_{\text{cov}}}, \quad f = \frac{V i_{1C}^2}{\epsilon_{\text{cov}} (1-\epsilon_{\text{cov}}) c_{\text{EC}} D_{\text{eff}} F A^2}$$
Here, \(\epsilon_{\text{cov}}\) is the porosity of the SEI-covered area, \(i_0\) is a reference exchange current, \(a_{\text{crd}}\) is the specific surface area of cracked regions, \(V\) is the coulombic volume of SEI material, \(c_{\text{EC}}\) is the electrolyte concentration, \(D_{\text{eff}}\) is the effective diffusion coefficient of solvent in the SEI, and \(A\) is the electrode area.
The local accumulation of SEI products, \(c_{\text{SEI}}\) (mol m-3), is governed by:
$$\frac{\partial c_{\text{SEI}}}{\partial t} = – \frac{\nu_{\text{SEI}} i_{\text{SEI}}}{n F}$$
where \(\nu_{\text{SEI}}\) is the stoichiometric coefficient. This concentration directly determines the SEI layer thickness \(\delta\) and its resistance \(R_{\text{SEI}}\):
$$\delta = \frac{c_{\text{SEI}} M_{\text{SEI}}}{a_n \rho_{\text{SEI}}} + \delta_0, \quad R_{\text{SEI}} = \frac{\delta}{\kappa_{\text{SEI}}}$$
where \(M_{\text{SEI}}\) and \(\rho_{\text{SEI}}\) are the molar mass and density of the SEI, \(\delta_0\) is its initial thickness, \(\kappa_{\text{SEI}}\) is its electronic conductivity, and \(a_n\) is the specific surface area of the negative electrode, crucially dependent on the particle radius \(r_{p,n}\):
$$a_n = \frac{3 \epsilon_n}{r_{p,n}}$$
where \(\epsilon_n\) is the electrode porosity.
The capacity fade is quantified by the relative remaining capacity \(Q\):
$$Q = \frac{Q_0 – Q_{\text{SEI}}}{Q_0}$$
where \(Q_0\) is the initial capacity of the fresh li ion battery and \(Q_{\text{SEI}}\) is the total charge lost to the SEI side reaction.
The model parameters used in this simulation are summarized in the table below. The parameters for the main cell operation (LiFePO4 positive electrode, separator) are standard, while the SEI growth parameters are based on fitting to experimental aging data from literature, ensuring the model’s predictive capability for capacity fade.
| Parameter | Symbol | Value | Unit |
|---|---|---|---|
| SEI Charge Transfer Coefficient | \(\alpha_{\text{SEI}}\) | 0.69 | – |
| Graphite Expansion Factor | \(H\) | 11 | – |
| Exchange Current Parameter | \(J\) | 1.9 × 10⁻⁴ | – |
| SEI Property Parameter | \(f\) | 1.1 × 10³ | s-1 |
| SEI Molar Mass | \(M_{\text{SEI}}\) | 0.16 | kg mol-1 |
| SEI Density | \(\rho_{\text{SEI}}\) | 1600 | kg m-3 |
| Initial SEI Thickness | \(\delta_0\) | 1 | nm |
| SEI Electronic Conductivity | \(\kappa_{\text{SEI}}\) | 5 × 10⁻⁶ | S m-1 |
| Temperature | \(T\) | 298.15 | K |
The simulation protocol involves repeated 1C constant-current/constant-voltage charge followed by 1C constant-current discharge cycles. To make long-term aging simulations computationally feasible, each simulated cycle is considered to represent the averaged aging over 250 real cycles. I simulate a total of 4250 such representative cycles to observe significant capacity fade.
Simulation Results: The Particle Size Effect on Battery Aging
I investigate the impact of graphite particle size by simulating batteries with four different negative electrode particle radii: \(r_p = 5, 10, 15,\) and \(20 \ \mu\text{m}\). These values span the typical range for commercial graphite materials used in li ion battery manufacturing.
Capacity Fade and Voltage Hysteresis
The primary indicator of li ion battery health is its deliverable capacity. Figure 1 shows the simulated discharge voltage profiles for the first and the last (4250th) cycle for the different particle sizes. A clear trend emerges: batteries with larger anode particles exhibit lower operating voltages and a more pronounced voltage drop at the end of discharge, especially after aging. This is a direct consequence of increased internal polarization due to a thicker SEI layer and the associated rise in resistance.
The capacity fade curves, plotting the relative capacity \(Q\) against cycle number, are shown in Figure 2. Two critical observations are evident. First, the capacity fade is most rapid during the initial cycles for all sizes. This corresponds to the primary SEI formation stage, where the passivating layer is first established on the fresh graphite surface, consuming a significant amount of lithium. Second, and most importantly, the particle size has a dramatic effect on the long-term aging rate. The battery with the largest particles (20 μm) experiences the fastest capacity loss, while the one with the smallest particles (5 μm) degrades the slowest. After 4250 cycles, the relative capacity retention differs significantly across the sizes. This quantifies a fundamental design trade-off: larger particles, while potentially offering higher electrode density and energy density, compromise cycle life due to accelerated SEI-driven aging.
SEI Film Growth and Side Reaction Kinetics
To understand the root cause of the differential capacity fade, I examine the evolution of the SEI layer itself. Figure 3 shows the growth of SEI thickness \(\delta\) over cycles. The SEI grows continuously in all cases, but the growth rate is strongly size-dependent. The SEI on the 20 μm particles thickens much more rapidly than on the 5 μm particles. This is directly linked to the side reaction current density \(i_{\text{SEI}}\), plotted in Figure 4. The side reaction rate is highest at the beginning and then decays, stabilizing at a lower, steady-state value. Crucially, the magnitude of this side reaction current is consistently higher for larger particles throughout the cycling history.
The underlying mechanism can be traced to the interplay of surface area and SEI stability. The specific surface area \(a_n\) is inversely proportional to particle radius (\(a_n \propto 1/r_p\)). Smaller particles have a much larger total interfacial area with the electrolyte. While this might suggest more sites for SEI formation, the initial SEI formed on a high-area, small-particle electrode tends to be more uniform and passivating. Conversely, on larger particles, the initial SEI may be less perfect. More critically, the larger absolute volume change during lithiation of a big particle induces greater mechanical stress. This stress can cause cracks and defects in the existing SEI, constantly exposing fresh graphite surface to the electrolyte and perpetuating the solvent reduction reaction. This “crack-repair” cycle leads to faster cumulative SEI growth and lithium loss in a li ion battery with coarse graphite.
The electrical consequence of this thickening SEI is an increasing potential drop across it, \(\eta_{\text{SEI}}\). As shown in my simulations, this overpotential becomes more negative (larger in magnitude) for larger particles as cycling proceeds, directly increasing the cell’s polarization and reducing its usable voltage window, which aligns with the discharge curves in Figure 1.
| Particle Radius (μm) | Relative Capacity \(Q\) | SEI Thickness Increase \(\Delta \delta\) (nm) | Steady-State \(i_{\text{SEI}}\) (A m-2) | SEI Layer Potential Drop \(\eta_{\text{SEI}}\) (V) |
|---|---|---|---|---|
| 5 | 0.93 | ~12 | 2.4 | -0.094 |
| 10 | 0.90 | ~35 | 4.1 | -0.41 |
| 15 | 0.87 | ~65 | 7.0 | -0.66 |
| 20 | 0.84 | ~110 | 9.2 | -0.78 |
Probing the SEI Growth Mechanism: The Rate-Determining Step
A long-standing question in li ion battery research is the nature of the rate-determining step for SEI growth after the initial layer forms. Does the continuous growth rely on the tunneling of electrons from the graphite through the existing SEI to reduce solvents at the outer SEI/electrolyte interface? Or is it limited by the diffusion of solvent molecules through the porous SEI layer to the graphite/SEI interface where reduction occurs? My model provides a platform to test these hypotheses by varying key SEI transport properties.
First, I varied the electronic conductivity of the SEI layer \(\kappa_{\text{SEI}}\) over an order of magnitude. The simulated capacity fade curves showed negligible change. This indicates that electronic transport through the SEI is not the bottleneck for its growth in this model; the SEI is effectively an electronic insulator, and small changes in its already-low conductivity do not affect the reaction rate.
Second, I investigated the role of solvent transport by varying two related parameters: the effective diffusion coefficient of the solvent in the SEI (\(D_{\text{eff}}\)) and the SEI layer porosity (\(\epsilon_{\text{SEI}}\)), which influences \(D_{\text{eff}}\). The results were striking and are summarized conceptually below.
| Varied Parameter | Change | Effect on Capacity Fade | Interpretation |
|---|---|---|---|
| Electronic Conductivity (\(\kappa_{\text{SEI}}\)) | Increased 10x | Negligible | Electron transport is not rate-limiting. |
| Solvent Diffusion Coefficient (\(D_{\text{eff}}\)) | Decreased 10x | Fade rate significantly slowed | Slower solvent supply inhibits the side reaction. |
| SEI Porosity (\(\epsilon_{\text{SEI}}\)) | Decreased 2x | Fade rate slowed | Denser SEI impedes solvent diffusion to the reactive surface. |
When I reduced \(D_{\text{eff}}\), the capacity fade rate slowed down considerably. Similarly, reducing the SEI porosity \(\epsilon_{\text{SEI}}\), which makes the layer denser and less permeable, also decelerated aging. This provides strong computational evidence that the continuous growth of the SEI in an operating li ion battery is diffusion-limited. The rate-determining step is the inward diffusion of solvent molecules through the existing SEI film to the electrode surface (or to internal cracks/defects), not the outward conduction of electrons.
This insight has direct practical implications for optimizing the li ion battery negative electrode. It suggests that strategies which promote the formation of a dense, low-porosity SEI will be more effective in prolonging cycle life than those focused solely on electronic properties. This connects back to the particle size effect: finer graphite particles, when properly processed and calendared, can form electrodes with higher packing density and potentially facilitate the formation of a more uniform and less porous initial SEI. This denser SEI then acts as a better diffusion barrier, slowing down the long-term solvent reduction reaction. This explains why batteries with smaller graphite particles exhibit slower capacity fade in my simulations—their SEI layers, on average, present a more difficult diffusion path for the solvent.
Conclusion and Perspectives
Through systematic one-dimensional modeling of a graphite-LiFePO4 li ion battery, I have quantitatively elucidated the significant impact of anode particle size on capacity fading driven by Solid Electrolyte Interphase (SEI) growth. The key findings of this simulation study are:
- Particle Size is a Critical Design Parameter: Larger graphite particles lead to accelerated SEI thickening and a faster capacity fade rate, significantly reducing the usable cycle life of the li ion battery. This is attributed to higher mechanical stress-induced SEI cracking and a less effective initial passivation layer.
- Non-Linear Aging Dynamics: Capacity fade is most severe during the initial formation cycles but continues at a slower, steady-state rate governed by the ongoing SEI growth. The steady-state degradation rate is itself a function of the particle microstructure.
- Diffusion-Limited SEI Growth: The continuous growth of the SEI layer during long-term cycling is rate-limited by the transport of solvent molecules through the SEI film to the reactive electrode surface. Engineering a denser, less porous SEI layer is therefore a more effective strategy for mitigating aging than modulating its electronic conductivity.
This work provides a foundational understanding and a quantitative framework for optimizing graphite-based negative electrodes. It highlights that beyond electrolyte formulation, the physical structure of the active material—specifically, its particle size distribution and the resulting electrode porosity—must be carefully controlled to manage SEI growth and maximize the cycle life of a li ion battery. Future models could integrate more detailed descriptions of particle size distributions, explicit stress-strain coupling, and the evolution of SEI composition and porosity. Such advanced models would further empower the rational design of next-generation, long-life lithium-ion batteries for demanding applications.