
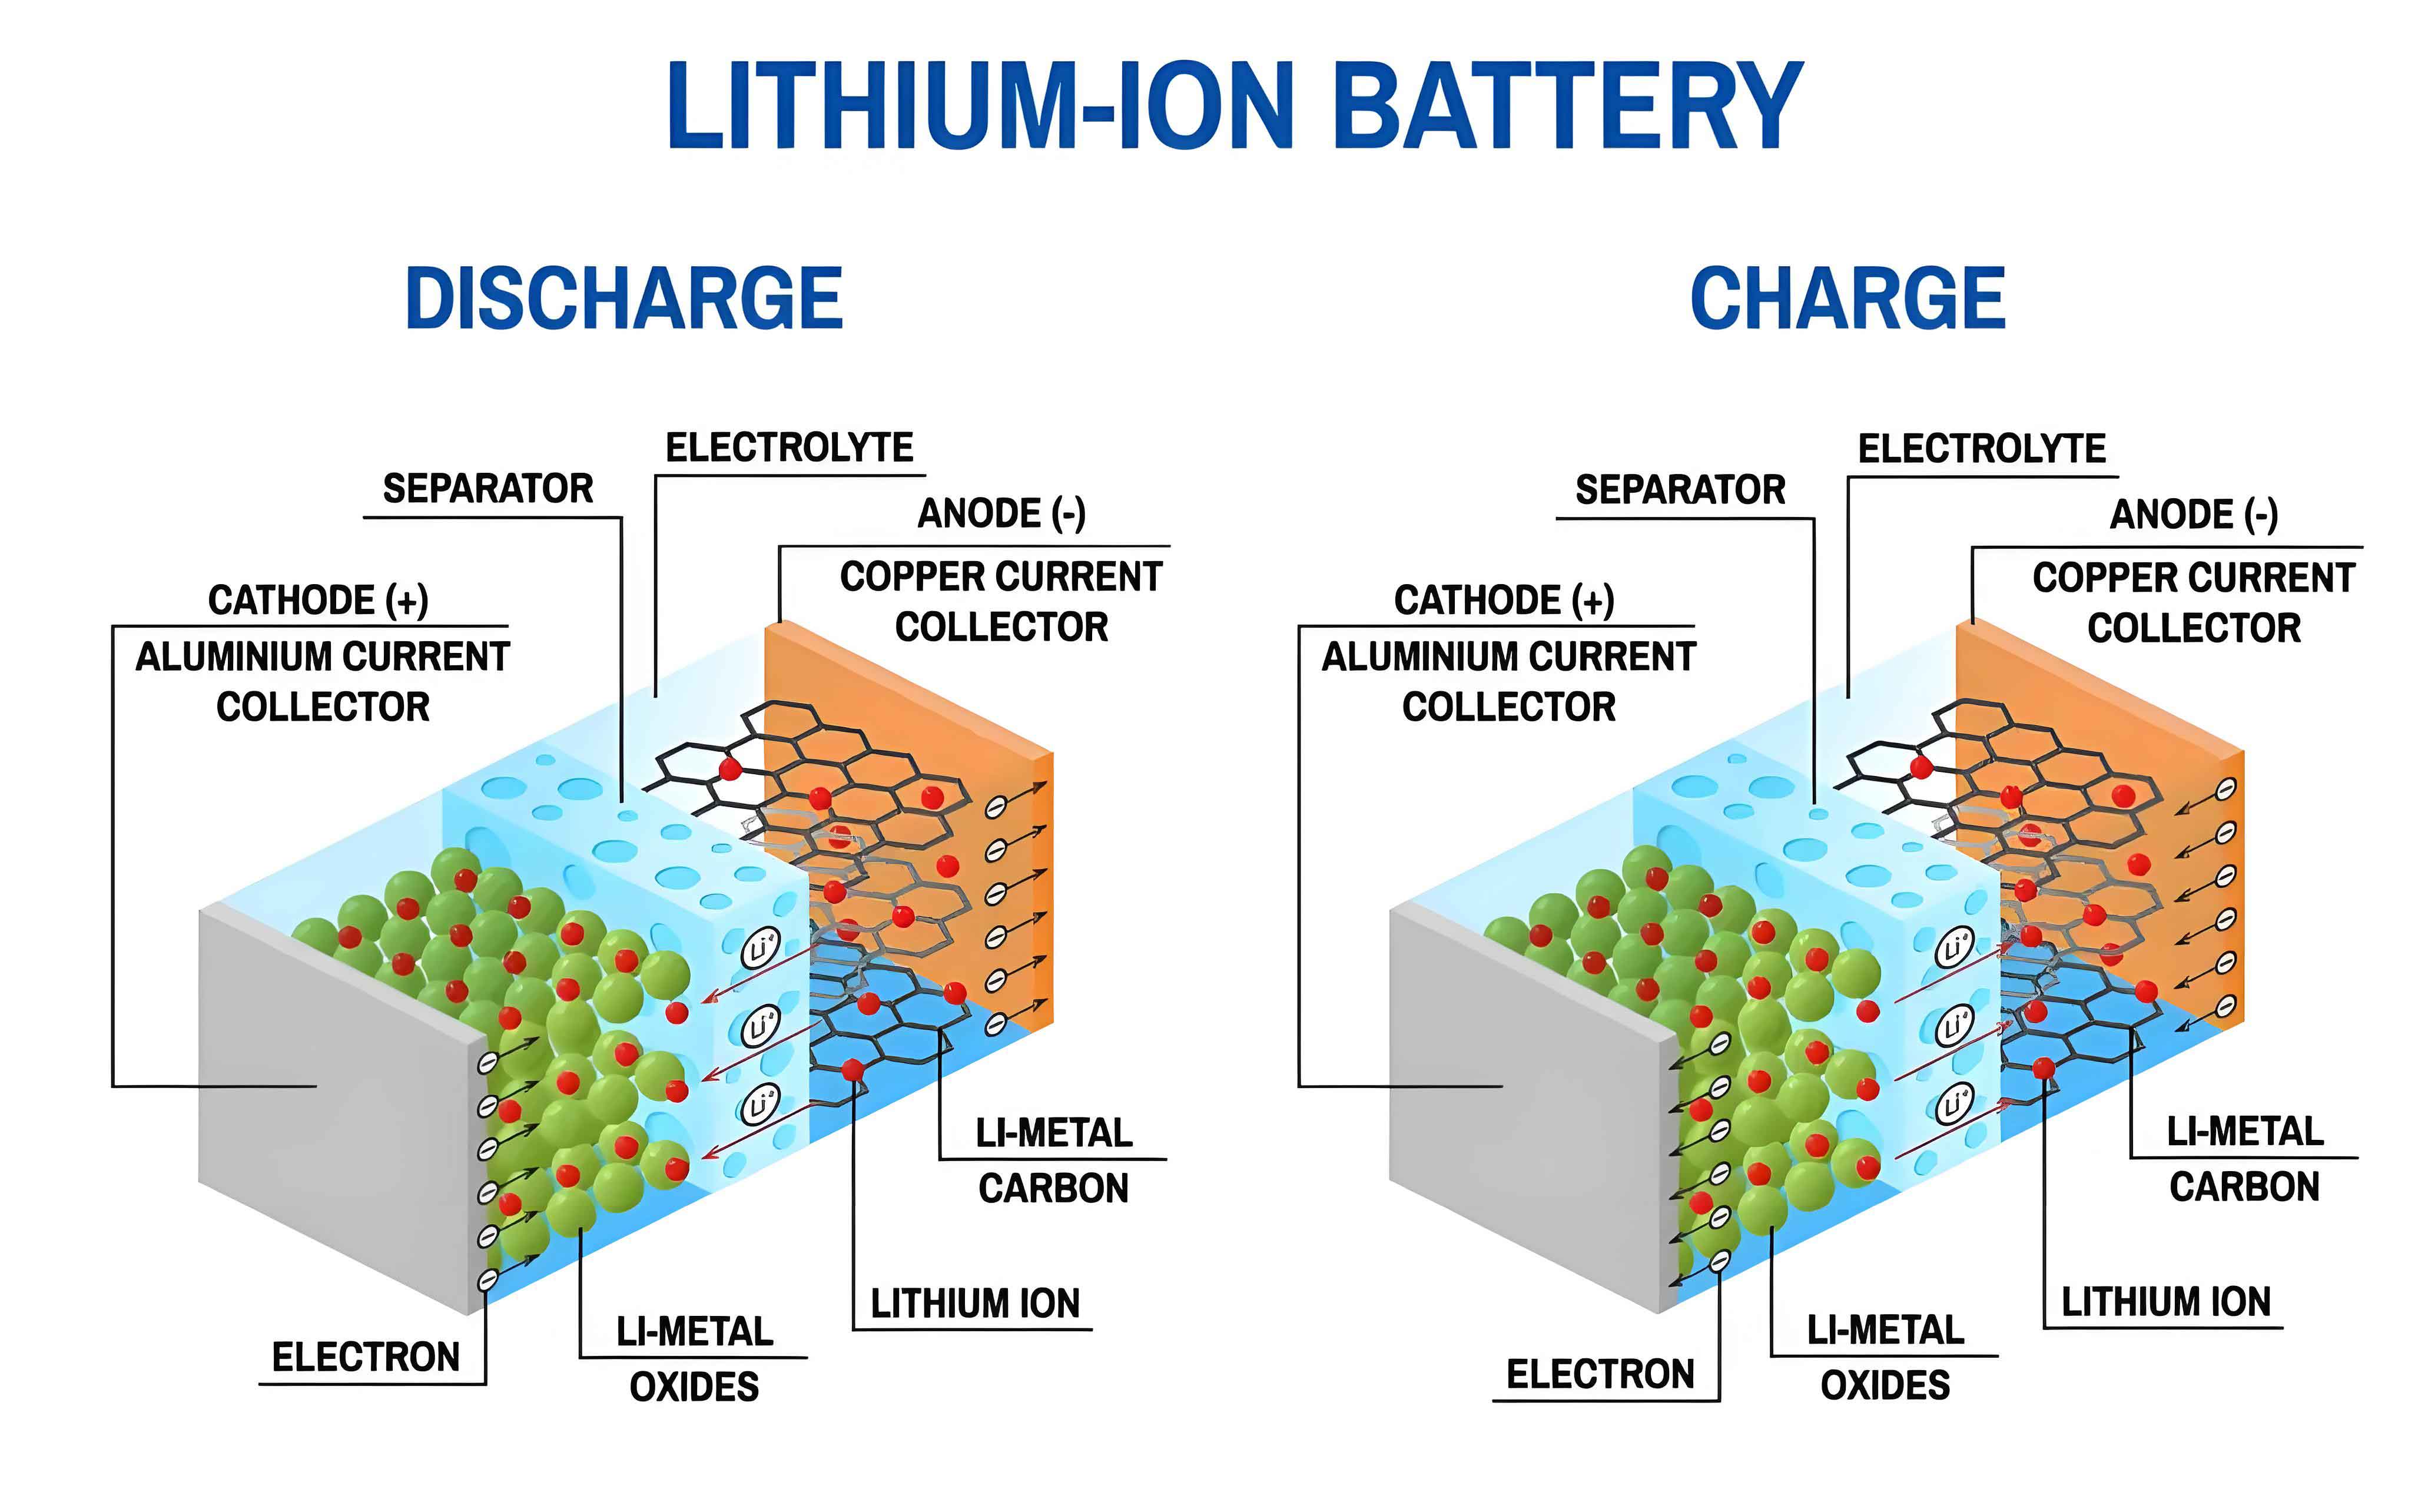
The accurate estimation of the State of Charge (SOC) is a critical parameter within Battery Management Systems (BMS) for ensuring the safe and efficient operation of systems powered by Li-ion batteries. During the charge and discharge cycles of a Li-ion battery, the intercalation and deintercalation of lithium ions induce structural changes within the electrode materials. These microscopic changes manifest as variations in macroscopic physical properties, most notably in mechanical characteristic parameters such as the Young’s modulus and density of the electrodes. These parameters are highly correlated with the battery’s SOC and can serve as a fundamental basis for evaluating internal structural evolution and performance degradation. However, existing methods struggle to non-destructively acquire these mechanical parameters under actual operating conditions. This study proposes a novel methodology for estimating the mechanical characteristic parameters of a Li-ion battery by fusing an acoustic homogenization model with a Particle Swarm Optimization (PSO) algorithm. Furthermore, these estimated mechanical features are integrated into a machine learning framework to achieve high-accuracy SOC estimation.
Theoretical Foundation and Acoustic Homogenization Model
Ultrasonic waves are sensitive to changes in the mechanical properties of materials. As a wave propagates through a medium, its velocity and attenuation are directly influenced by the material’s elastic modulus and density. For a Li-ion battery, which is a complex multi-layer structure comprising cathodes, anodes, separators, and current collectors, modeling each layer individually for finite element simulation is computationally intensive. To address this, an acoustic homogenization theory is applied. This approach simplifies the multi-layer composite structure into an effective, homogeneous medium with equivalent acoustic impedance. The key assumption is that the ultrasonic wavelength is significantly larger than the microstructural features like grain size and layer thickness, allowing the treatment of the battery as a continuum with effective properties.
The core of the homogenization lies in deriving the effective Young’s modulus ($$E_{eff}$$) and effective density ($$\rho_{eff}$$) for the entire Li-ion battery stack. Considering the force equilibrium in the direction of wave propagation and the volume fraction of each component, the overall effective Young’s modulus can be expressed as a volume-weighted average:
$$E_{eff} = \frac{\sum_{i=1}^{n} E_i v_i}{\sum_{i=1}^{n} v_i}$$
where $$E_i$$ is the Young’s modulus of the i-th layer material and $$v_i$$ is its volume fraction. Similarly, the overall effective density is calculated based on the mass and volume of each constituent:
$$\rho_{eff} = \frac{\sum_{i=1}^{n} \rho_i V_i}{\sum_{i=1}^{n} V_i}$$
where $$\rho_i$$ and $$V_i$$ are the density and volume of the i-th layer, respectively. The parameters for a typical LiCoO2/Graphite pouch cell used in the model are summarized in the table below.
| Material | Layers | Thickness (mm) | Young’s Modulus Range (GPa) | Density Range (g/cm³) |
|---|---|---|---|---|
| LiCoO2 (Cathode) | 34 | 0.045 | 145 – 228 | 4.80 – 5.15 |
| Graphite (Anode) | 34 | 0.060 | 22 – 93 | 2.26 – 2.50 |
| Aluminum Foil | 19 | 0.019 | 72 | 2.70 |
| Copper Foil | 17 | 0.023 | 119 | 8.90 |
| Separator | 34 | 0.008 | 2 | 1.80 |
| Polypropylene | 2 | 0.040 | 1 | 0.92 |
| Nylon | 2 | 0.025 | 2 | 1.15 |
This homogenized model, characterized by $$E_{eff}$$ and $$\rho_{eff}$$, is then used in finite element simulations to predict the ultrasonic wave propagation, specifically the transmitted waveform.
Experimental Setup and Ultrasonic Data Acquisition
To provide real-world data for the inverse estimation process, an ultrasonic testing platform for the Li-ion battery was constructed. Commercial 4.49 Ah LiCoO2 pouch cells were tested under controlled temperature conditions (25°C). The experimental setup integrated a high-precision battery cycler for applying charge/discharge profiles, an ultrasonic pulser-receiver, and a digital oscilloscope. Two 5 MHz piezoelectric transducers were coupled to opposite faces of the pouch cell to operate in through-transmission mode. The ultrasonic signals were acquired at one-minute intervals throughout complete charge-discharge cycles, which included Constant Current-Constant Voltage (CC-CV) charging and Constant Current (CC) discharging steps. The raw ultrasonic signals were then processed using a Savitzky-Golay filter to reduce noise while preserving waveform features.
From the acquired ultrasonic waveforms, two primary time-domain features were extracted: the Time-of-Flight (TOF), representing the wave propagation speed, and the Signal Amplitude (SA), representing the wave attenuation. These features exhibited clear, repeatable trends with respect to the SOC of the Li-ion battery, confirming the sensitivity of acoustic methods to the battery’s internal state.
Joint Simulation for Mechanical Parameter Estimation
The estimation of the Li-ion battery’s mechanical parameters is formulated as an inverse problem. The goal is to find the values of $$E_{eff}$$ and $$\rho_{eff}$$ for the homogenized model such that the simulated ultrasonic waveform best matches the experimentally measured waveform. This is achieved through a joint simulation framework combining finite element analysis (FEA) and an optimization algorithm.
A finite element model of the ultrasonic testing configuration was built, incorporating the homogenized Li-ion battery layer. The PSO algorithm was employed as the optimization engine due to its strong global search capability and fast convergence. The algorithm works by maintaining a swarm of particles (potential solutions), each representing a pair of $$(E_{eff}, \rho_{eff})$$ values. The position and velocity of each particle in the parameter space are updated iteratively based on its own best experience and the swarm’s best experience, as described by:
$$v_{id}^{k+1} = \omega v_{id}^{k} + c_1 r_1 (p_{id}^{k} – x_{id}^{k}) + c_2 r_2 (g_{d}^{k} – x_{id}^{k})$$
$$x_{id}^{k+1} = x_{id}^{k} + v_{id}^{k+1}$$
where, for particle $$i$$ and dimension $$d$$ (representing $$E_{eff}$$ or $$\rho_{eff}$$), $$v$$ is velocity, $$x$$ is position (parameter value), $$p$$ is the particle’s historical best position, and $$g$$ is the swarm’s historical best position. The parameters $$\omega$$, $$c_1$$, and $$c_2$$ are the inertia weight and learning factors, while $$r_1$$ and $$r_2$$ are random numbers.
In each iteration, for a given particle’s parameters, the FEA model is solved to generate a simulated waveform. The fitness of the particle is evaluated by calculating the Root Mean Square Error (RMSE) between the normalized simulated waveform and the normalized experimental waveform. The PSO algorithm iteratively seeks to minimize this RMSE. The process flow is as follows: the PSO suggests new $$(E_{eff}, \rho_{eff})$$ values, the acoustic model generates a corresponding simulated waveform, the error is computed, and the PSO updates the swarm until convergence. The final output is the optimal pair of $$E_{eff}$$ and $$\rho_{eff}$$ that best explains the experimental data.
Data Analysis and Results
Estimated Mechanical Characteristics
Applying the joint simulation to ultrasonic data captured at different SOC points yielded the evolution of the Li-ion battery’s mechanical parameters throughout a cycle. The results show a strong, non-linear correlation between SOC and the estimated parameters.
Overall Effective Young’s Modulus ($$E_{eff}$$): During charging, $$E_{eff}$$ increased monotonically with SOC. The increase was steeper in the early CC stage and gradually plateaued during the CV stage. This trend is attributed to the lithiation of the graphite anode. As lithium ions intercalate, the graphite layers experience compressive stress, increasing their stiffness. Since the anode’s modulus change dominates over the cathode’s, the overall effective modulus rises. The discharge process showed the opposite, symmetric trend. The relationship was fitted with a high degree of accuracy (R² > 0.995). An example empirical fitting equation for the charge phase is given by:
$$E_{eff,charge}(x_{soc}) = -2.2989e^{-0.445x_{soc}} – 2.2989e^{-0.4955x_{soc}} – 2.2989e^{-0.5451x_{soc}} + 103.14$$
where $$x_{soc}$$ is the SOC (0 to 1).
Overall Effective Density ($$\rho_{eff}$$): During charging, $$\rho_{eff}$$ decreased monotonically with SOC. This is primarily due to the volumetric expansion of the graphite anode upon lithiation. Although the mass increases slightly due to added lithium, the volume expansion is more significant, leading to a net decrease in density. Conversely, the delithiated cathode loses mass with nearly constant volume, also contributing to a lower density. Again, the discharge curve mirrored the charge curve. The fitted relationship was also highly accurate (R² > 0.998).
$$\rho_{eff,charge}(x_{soc}) = 0.11867e^{-0.5179x_{soc}} + 0.11867e^{-0.5755x_{soc}} + 0.11867e^{-0.6330x_{soc}} + 3.6426$$
Verification of the Estimation Method
To validate the reliability of the estimated parameters, the $$E_{eff}$$ and $$\rho_{eff}$$ values obtained for specific SOC points from one Li-ion battery (A1) were used to simulate waveforms. These simulated waveforms were then compared to the actual experimental waveforms from a second, identical Li-ion battery (A2) at the same SOC points. The high degree of吻合, as quantified by low Mean Square Error (MSE) and high R² values, confirmed the accuracy and generalizability of the inverse estimation method.
| SOC Point | Mean Square Error (MSE) | Determination Coefficient (R²) |
|---|---|---|
| 0.1 | 1.8% | 0.869 |
| 0.5 | 1.9% | 0.851 |
| 0.9 | 1.2% | 0.909 |
SOC Estimation Using Fusion of Mechanical Features
The estimated mechanical parameters, $$E_{eff}$$ and $$\rho_{eff}$$, represent high-level features intrinsically linked to the electrochemical state of the Li-ion battery. To leverage this, a data-driven SOC estimation model was developed using Gaussian Process Regression (GPR). GPR is a non-parametric, probabilistic model well-suited for small datasets and capable of providing uncertainty quantification. The model’s input features included not only conventional electrical measurements (voltage, current) and ultrasonic time-domain features (TOF, SA) but also the novel mechanical features ($$E_{eff}$$, $$\rho_{eff}$$).
The performance of the GPR model was compared against other common regression algorithms like Least Squares Estimation (LSE), Support Vector Machine (SVM), and Backpropagation Neural Network (BP). The inclusion of mechanical features significantly enhanced the SOC estimation accuracy across all models. The GPR model outperformed others, achieving the lowest error metrics.
| Algorithm | RMSE (%) | MAE (%) | ||
|---|---|---|---|---|
| Charge | Discharge | Charge | Discharge | |
| LSE | 5.63 | 8.52 | 5.02 | 7.19 |
| SVM | 3.28 | 2.17 | 2.19 | 1.67 |
| BP | 1.33 | 1.27 | 1.07 | 0.97 |
| GPR (Proposed) | 1.22 | 1.01 | 0.87 | 0.83 |
A key analysis involved ablating different feature sets to quantify the contribution of the mechanical features. Using only electrical features (2 features) resulted in the highest error. Adding ultrasonic time-domain features (4 features) improved accuracy. Finally, incorporating the estimated mechanical parameters (6 features) yielded the best performance, conclusively demonstrating their value for SOC estimation in a Li-ion battery.
| Number of Features | RMSE (%) | MAE (%) | ||
|---|---|---|---|---|
| Charge | Discharge | Charge | Discharge | |
| 2 (Electrical only) | 2.16 | 2.26 | 1.83 | 1.12 |
| 4 (Electrical + Ultrasonic) | 1.61 | 1.91 | 1.18 | 0.95 |
| 6 (All, with Mechanical) | 1.22 | 1.01 | 0.87 | 0.83 |
Validation Under Dynamic Operating Conditions
To evaluate practical applicability, the proposed methodology was tested under a Dynamic Stress Test (DST) profile, a complex power-demand sequence representative of real-world electric vehicle operation. The GPR model, trained on data from standard cycles and utilizing the full 6-feature set including the mechanical parameters estimated via the acoustic homogenization-PSO framework, was used for SOC estimation. The model demonstrated robust and accurate performance even under these dynamic conditions, with an RMSE of 1.92% and an MAE of 1.68%, confirming the reliability and real-world potential of the approach.
Conclusion
This study successfully developed and validated a non-destructive method for estimating the mechanical characteristic parameters of a Li-ion battery. By constructing an acoustic homogenization model and employing a Particle Swarm Optimization algorithm to solve the inverse problem, the overall effective Young’s modulus and density of the battery were accurately estimated solely from ultrasonic measurement data. These parameters exhibited a strong, quantifiable relationship with the battery’s State of Charge.
Furthermore, these mechanically-grounded features were proven to be highly valuable inputs for data-driven SOC estimation models. Integrating the estimated $$E_{eff}$$ and $$\rho_{eff}$$ with conventional features into a Gaussian Process Regression model significantly enhanced estimation accuracy compared to using electrical or standard ultrasonic features alone. The method maintained high accuracy under both standard and dynamic (DST) load profiles. This work provides a novel pathway for high-fidelity SOC estimation by unlocking and utilizing the rich mechanical state information embedded within acoustic signals, offering a promising direction for improving the perception and management capabilities of advanced BMS for Li-ion batteries.