
Effective thermal management is paramount for the safety, performance, and longevity of lithium-ion battery packs, especially in high-power applications. During operation, a li ion battery generates significant heat, and if not dissipated efficiently, it can lead to excessive temperatures, large temperature gradients, thermal runaway, and even catastrophic failure. This study proposes a novel bionic tree-like channel liquid cooling plate for managing the thermal behavior of a li ion battery module under high discharge rates.
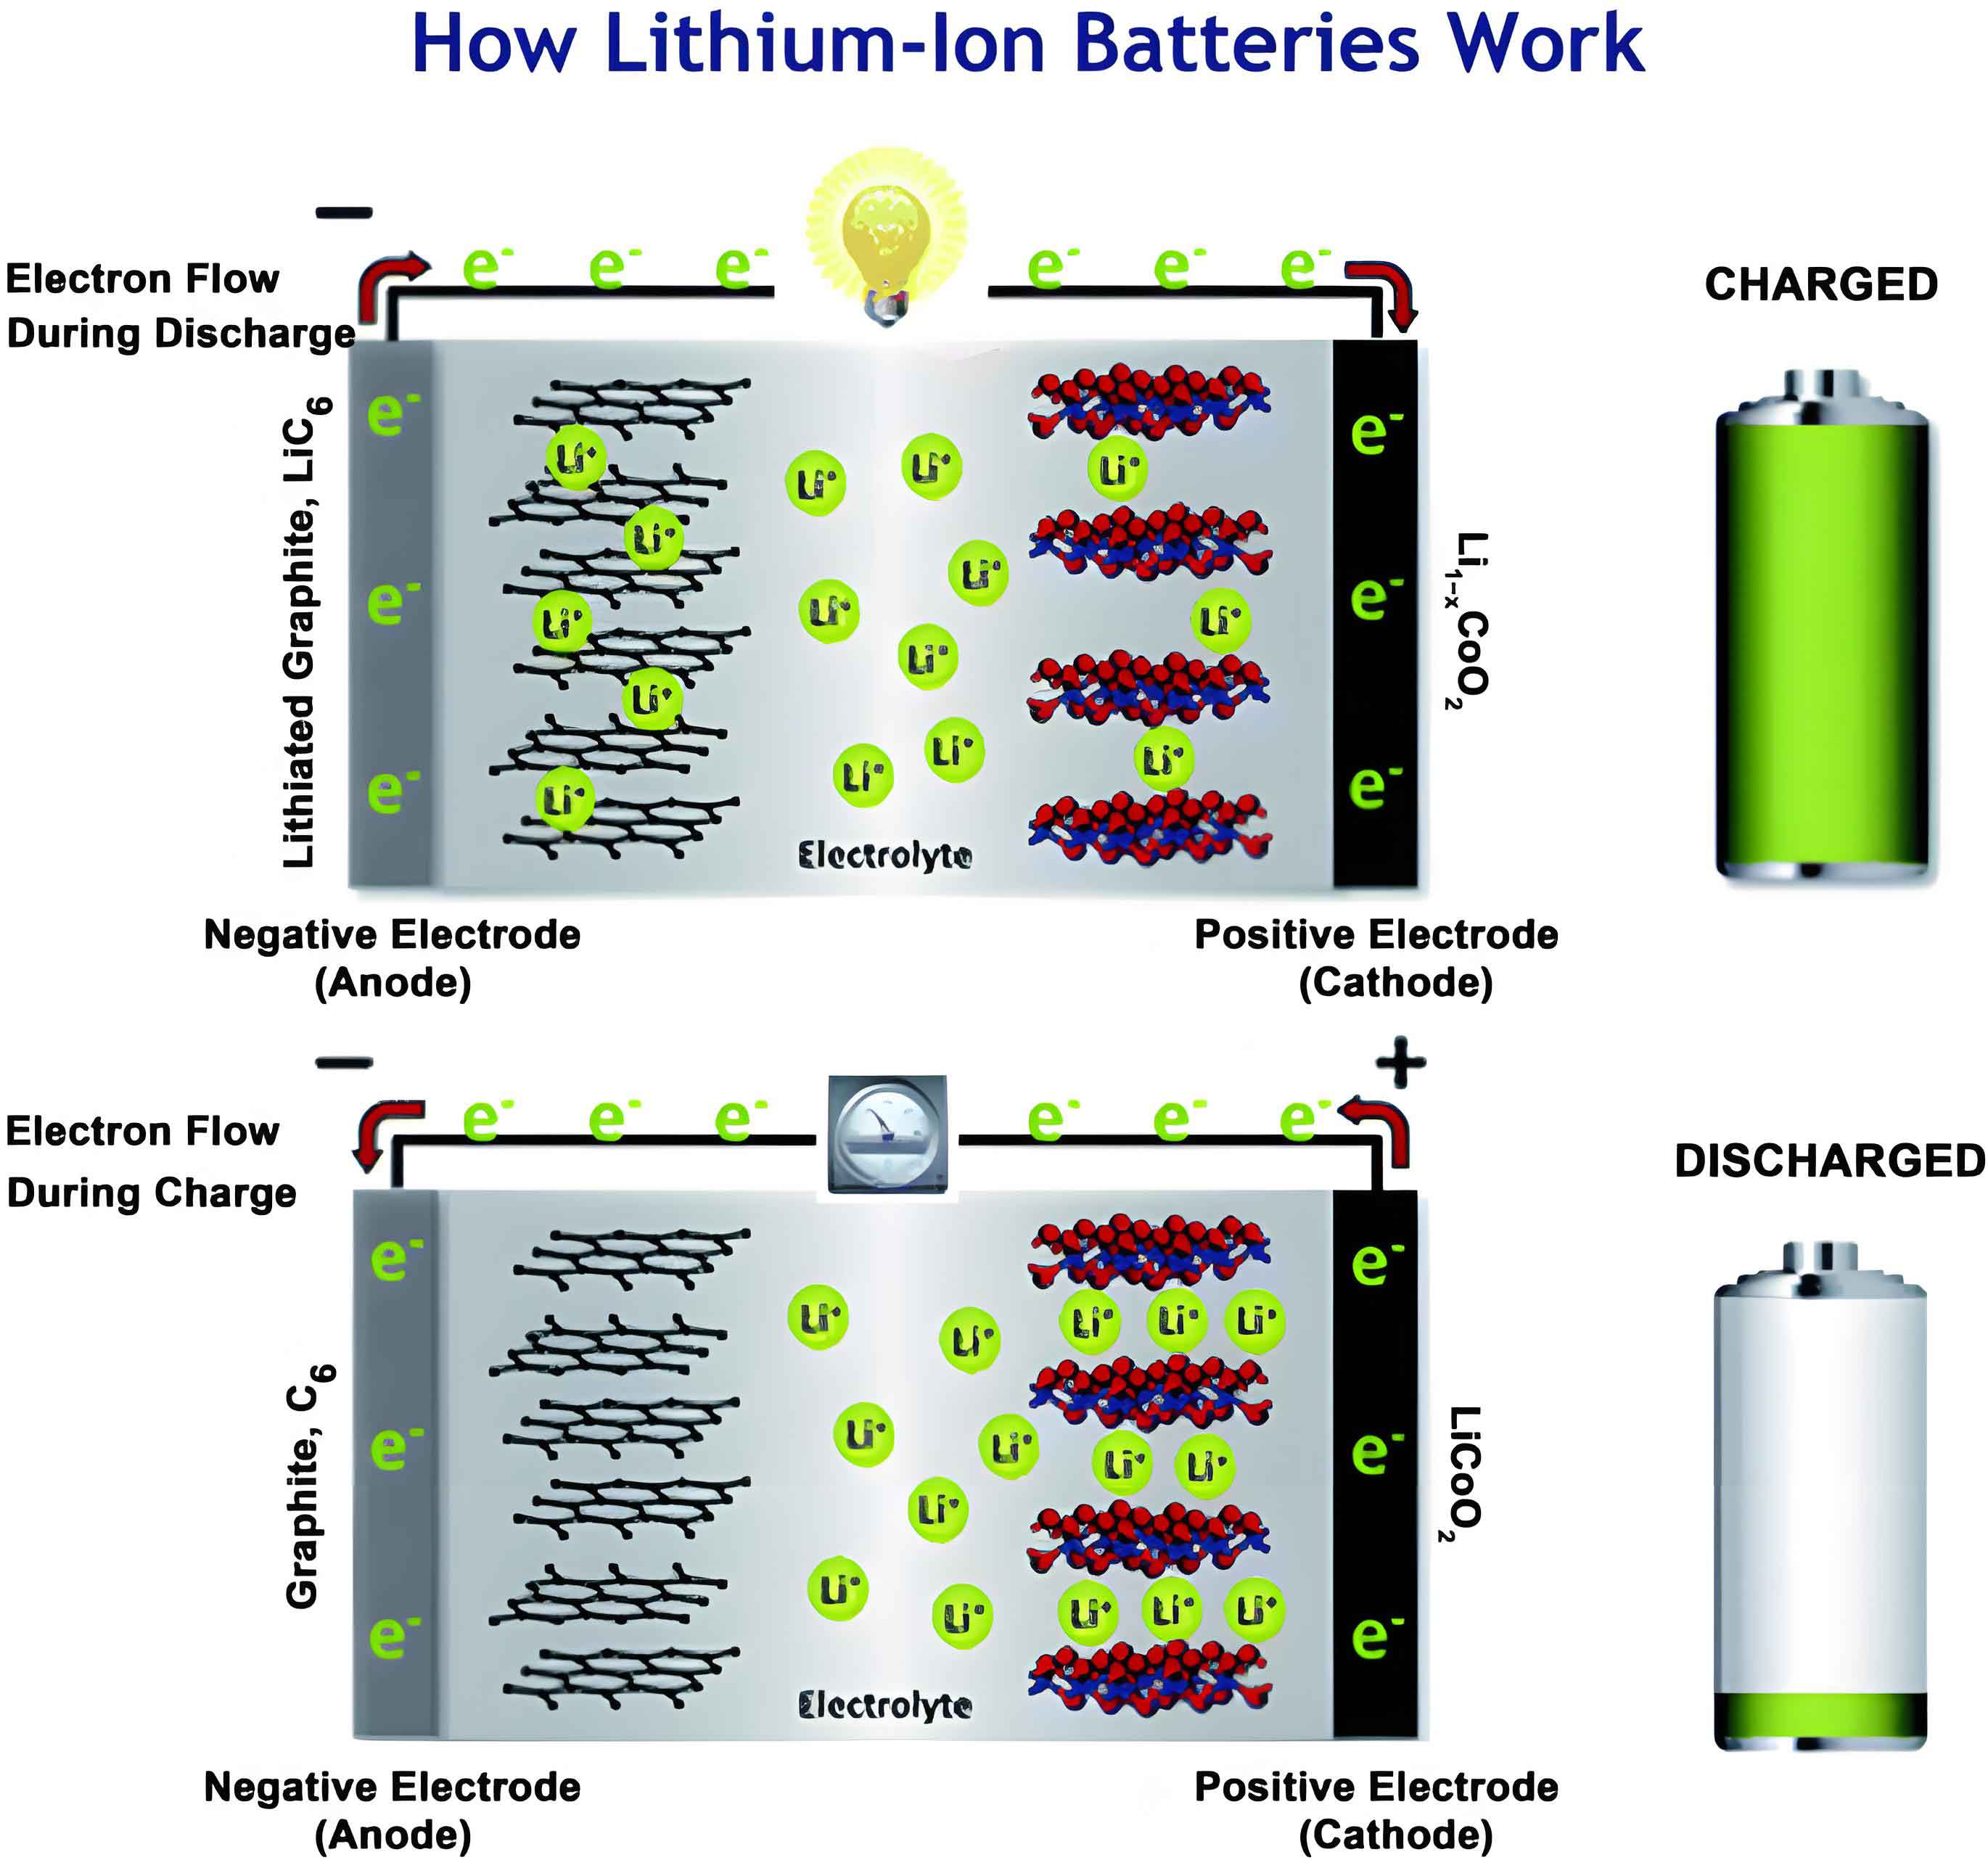
Our objective is to maintain the maximum temperature (Tmax) and maximum temperature difference (ΔT) of the li ion battery within safe limits of 313.15 K and 5 K, respectively, during a 5C discharge process in a 298.15 K ambient environment. We develop a three-dimensional numerical model incorporating a sandwiched cooling plate design. The thermal performance is evaluated by analyzing the influence of key geometric and operational parameters: the branch channel angle (θ), coolant inlet velocity (v), branch channel width (w), and cooling plate thickness (H). An orthogonal experimental design combined with range analysis is employed to identify the significance of these factors and determine the optimal configuration.
1. Geometric Model and Methodology
The battery module consists of eight prismatic lithium-ion cells interleaved with nine aluminum liquid cooling plates. To reduce computational cost while maintaining accuracy, a symmetric unit comprising half of two adjacent cells and one full cooling plate is established as the computational domain, with symmetry boundary conditions applied at the top and bottom surfaces. The dimensions of a single li ion battery are 118 mm (length) × 63 mm (width) × 13 mm (height). The cooling plate matches the battery’s length and width. The proposed biomimetic tree-like channel network is designed within the plate, featuring a main trunk that bifurcates into progressively smaller branches, inspired by natural flow structures like leaf veins and blood vessels that follow Murray’s law for optimal flow distribution.
The thermo-physical properties of the materials used in the simulation are summarized in Table 1. Water is selected as the coolant for its favorable thermal properties.
| Material | Density, ρ (kg/m³) | Thermal Conductivity, k (W/m·K) | Specific Heat Capacity, Cp (J/kg·K) | Dynamic Viscosity, μ (Pa·s) |
|---|---|---|---|---|
| Lithium-ion Battery | 2450 | 3.9 (isotropic) | 1108 | – |
| Aluminum (Plate) | 2719 | 202.4 | 871 | – |
| Water (Coolant) | 998.2 | 0.6 | 4182 | 0.001003 |
2. Governing Equations and Numerical Setup
The cooling process involves conjugate heat transfer. The flow of coolant (water) is assumed to be incompressible, steady, and laminar (Re < 2300). The governing equations for mass, momentum, and energy conservation in the fluid domain are given below.
Continuity Equation:
$$ \nabla \cdot (\rho_l \mathbf{u}) = 0 $$
Momentum Equation:
$$ \rho_l (\mathbf{u} \cdot \nabla) \mathbf{u} = -\nabla p + \mu \nabla^2 \mathbf{u} $$
Energy Equation for the coolant:
$$ \rho_l c_{p,l} (\mathbf{u} \cdot \nabla T_l) = k_l \nabla^2 T_l $$
where \(\mathbf{u}\) is the velocity vector, \(p\) is the pressure, \(T_l\) is the coolant temperature, and \(\rho_l\), \(c_{p,l}\), \(k_l\), and \(\mu\) are the density, specific heat, thermal conductivity, and dynamic viscosity of the coolant, respectively.
The solid domains (battery and aluminum plate) solve only the energy equation:
$$ \nabla \cdot (k_s \nabla T_s) + \dot{q}_{gen} = 0 $$
For the li ion battery, a uniform volumetric heat generation rate \(\dot{q}_{gen}\) of 240,000 W/m³ is applied, corresponding to a 5C discharge rate. This model was validated against established literature, showing excellent agreement for battery temperature rise.
The pressure drop across the cooling plate is calculated as:
$$ \Delta P = f \frac{L}{D_h} \frac{\rho_l u_{in}^2}{2} + \sum_i \xi_i \frac{\rho_l u_i^2}{2} $$
where \(f\) is the friction factor, \(L\) is the channel length, \(D_h\) is the hydraulic diameter, \(u_{in}\) is the inlet velocity, and \(\xi_i\) represents local loss coefficients at bends and bifurcations.
The convective heat transfer rate from the battery to the coolant is:
$$ q_{conv} = h A (T_w – T_l) $$
where \(h\) is the convective heat transfer coefficient, \(A\) is the contact area, and \(T_w\) is the wall temperature.
Boundary Conditions: The coolant inlet is set to a velocity inlet condition with a temperature of 298.15 K. The outlet is a pressure-outlet at 0 Pa gauge pressure. External battery surfaces experience natural convection with an ambient temperature of 298.15 K and a heat transfer coefficient of 5 W/m²·K. Symmetry conditions are applied on the cut faces of the half-batteries.
Grid Independence and Model Validation: A grid independence study was conducted, resulting in the selection of a mesh with approximately 560,000 cells, which ensured results were independent of further mesh refinement (temperature variation < 0.1 K). The numerical approach for liquid cooling was further validated against experimental data for a microchannel heat sink, yielding a maximum relative error of less than 4% for the temperature profile along the base, confirming the reliability of our simulation methodology for modeling the li ion battery cooling system.
3. Results and Discussion: Parametric Analysis
We first investigate the individual effects of four key parameters on the cooling performance, quantified by the maximum temperature (Tmax) and maximum temperature difference (ΔT) of the li ion battery.
3.1 Effect of Branch Channel Angle (θ)
The branch angle significantly influences the flow distribution and heat transfer area. As θ increases from 30° to 80°, both Tmax and ΔT increase. The optimal thermal performance was found at θ = 30°, yielding Tmax = 306.2 K and ΔT = 6.7 K. While Tmax remained within the safe limit for all angles, ΔT exceeded 5 K. The temperature increases because a larger angle reduces the effective heat exchange area between the coolant channels and the battery surface, hindering efficient heat removal. The pressure drop also slightly increases with angle, as shown in Table 2.
| Angle, θ (°) | Tmax (K) | ΔT (K) | Pressure Drop, ΔP (Pa) |
|---|---|---|---|
| 30 | 306.2 | 6.7 | 40.4 |
| 40 | 306.8 | 7.3 | 42.9 |
| 50 | 307.4 | 7.9 | 43.9 |
| 60 | 307.7 | 8.4 | 44.2 |
| 70 | 307.8 | 8.5 | 44.7 |
| 80 | 307.8 | 8.6 | 44.9 |
3.2 Effect of Coolant Inlet Velocity (v)
The inlet velocity is a critical operational parameter. Increasing v enhances convective cooling, thereby reducing both Tmax and ΔT. However, this improvement follows a law of diminishing returns. As shown in Table 3, a dramatic reduction in temperature occurs when v increases from 0.04 m/s to 0.16 m/s (ΔTmax ≈ 9.2 K). Further increasing v to 0.24 m/s provides only marginal additional cooling (ΔTmax ≈ 1.3 K) but causes the pressure drop to surge, directly impacting pumping power. The relationship can be expressed through the dependence of the Reynolds number and Nusselt number on velocity:
$$ Re = \frac{\rho_l v D_h}{\mu} \propto v $$
$$ Nu \propto Re^{n}Pr^{m} $$
where \(n\) and \(m\) are constants. Initially, increasing v significantly raises Re and thus the average heat transfer coefficient. At higher velocities, the thermal resistance becomes increasingly dominated by conduction within the battery and plate rather than convection, limiting further gains.
| Velocity, v (m/s) | Tmax (K) | ΔT (K) | Pressure Drop, ΔP (Pa) |
|---|---|---|---|
| 0.04 | 313.9 | 15.3 | 14.0 |
| 0.08 | 309.2 | 10.1 | 32.5 |
| 0.12 | 307.2 | 7.8 | 55.4 |
| 0.16 | 306.2 | 6.9 | 82.8 |
| 0.20 | 305.4 | 6.2 | 114.3 |
| 0.24 | 304.9 | 5.8 | 149.2 |
3.3 Effect of Branch Channel Width (w)
Varying the channel width primarily affects the flow cross-sectional area and the conductive path through the plate’s solid ribs. Results indicate that the thermal performance is relatively insensitive to changes in w beyond 2 mm for this design, as shown in Table 4. Increasing w from 1 mm to 2 mm slightly improves cooling by increasing coolant flow area and reducing flow resistance. However, further width increases provide negligible benefit because the concomitant reduction in the solid fin material between channels begins to impede lateral heat conduction from the battery to the coolant. The main impact of increasing w is a consistent decrease in system pressure drop.
| Width, w (mm) | Tmax (K) | ΔT (K) | Pressure Drop, ΔP (Pa) |
|---|---|---|---|
| 1.0 | 306.4 | 7.2 | 45.4 |
| 1.5 | 306.3 | 7.0 | 44.1 |
| 2.0 | 306.2 | 6.7 | 43.4 |
| 2.5 | 306.2 | 6.7 | 43.2 |
| 3.0 | 306.1 | 6.6 | 42.7 |
| 3.5 | 306.1 | 6.5 | 41.7 |
3.4 Effect of Cooling Plate Thickness (H)
The plate thickness is equivalent to the channel height in this model. Increasing H has the most pronounced effect on improving the cooling performance of the li ion battery system. As H increases, the coolant mass flow rate for a given inlet velocity rises proportionally (\( \dot{m} \propto H \)), allowing more heat to be carried away. Furthermore, a larger H increases the internal flow cross-section, reducing flow velocity and pressure drop for the same volumetric flow rate. Table 5 shows that increasing H from 1 mm to 2.5 mm reduces Tmax by 5.8 K and ΔP by 66.6 Pa. The rate of improvement diminishes for H > 2.5 mm as the system approaches a limit where the battery’s internal thermal conductivity and the external convection become the dominant resistances.
| Thickness, H (mm) | Tmax (K) | ΔT (K) | Pressure Drop, ΔP (Pa) |
|---|---|---|---|
| 1.0 | 311.4 | 12.1 | 101.7 |
| 1.5 | 308.5 | 8.9 | 60.9 |
| 2.0 | 306.2 | 6.7 | 43.4 |
| 2.5 | 305.6 | 6.2 | 35.1 |
| 3.0 | 305.1 | 5.8 | 31.0 |
| 3.5 | 304.8 | 5.6 | 27.4 |
| 4.0 | 304.6 | 5.4 | 25.3 |
4. Orthogonal Experiment and Optimization
To systematically determine the optimal combination of parameters and their relative importance, an L16(44) orthogonal array was designed. The four factors (A: θ, B: v, C: w, D: H) were each tested at four levels. The response variables were Tmax and ΔT of the li ion battery. The experimental layout and results are presented in Table 6.
| Exp. No. | A: Angle (°) | B: Velocity (m/s) | C: Width (mm) | D: Thickness (mm) | Tmax (K) | ΔT (K) |
|---|---|---|---|---|---|---|
| 1 | 30 | 0.06 | 1.5 | 1 | 316.6 | 17.0 |
| 2 | 30 | 0.10 | 2.0 | 2 | 306.2 | 6.9 |
| 3 | 30 | 0.14 | 2.5 | 3 | 303.7 | 4.5 |
| 4 | 30 | 0.18 | 3.0 | 4 | 303.6 | 4.4 |
| 5 | 45 | 0.06 | 2.0 | 3 | 307.3 | 7.9 |
| 6 | 45 | 0.10 | 1.5 | 4 | 303.9 | 4.9 |
| 7 | 45 | 0.14 | 3.0 | 1 | 308.9 | 9.9 |
| 8 | 45 | 0.18 | 2.5 | 2 | 304.2 | 5.2 |
| 9 | 60 | 0.06 | 2.5 | 4 | 306.4 | 7.1 |
| 10 | 60 | 0.10 | 3.0 | 3 | 305.6 | 6.5 |
| 11 | 60 | 0.14 | 1.5 | 2 | 305.8 | 6.9 |
| 12 | 60 | 0.18 | 2.0 | 1 | 308.2 | 9.3 |
| 13 | 75 | 0.06 | 3.0 | 2 | 310.8 | 11.5 |
| 14 | 75 | 0.10 | 2.5 | 1 | 311.9 | 12.9 |
| 15 | 75 | 0.14 | 2.0 | 4 | 303.6 | 4.6 |
| 16 | 75 | 0.18 | 1.5 | 3 | 303.8 | 4.9 |
Range analysis was performed on the results. The range (R) for each factor, calculated as the difference between the maximum and minimum average response at its four levels, indicates the factor’s significance. A larger R means the factor has a greater influence on the response.
For Tmax, the ranges are: RD = 7.01, RB = 5.33, RA = 1.45, RC = 1.20.
For ΔT, the ranges are: RD = 7.68, RB = 6.33, RA = 1.98, RC = 1.53.
Therefore, the order of significance for both Tmax and ΔT is consistent: Plate Thickness (D) > Inlet Velocity (B) > Branch Angle (A) > Channel Width (C).
The level combination that minimizes the average response for each factor points to the optimal design: D4B4A1C3 (i.e., H=4 mm, v=0.18 m/s, θ=30°, w=2.5 mm). A confirmation simulation with this optimal combination was conducted. The results showed a li ion battery Tmax of 302.4 K and a ΔT of 3.4 K, both well within the desired safety limits. Compared to the initial baseline design (θ=45°, v=0.1 m/s, w=2 mm, H=2 mm, Tmax=306.8 K, ΔT=7.5 K), the optimized design reduces the maximum temperature by 4.4 K and the temperature difference by 4.1 K, significantly enhancing the thermal homogeneity and safety of the battery module.
5. Conclusion
This study demonstrates the effectiveness of a biomimetic tree-like channel liquid cooling plate for thermal management of a high-discharge-rate li ion battery module. Through detailed numerical simulation and orthogonal experimental optimization, we draw the following conclusions:
- Cooling plate thickness (H) is the most influential parameter, profoundly affecting both the maximum temperature and temperature uniformity of the li ion battery. Increasing thickness enhances coolant flow rate and reduces pressure drop, leading to superior cooling performance.
- Coolant inlet velocity (v) is the second most significant factor. While increasing velocity improves cooling, the benefit diminishes at higher values, accompanied by a quadratic increase in pressure drop and pumping power. An optimal velocity must balance thermal performance and energy consumption.
- Branch channel angle (θ) has a moderate impact. Smaller angles (around 30°) provide better thermal performance by maximizing the heat exchange area. Angles larger than 60° offer negligible further change in performance.
- Branch channel width (w) has the least influence on thermal performance within the studied range but is important for managing pressure drop. Its value should be chosen to minimize flow resistance without compromising structural integrity.
- The optimal parameter combination (H=4 mm, v=0.18 m/s, θ=30°, w=2.5 mm) successfully maintains the li ion battery module at a safe maximum temperature of 302.4 K with an excellent temperature uniformity of 3.4 K, meeting the stringent requirements for battery thermal management.
The proposed tree-like cold plate presents a viable solution for managing heat in dense li ion battery packs. Future work should address practical challenges such as sealing to prevent coolant leakage, exploring advanced cold plate materials with higher thermal conductivity, and conducting multi-objective optimization that simultaneously minimizes temperature, pressure drop, and material weight. Furthermore, integrating this design with other thermal management strategies, such as phase change materials, could lead to even more robust and efficient systems for the next generation of energy storage.