
In recent years, the rapid advancement of portable electronics, electric vehicles, and renewable energy systems has underscored the critical role of energy storage technologies. Among these, li-ion batteries have emerged as a dominant solution due to their high energy density, long cycle life, and low self-discharge rates. However, the performance of li-ion batteries degrades over time due to complex electrochemical reactions during charge-discharge cycles, leading to capacity fade, increased impedance, and safety concerns. Accurately estimating the State of Health (SOH) of li-ion batteries is thus a pivotal challenge for Battery Management Systems (BMS) to ensure reliability, longevity, and safety. This article presents a novel data-driven approach that integrates feature parameter extraction via Differential Thermal Voltammetry (DTV) with a two-step Gaussian Process Regression (GPR) model for robust SOH estimation. By leveraging experimental data and advanced machine learning techniques, we aim to enhance the accuracy and efficiency of SOH prediction, contributing to the development of smarter BMS for li-ion batteries.
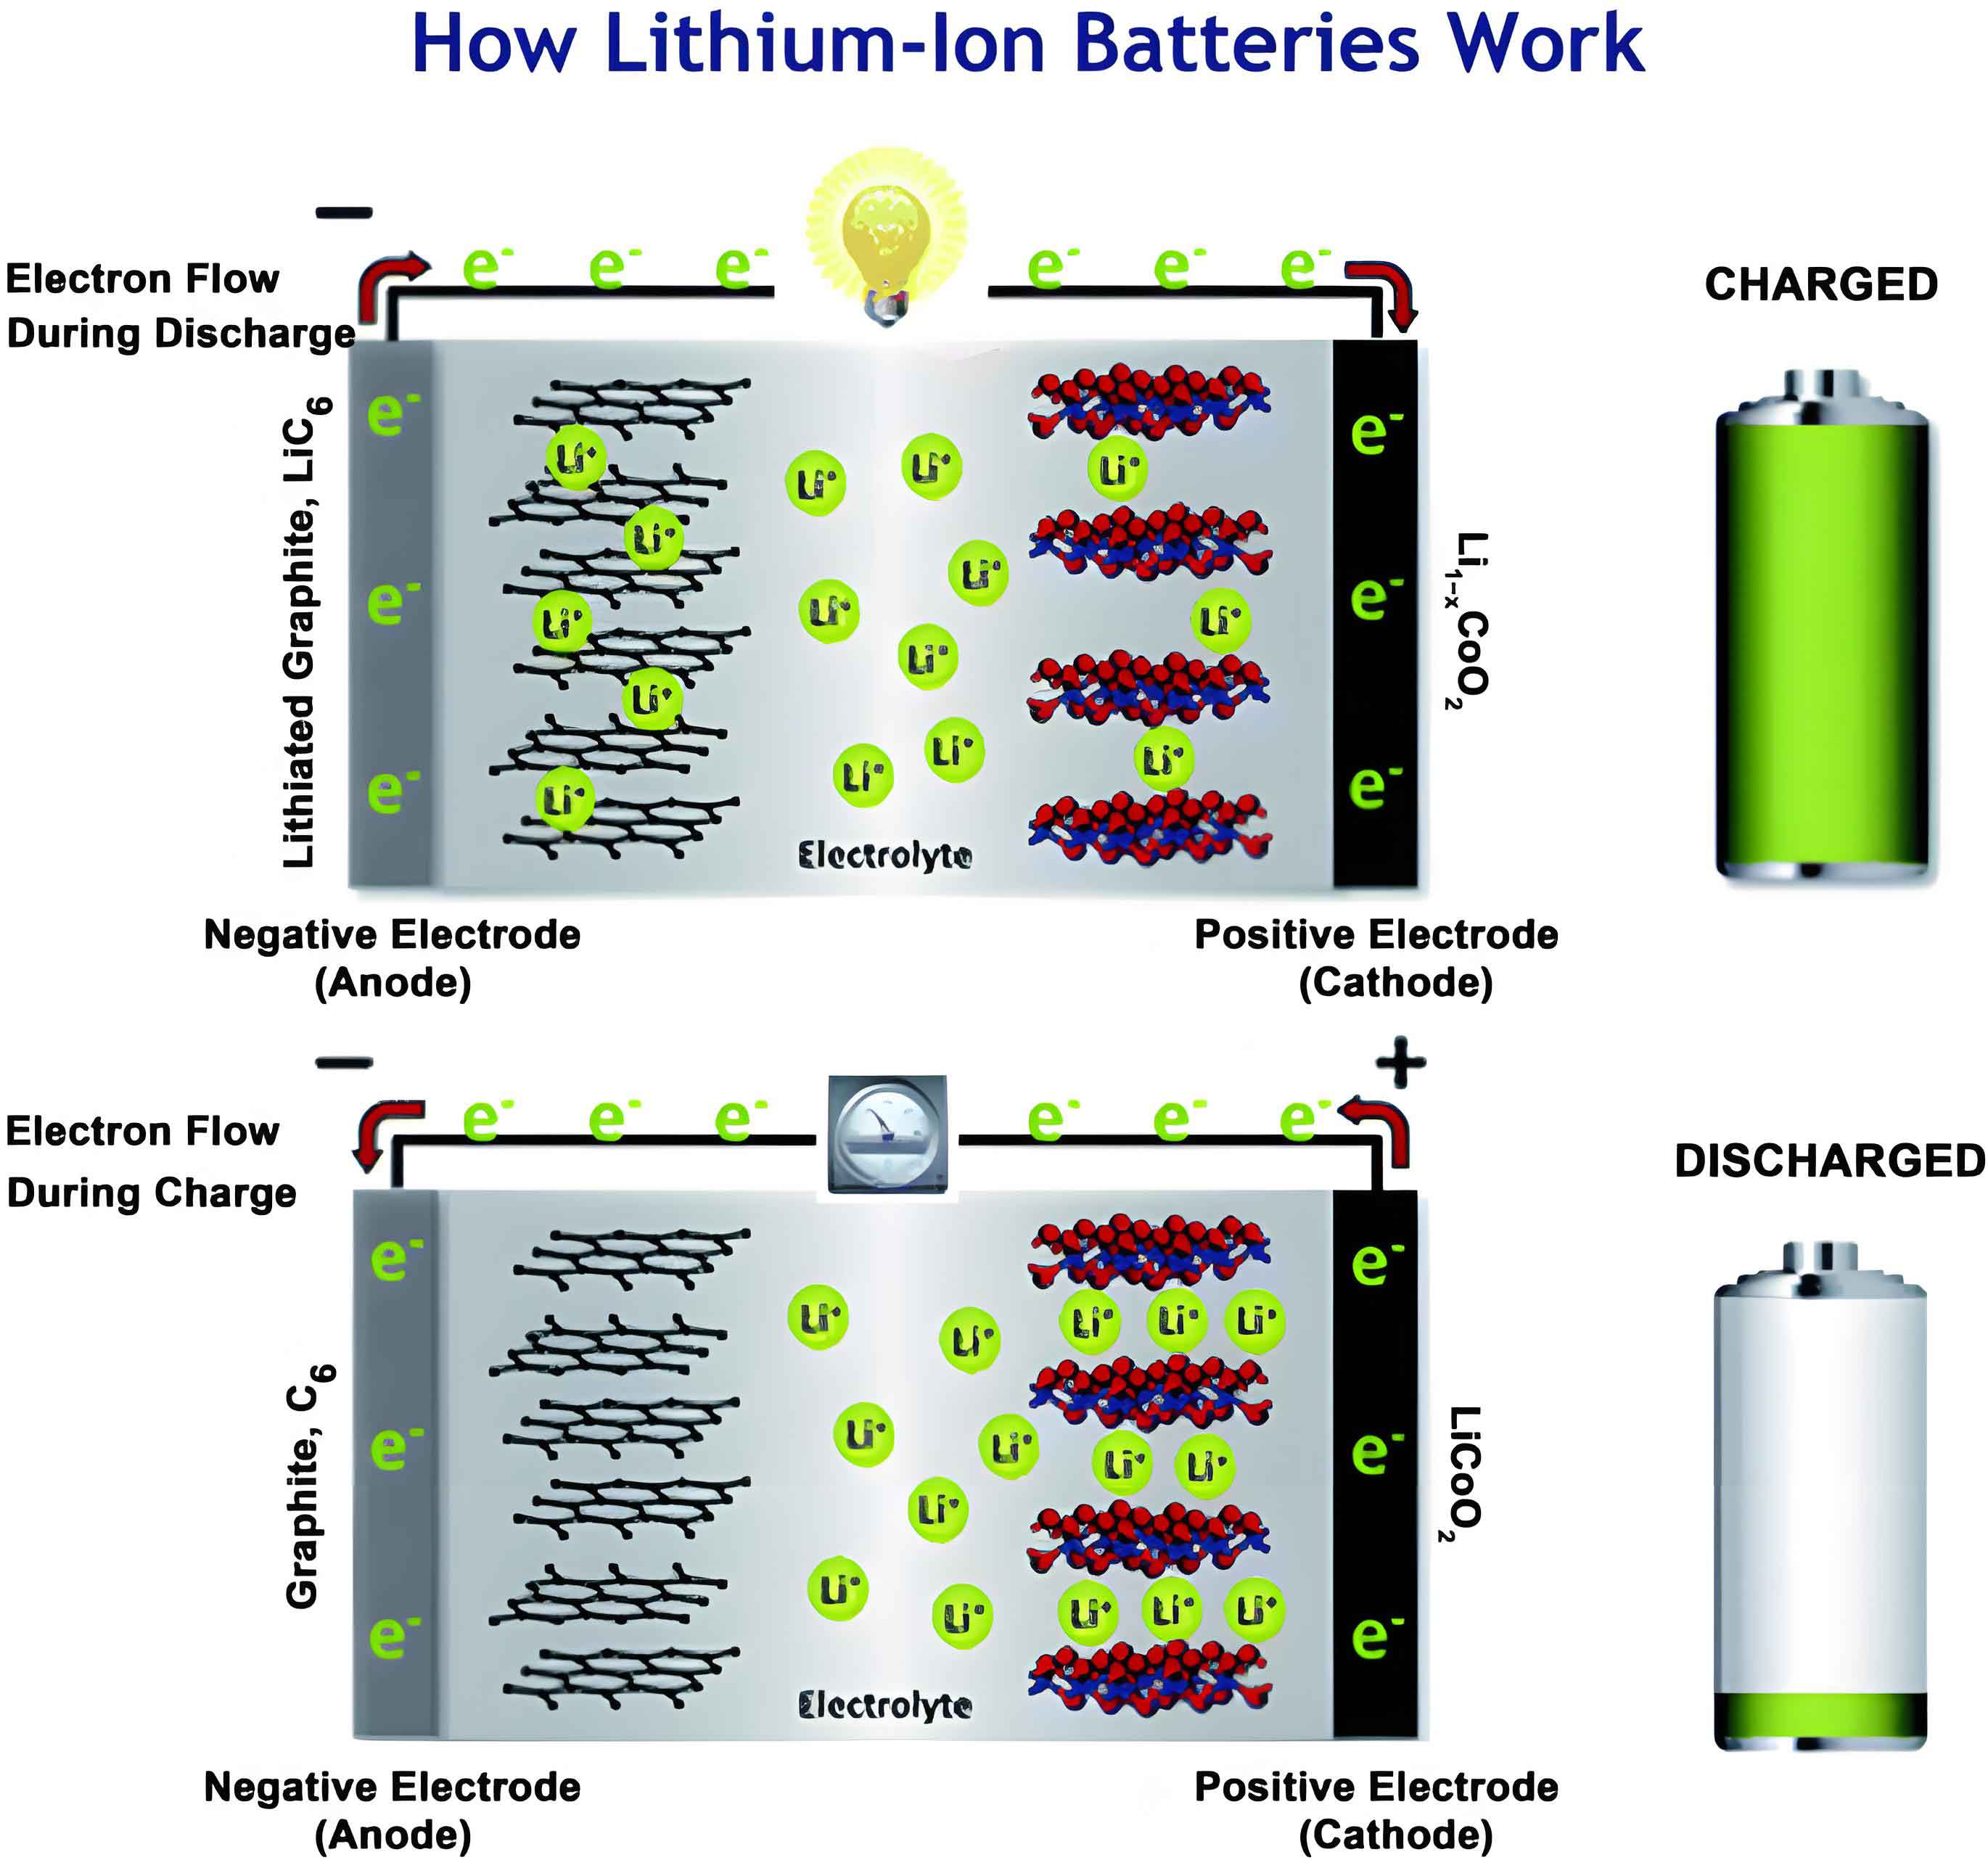
The degradation of li-ion batteries is influenced by various factors, including operating conditions, thermal stress, and charge-discharge patterns. Traditional methods for SOH estimation can be broadly categorized into feature-based approaches, model-based techniques, and data-driven methods. Feature-based methods rely on extracting indicative parameters from battery measurements, such as voltage curves or incremental capacity peaks, to map to SOH. Model-based approaches, like electrochemical models or equivalent circuit models, simulate internal battery processes but often require extensive parameter tuning. Data-driven methods, including machine learning algorithms, learn patterns from historical data to predict SOH without explicit physical models. Each method has its strengths and limitations; for instance, data-driven approaches offer high adaptability but depend on data quality, while feature-based methods provide interpretability but may lack robustness under varying conditions. In this context, we propose a hybrid framework that combines the strengths of feature extraction and data-driven modeling to address the complexities of li-ion battery aging.
Our methodology centers on using DTV, a technique that analyzes the relationship between temperature and voltage changes during battery operation. DTV is particularly effective for tracking degradation in li-ion batteries because it captures entropy heat generated from phase transitions within electrodes. The DTV value is defined as the derivative of temperature with respect to voltage:
$$D = \frac{dT}{dV}$$
In practice, for discrete data points, we approximate this using finite differences over a sampling interval to mitigate noise. For a given time index \(k\), with \(S\) as the total number of samples, the DTV is computed as:
$$D(k) \approx \frac{T(k) – T(k – S/15)}{V(k) – V(k – S/15)}$$
This approximation balances noise reduction and detail preservation. However, raw DTV curves often contain noise, necessitating filtering. We employ a Gaussian filter, which applies a Gaussian function to smooth the data while maintaining peak and valley shapes critical for feature extraction. The Gaussian function is given by:
$$G(x) = \frac{1}{\sigma \sqrt{2\pi}} e^{-\frac{a^2}{2\sigma^2}}$$
where \(G(x)\) is the filtered output, \(a\) is the input signal, and \(\sigma\) is the standard deviation controlling the smoothing degree. After filtering, the DTV curves reveal distinct peaks and valleys corresponding to electrochemical phase changes, from which we extract features for SOH estimation.
Feature extraction is a crucial step in linking DTV patterns to battery health. From the smoothed DTV curves, we identify key points such as peak voltages, peak DTV values, valley voltages, valley DTV values, and zero-crossing points. Specifically, we extract ten initial features: the voltage and DTV value of the first peak (\(F_1, F_2\)), the first valley (\(F_3, F_4\)), the zero-crossing point between the first valley and second peak (\(F_5, F_6\)), the second peak (\(F_7, F_8\)), and the second valley (\(F_9, F_{10}\)). Mathematical expressions for these features involve finding extrema and roots in the DTV curve. For peaks:
$$V_{\text{peak}} = V_i \quad \text{where} \quad \frac{dD}{dV_i} = 0, \quad D(V_i) \geq D(V_k) \text{ for } V_k \in (V_{i-1}, V_{i+1})$$
$$D_{\text{peak}} = g(V_{\text{peak}})$$
For valleys:
$$V_{\text{valley}} = V_i \quad \text{where} \quad \frac{dD}{dV_i} = 0, \quad D(V_i) \leq D(V_k) \text{ for } V_k \in (V_{i-1}, V_{i+1})$$
$$D_{\text{valley}} = g(V_{\text{valley}})$$
And for zero-crossing points:
$$V_{D=0} = V_i \quad \text{where} \quad |D(V_i)| \leq |D(V_k)| \text{ for } V_k \in (V_{\text{valley1}}, V_{\text{peak2}})$$
$$J = \left. \frac{dD}{dV} \right|_{V_{D=0}}$$
Here, \(g\) represents the mapping between voltage and DTV. These features exhibit trends correlated with capacity fade in li-ion batteries; for example, some increase while others decrease over cycles. To select the most relevant features, we perform Pearson correlation analysis, which measures linear relationships between each feature and battery capacity. The Pearson correlation coefficient \(r\) is defined as:
$$r = \frac{\text{cov}(X,Y)}{\sigma_X \sigma_Y} = \frac{\sum_{i=1}^n (X_i – \bar{X})(Y_i – \bar{Y})}{\sqrt{\sum_{i=1}^n (X_i – \bar{X})^2} \sqrt{\sum_{i=1}^n (Y_i – \bar{Y})^2}}$$
where \(X\) and \(Y\) are feature and capacity vectors, \(\text{cov}\) is covariance, \(\sigma\) denotes standard deviation, and \(n\) is the sample size. Based on this analysis, we select six features with high correlation magnitudes: \(F_1\), \(F_2\), \(F_5\), \(F_7\), \(F_8\), and \(F_{10}\). These features serve as inputs to our regression model for SOH estimation.
For regression, we employ Gaussian Process Regression (GPR), a non-parametric Bayesian approach that provides probabilistic predictions and uncertainty estimates. GPR defines a distribution over functions, characterized by a mean function and a covariance function (kernel). Given input vectors \(x\) (comprising battery cycle index and extracted features) and output \(y\) (battery capacity), we assume:
$$y = f(x) + \epsilon, \quad \epsilon \sim \mathcal{N}(0, \sigma^2)$$
where \(\epsilon\) is Gaussian noise. The function \(f(x)\) follows a Gaussian process:
$$f(x) \sim \mathcal{GP}(m(x), K(x, z))$$
Typically, the mean function \(m(x)\) is set to zero, and the kernel \(K(x, z)\) captures the covariance between inputs. We use a two-step GPR model with different kernels to enhance performance. The first step uses a Matern kernel with Automatic Relevance Determination (ARD), denoted Maternard, which adapts to local variations and feature sensitivities. The Maternard kernel is expressed as:
$$K_{\text{Mater}} = \frac{2^{1-\nu}}{\Gamma(\nu)} (\sqrt{2\nu} r)^\nu K_\nu(\sqrt{2\nu} r)$$
$$r = \sqrt{(x – z)^T P_{\text{Mater}}^{-1} (x – z)}$$
Here, \(\nu\) is a non-negative parameter, \(\Gamma\) is the Gamma function, \(K_\nu\) is the modified Bessel function, and \(P_{\text{Mater}}\) is a diagonal matrix of ARD parameters. The hyperparameters include the ARD parameters and the log of standard deviation \(\sigma_{\text{Mater}}\). The second step uses an isotropic Rational Quadratic (RQiso) kernel, which provides a smooth global trend:
$$K_{\text{RQiso}} = \sigma^2_{\text{RQiso}} \left(1 + \frac{(x – z)^T P_{\text{RQiso}}^{-1} (x – z)}{2\alpha}\right)^{-\alpha}$$
where \(\sigma_{\text{RQiso}}\) is the standard deviation, \(P_{\text{RQiso}}\) is an identity matrix, and \(\alpha\) is a shape parameter. Hyperparameters are the log of \(\sigma_{\text{RQiso}}\), the dimension of \(P_{\text{RQiso}}\), and the log of \(\alpha\). The two-step approach divides the training data into subsets \(S_1\) and \(S_2\) based on variance estimates, with a ratio between 1:4 and 1:3 for optimal results. First, we train the Maternard GPR on \(S_1\) to capture local patterns. Then, we input \(S_2\) into this model to obtain intermediate predictions, which are further refined by the RQiso GPR to produce final SOH estimates. This hierarchical modeling reduces computational complexity compared to single-step GPR, as training time scales with \(O(h^3)\) and testing time with \(O(h^2 h^*)\), where \(h\) is input size and \(h^*\) is prediction size; by splitting data, we lower \(h\) in each step.
To validate our approach, we utilize a publicly available battery degradation dataset, focusing on li-ion batteries with graphite anodes and mixed LCO/NCO cathodes. The dataset includes eight pouch cells subjected to cyclic charging and discharging at 1C rate under 40°C. Each cell undergoes hundreds of cycles, with measurements of time, voltage, charge, and surface temperature recorded periodically. Capacity fade curves show varying degradation patterns; for instance, some cells exhibit stable decline while others show abrupt drops or instability. We select two cells as test sets and the remainder as training sets to evaluate model generalizability. Data preprocessing involves computing DTV curves, applying Gaussian filtering, and extracting the six selected features. The features are then normalized and fed into the two-step GPR model for training and prediction.
The performance of our model is assessed using error metrics: Absolute Error (AE), Mean Absolute Error (MAE), and Root Mean Square Error (RMSE). These are defined as:
$$\text{AE} = |u_{i,\text{est}} – u_{i,\text{true}}|$$
$$\text{MAE} = \frac{1}{n} \sum_{i=1}^n |u_{i,\text{est}} – u_{i,\text{true}}|$$
$$\text{RMSE} = \sqrt{\frac{1}{n} \sum_{i=1}^n (u_{i,\text{est}} – u_{i,\text{true}})^2}$$
where \(u_{i,\text{est}}\) is the estimated SOH, \(u_{i,\text{true}}\) is the actual SOH, and \(n\) is the number of cycles. We compare our two-step GPR with a single-step GPR using only the Maternard kernel to highlight improvements.
Results indicate that the two-step GPR model achieves high accuracy in SOH estimation for li-ion batteries. The estimated SOH curves closely follow the experimental data, with reduced dispersion and better approximation, especially during early aging stages. In later cycles, where data sparsity and instability increase, errors slightly rise but remain acceptable. Error analysis shows that for the test cells, the two-step GPR yields MAE values between 0.67% and 0.97%, and RMSE values between 0.55% and 0.71%. In contrast, the single-step GPR has MAE of 1.03% to 1.17% and RMSE of 0.77% to 0.83%, representing reductions of 20-30% in MAE and 14-28% in RMSE. This demonstrates the superiority of the two-step approach in enhancing estimation robustness. Moreover, computational efficiency is improved: training and prediction times are significantly shorter due to the partitioned data handling, making the method suitable for real-time BMS applications.
We further analyze the contribution of DTV features to SOH estimation. The selected features exhibit strong linear correlations with capacity, as summarized in the correlation matrix table below. This validates DTV as a effective tool for capturing degradation signatures in li-ion batteries. The integration of these features with GPR allows for adaptive learning, where the model weights inputs based on variance, thereby optimizing prediction accuracy across different aging phases.
| Feature | Description | Correlation with Capacity |
|---|---|---|
| \(F_1\) | Voltage at first peak | Negative (high) |
| \(F_2\) | DTV value at first peak | Positive (high) |
| \(F_5\) | Voltage at zero-crossing | Negative (high) |
| \(F_7\) | Voltage at second peak | Negative (high) |
| \(F_8\) | DTV value at second peak | Positive (high) |
| \(F_{10}\) | DTV value at second valley | Negative (high) |
The mathematical foundation of GPR ensures that predictions come with confidence intervals, providing uncertainty quantification—a valuable feature for risk assessment in li-ion battery management. The posterior distribution for a new input \(x_*\) is derived from the joint Gaussian prior:
$$\begin{bmatrix} y \\ y_* \end{bmatrix} \sim \mathcal{N}\left(0, \begin{bmatrix} K(X,X) + \sigma^2 I & K(X, x_*) \\ K(x_*, X) & K(x_*, x_*) \end{bmatrix}\right)$$
leading to the predictive mean and covariance:
$$\bar{y}_* = K(x_*, X) (K(X,X) + \sigma^2 I)^{-1} y$$
$$\text{cov}(y_*) = K(x_*, x_*) – K(x_*, X) [K(X,X) + \sigma^2 I]^{-1} K(X, x_*)$$
This probabilistic output allows BMS to make informed decisions, such as triggering maintenance alerts when SOH uncertainty exceeds thresholds.
In discussion, we emphasize the advantages of our hybrid method over existing techniques. While feature-based methods alone may suffer from environmental variability, and data-driven methods can be data-hungry, our approach balances interpretability and adaptability. The DTV features directly relate to electrochemical processes, offering insights into degradation mechanisms like electrode phase transitions. Meanwhile, the two-step GPR handles non-linearities and noise effectively, outperforming single-kernel models. However, limitations exist: the method relies on consistent data collection, and performance may degrade under extreme operating conditions not covered in training. Future work could explore integrating additional sensors or adapting the model for different li-ion battery chemistries to broaden applicability.
To further illustrate the methodology, we present a summary of key equations and steps in table form, highlighting the workflow from data acquisition to SOH estimation:
| Step | Process | Key Equations/Parameters |
|---|---|---|
| 1. Data Acquisition | Collect voltage, temperature, charge data during cycles | Sampling rate, cycle index |
| 2. DTV Computation | Calculate DTV using finite differences | $$D(k) \approx \frac{T(k) – T(k – S/15)}{V(k) – V(k – S/15)}$$ |
| 3. Filtering | Apply Gaussian filter to smooth DTV curves | $$G(x) = \frac{1}{\sigma \sqrt{2\pi}} e^{-\frac{a^2}{2\sigma^2}}$$ |
| 4. Feature Extraction | Identify peaks, valleys, zero-crossings | \(F_1\) to \(F_{10}\), extrema conditions |
| 5. Feature Selection | Pearson correlation analysis | $$r = \frac{\sum (X_i – \bar{X})(Y_i – \bar{Y})}{\sqrt{\sum (X_i – \bar{X})^2} \sqrt{\sum (Y_i – \bar{Y})^2}}$$ |
| 6. GPR Modeling | Train two-step GPR with Maternard and RQiso kernels | Kernel functions, hyperparameter optimization |
| 7. SOH Estimation | Predict capacity using trained model | Predictive mean and covariance |
| 8. Error Evaluation | Compute MAE, RMSE, compare with benchmarks | $$\text{MAE} = \frac{1}{n} \sum |u_{est} – u_{true}|$$ |
The effectiveness of li-ion battery SOH estimation is critical for applications ranging from consumer electronics to grid storage. By implementing our proposed method, BMS can achieve more accurate health monitoring, enabling predictive maintenance and extending battery lifespan. The two-step GPR model, in particular, reduces computational burden while maintaining high precision, making it feasible for embedded systems with limited resources. Additionally, the use of DTV features provides a physics-informed basis that enhances model reliability compared to purely black-box approaches.
In conclusion, we have developed a robust framework for estimating the State of Health of li-ion batteries by combining Differential Thermal Voltammetry and Gaussian Process Regression. The DTV method effectively extracts degradation-sensitive features from temperature-voltage data, while the two-step GPR model leverages these features to deliver accurate SOH predictions with quantified uncertainty. Experimental validation on real battery data shows that our approach outperforms single-step GPR in terms of error reduction and computational efficiency. This work contributes to advancing battery management technologies, offering a scalable solution for health monitoring in diverse li-ion battery applications. Future research directions include extending the method to dynamic operating conditions and exploring deep learning integrations for even higher accuracy. As the demand for reliable energy storage grows, such innovations will play a pivotal role in ensuring the sustainability and safety of li-ion battery systems worldwide.