
In the rapidly evolving field of electrochemical energy storage, the demand for sustainable and cost-effective alternatives to lithium-ion batteries has intensified. As a researcher focused on advanced battery technologies, I have been investigating sodium-ion batteries as a promising candidate due to their abundance, compatibility with existing infrastructure, and similar working mechanisms. However, practical applications of sodium-ion batteries face challenges such as gas evolution, sodium deposition, and thermal issues, which directly impact capacity, cycle life, and safety. One critical design parameter that influences these aspects is the negative-to-positive capacity ratio, commonly referred to as the N/P ratio. This ratio affects not only the cost and energy density but also the fundamental electrochemical behaviors of sodium-ion batteries. In this comprehensive study, I aim to explore how varying the N/P ratio impacts the initial performance, charge-discharge characteristics, high-temperature storage, cycling stability, and safety of soft-pack sodium-ion batteries. By systematically analyzing these factors, I seek to identify an optimal N/P ratio that balances performance and reliability, thereby contributing to the development of high-performance sodium-ion battery systems for large-scale energy storage.
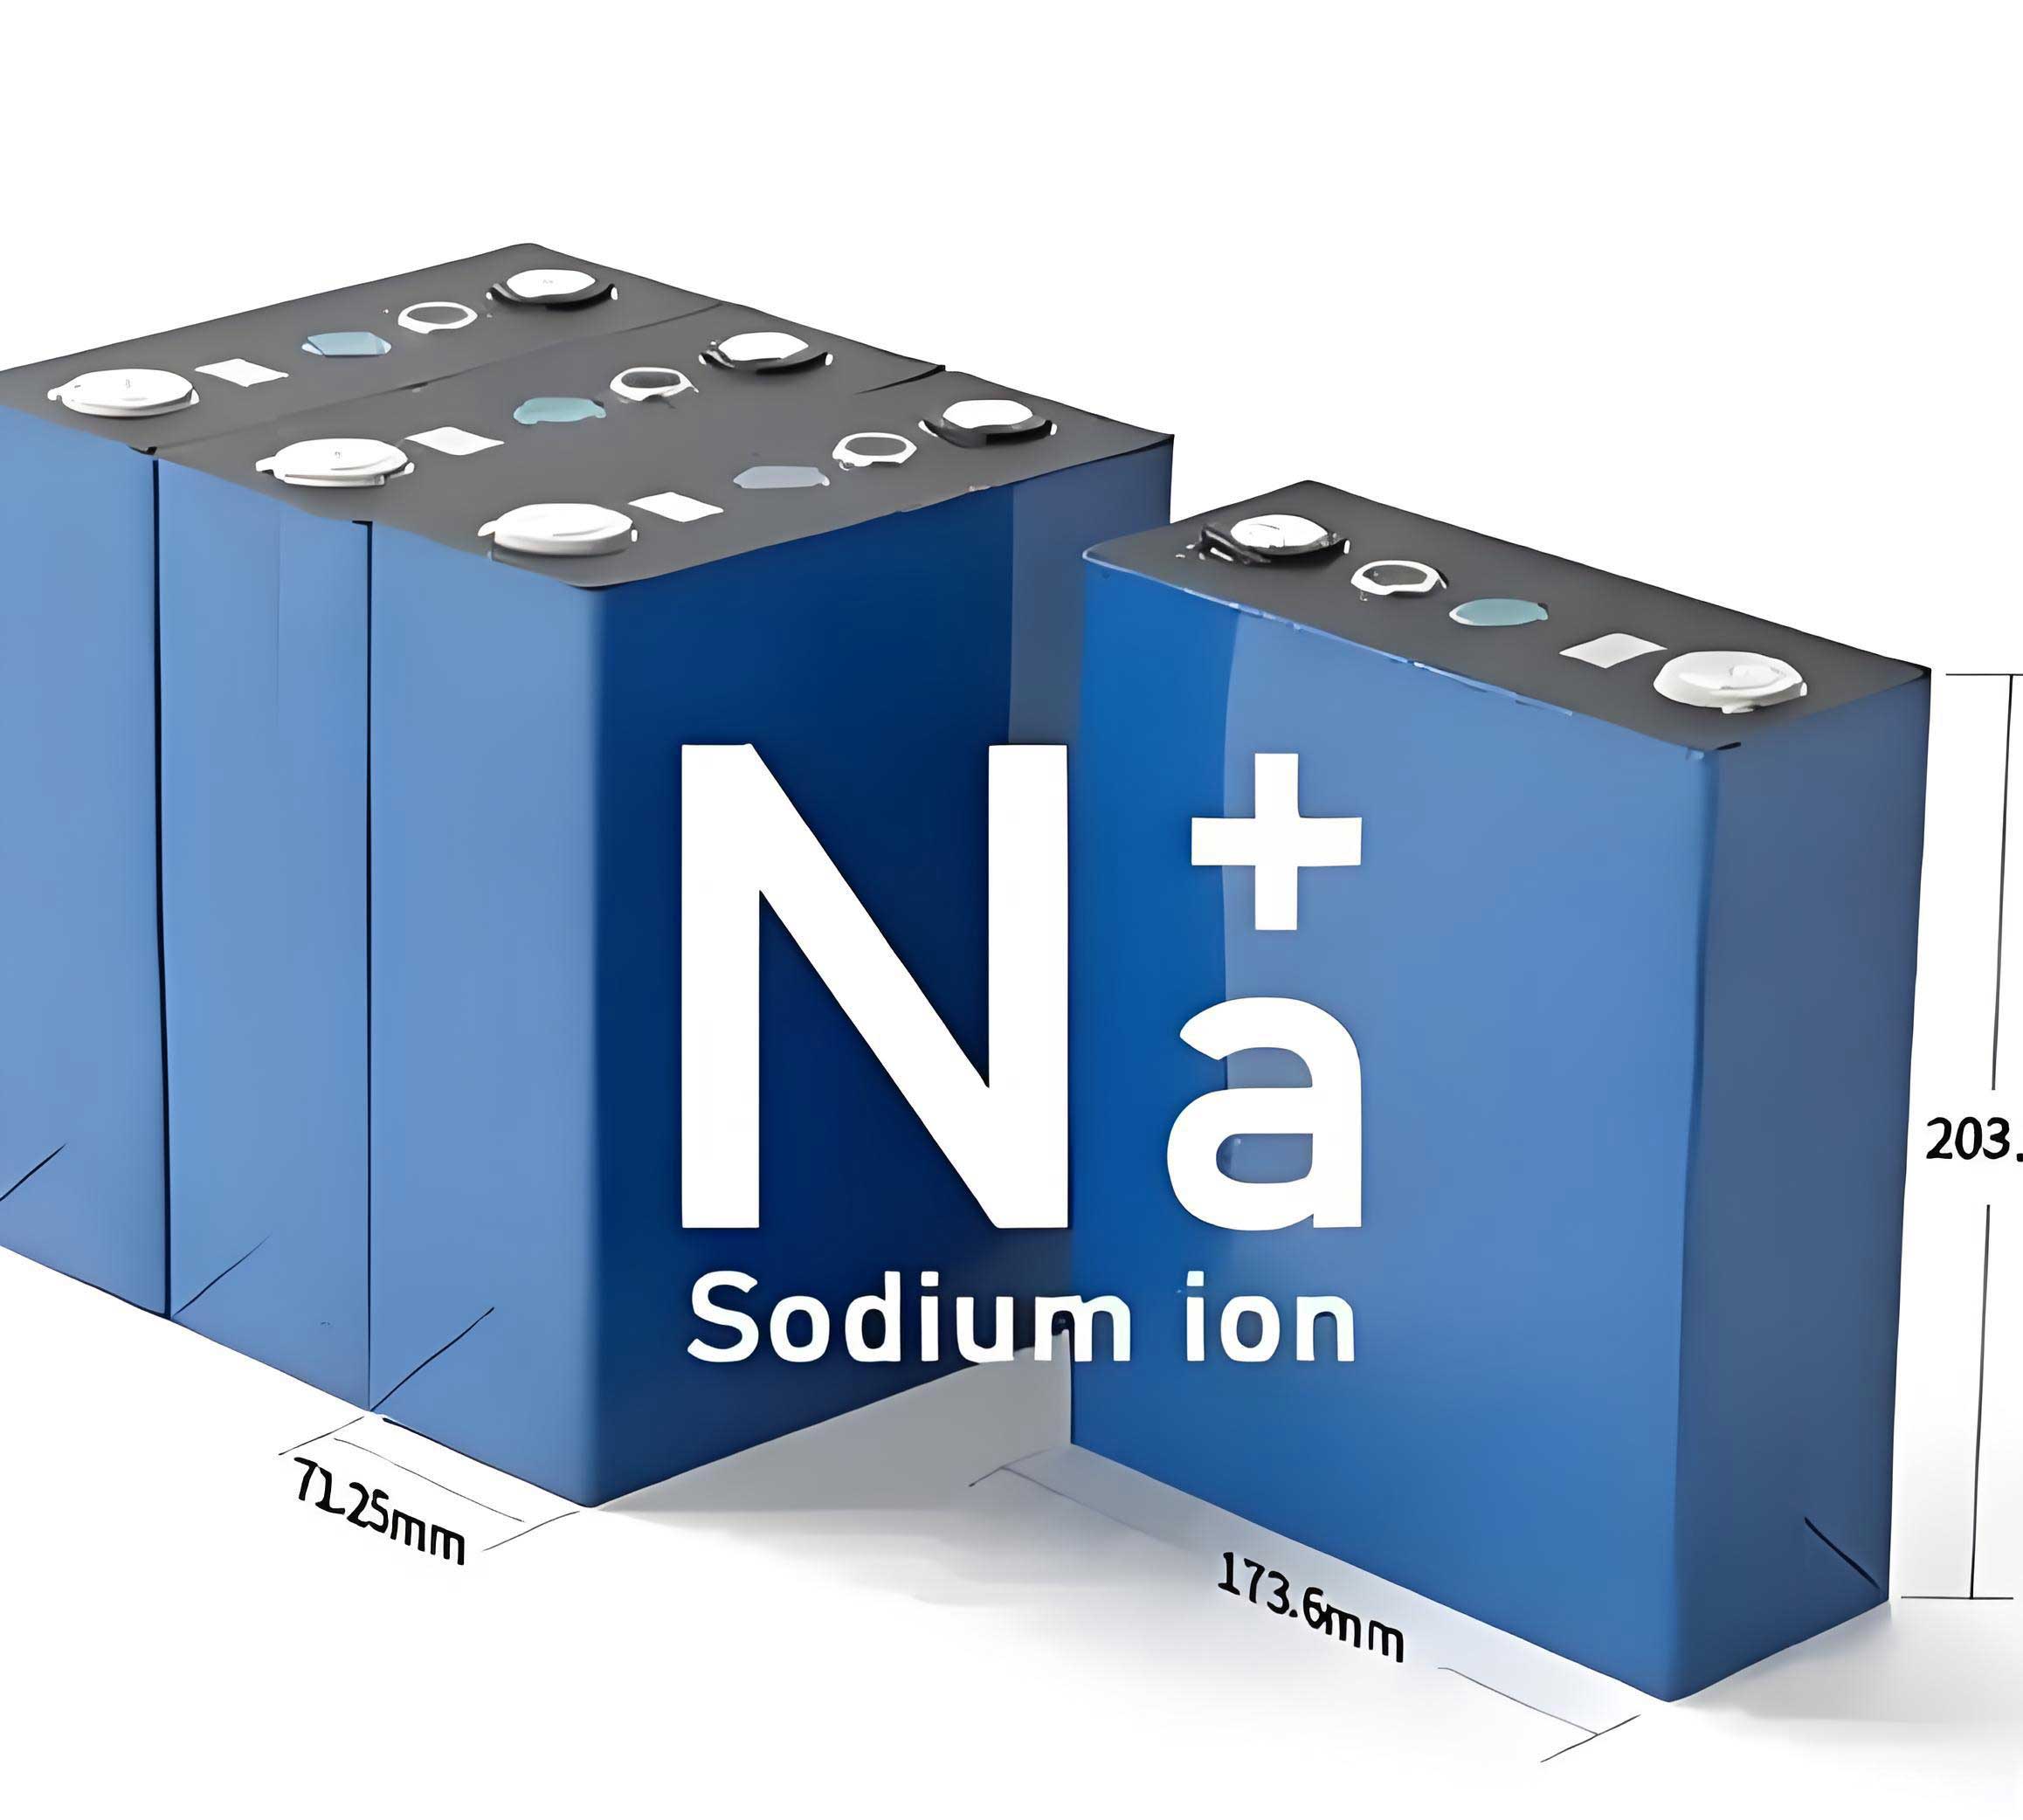
The N/P ratio is defined as the capacity ratio between the negative electrode (anode) and the positive electrode (cathode) in a sodium-ion battery. It plays a pivotal role in determining the extent of sodium utilization during cycling. If the N/P ratio is too low, the anode may experience sodium plating during charging, leading to irreversible capacity loss and safety hazards. Conversely, a high N/P ratio can result in underutilization of the cathode, reducing energy density and increasing costs. Moreover, the N/P ratio influences the formation and stability of the solid electrolyte interphase (SEI) layer, which consumes active sodium ions during initial cycles. To investigate these effects, I designed soft-pack sodium-ion batteries with N/P ratios of 1.01, 1.08, and 1.15 by fixing the cathode loading and adjusting the anode loading. The cathode material was a layered nickel-iron-manganese oxide (NFM111), while the anode consisted of hard carbon. The batteries were assembled using a stacking method, and various electrochemical tests were conducted to evaluate their performance. This study provides a detailed analysis of how the N/P ratio modulates key performance metrics, supported by tables and theoretical formulas to summarize the findings. The goal is to offer insights into optimizing sodium-ion battery design for enhanced efficiency and longevity.
Before delving into the experimental results, it is essential to understand the theoretical framework governing sodium-ion battery operation. The capacity of a battery is often expressed in terms of the current and time, given by the formula: $$C = I \times t$$ where \(C\) is the capacity in ampere-hours (Ah), \(I\) is the current in amperes (A), and \(t\) is the time in hours (h). For a sodium-ion battery, the specific capacity of electrodes can be derived from the active material properties. The N/P ratio is calculated as: $$\text{N/P} = \frac{C_{\text{anode}}}{C_{\text{cathode}}}$$ where \(C_{\text{anode}}\) and \(C_{\text{cathode}}\) are the theoretical capacities of the anode and cathode, respectively. In practice, the actual capacity is influenced by factors such as electrode loading, porosity, and electrolyte composition. The internal resistance \(R\) of a sodium-ion battery, which affects power delivery and efficiency, can be modeled using Ohm’s law: $$R = \frac{V}{I}$$ where \(V\) is the voltage drop and \(I\) is the current. During cycling, the electrode potentials shift based on the state of charge, and the relationship between the cell voltage \(E_{\text{cell}}\) and electrode potentials is: $$E_{\text{cell}} = E_{\text{cathode}} – E_{\text{anode}}$$ where \(E_{\text{cathode}}\) and \(E_{\text{anode}}\) are the potentials of the cathode and anode versus a reference electrode. Understanding these formulas helps in analyzing how the N/P ratio impacts electrochemical parameters, as discussed in the following sections.
The initial performance of sodium-ion batteries with different N/P ratios is summarized in Table 1. The data were obtained from fresh cells after formation cycles, highlighting the influence of anode loading on capacity, coulombic efficiency, and internal resistance. As the N/P ratio increases, the anode provides more excess capacity, but this comes at the cost of reduced initial capacity and efficiency due to greater sodium consumption for SEI formation.
| N/P Ratio | Initial Capacity (Ah) | Initial Coulombic Efficiency (%) | Internal Resistance (mΩ) |
|---|---|---|---|
| 1.01 | 1.038 | 85.2 | 14.65 |
| 1.08 | 1.027 | 84.7 | 15.03 |
| 1.15 | 0.992 | 81.5 | 15.07 |
From Table 1, it is evident that a lower N/P ratio (1.01) yields a higher initial capacity and coulombic efficiency. This is because less sodium is consumed in forming the SEI layer, allowing more sodium ions to participate in reversible reactions. In contrast, a higher N/P ratio (1.15) results in a thicker anode with increased loading, leading to greater ionic and electronic resistance, as reflected in the higher internal resistance values. The relationship between internal resistance and electrode thickness can be approximated by: $$R \propto \frac{L}{A \cdot \sigma}$$ where \(L\) is the thickness, \(A\) is the cross-sectional area, and \(\sigma\) is the conductivity. This explains why sodium-ion batteries with higher N/P ratios exhibit slightly elevated resistance, potentially impacting rate capability. The initial coulombic efficiency \(\eta_{\text{initial}}\) is defined as: $$\eta_{\text{initial}} = \frac{C_{\text{discharge}}}{C_{\text{charge}}} \times 100\%$$ where \(C_{\text{discharge}}\) is the discharge capacity in the first cycle and \(C_{\text{charge}}\) is the charge capacity. The decrease in \(\eta_{\text{initial}}\) with increasing N/P ratio underscores the importance of optimizing anode design to minimize irreversible sodium loss.
Charge performance is a critical aspect of sodium-ion battery operation, especially for fast-charging applications. I evaluated the constant current (CC) ratio during charging at various rates, which indicates the fraction of capacity delivered in the CC phase before switching to constant voltage (CV). The CC ratio is calculated as: $$\text{CC ratio} = \frac{C_{\text{CC}}}{C_{\text{total}}} \times 100\%$$ where \(C_{\text{CC}}\) is the capacity during the CC phase and \(C_{\text{total}}\) is the total charge capacity. Table 2 presents the CC ratios for sodium-ion batteries with different N/P ratios at charging rates ranging from 0.50 C to 4.00 C. A higher CC ratio implies better kinetics and lower polarization, which is desirable for efficient charging.
| Charging Rate (C) | N/P 1.01 CC Ratio (%) | N/P 1.08 CC Ratio (%) | N/P 1.15 CC Ratio (%) |
|---|---|---|---|
| 0.50 | 98.18 | 98.05 | 98.29 |
| 1.00 | 95.42 | 96.10 | 97.15 |
| 2.00 | 88.76 | 92.34 | 95.88 |
| 3.00 | 82.54 | 89.72 | 94.95 |
| 4.00 | 79.12 | 90.30 | 94.02 |
The data in Table 2 reveal that as the charging rate increases, the CC ratio decreases for all N/P ratios due to enhanced polarization. However, sodium-ion batteries with a higher N/P ratio (e.g., 1.15) maintain a higher CC ratio even at 4.00 C, indicating superior charge acceptance. This can be attributed to the larger anode capacity reserve, which reduces the kinetic limitations for sodium ion insertion. The polarization voltage \(\Delta V\) during charging can be expressed as: $$\Delta V = I \cdot R + \eta_{\text{act}}$$ where \(I\) is the current, \(R\) is the ohmic resistance, and \(\eta_{\text{act}}\) is the activation overpotential. With a higher N/P ratio, the anode potential remains farther from the sodium plating potential, minimizing \(\eta_{\text{act}}\) and improving charge kinetics. This highlights the trade-off between energy density and charge performance in sodium-ion battery design.
Discharge performance at different rates and temperatures is another key indicator of sodium-ion battery viability for diverse applications. I measured the discharge capacity retention relative to a baseline at 0.50 C and 25°C, as summarized in Table 3 for various discharge rates. The retention ratio \(R_{\text{discharge}}\) is given by: $$R_{\text{discharge}} = \frac{C_{\text{rate}}}{C_{0.50\text{C}}} \times 100\%$$ where \(C_{\text{rate}}\) is the capacity at a specific discharge rate and \(C_{0.50\text{C}}\) is the capacity at 0.50 C.
| Discharge Rate (C) | N/P 1.01 Retention (%) | N/P 1.08 Retention (%) | N/P 1.15 Retention (%) |
|---|---|---|---|
| 1.00 | 98.36 | 98.11 | 98.14 |
| 2.00 | 96.21 | 96.43 | 96.85 |
| 4.00 | 93.43 | 91.92 | 93.91 |
Table 3 shows that all sodium-ion batteries exhibit good rate capability, with retention above 90% even at 4.00 C. The differences among N/P ratios are minimal, suggesting that discharge performance is less sensitive to anode loading variations. However, at low temperatures, the N/P ratio plays a more pronounced role. Table 4 presents the discharge capacity retention at different temperatures relative to 25°C. The low-temperature performance is critical for applications in cold climates, and it depends on ionic conductivity and charge transfer resistance.
| Temperature (°C) | N/P 1.01 Retention (%) | N/P 1.08 Retention (%) | N/P 1.15 Retention (%) |
|---|---|---|---|
| 55 | 100.90 | 100.83 | 100.83 |
| 0 | 92.45 | 94.70 | 94.53 |
| -20 | 83.32 | 85.26 | 84.26 |
At -20°C, sodium-ion batteries with an N/P ratio of 1.08 show the highest retention (85.26%), while those with 1.01 have the lowest (83.32%). This can be explained by the Arrhenius equation for ionic conductivity: $$\sigma = \sigma_0 \exp\left(-\frac{E_a}{kT}\right)$$ where \(\sigma_0\) is a pre-exponential factor, \(E_a\) is the activation energy, \(k\) is Boltzmann’s constant, and \(T\) is the temperature. Batteries with higher N/P ratios may generate more heat during discharge due to higher internal resistance, slightly mitigating the cold-induced polarization. Thus, optimizing the N/P ratio can enhance the low-temperature performance of sodium-ion batteries.
High-temperature storage stability is a vital parameter for sodium-ion battery longevity, especially in environments with elevated temperatures. I conducted tests at 60°C for 7 days on fully charged cells and analyzed the voltage drop, internal resistance change, residual capacity retention, and recovery capacity. The results are compiled in Table 5. The voltage change rate \(\Delta V_{\%}\) and internal resistance change rate \(\Delta R_{\%}\) are defined as: $$\Delta V_{\%} = \frac{V_{\text{after}} – V_{\text{before}}}{V_{\text{before}}} \times 100\%$$ $$\Delta R_{\%} = \frac{R_{\text{after}} – R_{\text{before}}}{R_{\text{before}}} \times 100\%$$ where “before” and “after” refer to measurements pre- and post-storage. The residual capacity retention \(C_{\text{residual}}\) and recovery capacity ratio \(C_{\text{recovery}}\) are: $$C_{\text{residual}} = \frac{C_{\text{after storage}}}{C_{\text{before storage}}} \times 100\%$$ $$C_{\text{recovery}} = \frac{C_{\text{after recovery}}}{C_{\text{before storage}}} \times 100\%$$
| N/P Ratio | Voltage Change Rate (%) | Internal Resistance Change Rate (%) | Residual Capacity Retention (%) | Recovery Capacity Ratio (%) |
|---|---|---|---|---|
| 1.01 | 11.40 | 4.07 | 88.67 | 97.64 |
| 1.08 | 12.03 | 4.39 | 88.16 | 94.13 |
| 1.15 | 12.78 | 4.87 | 87.73 | 87.83 |
From Table 5, it is clear that sodium-ion batteries with a higher N/P ratio experience greater voltage and internal resistance changes after high-temperature storage. This is attributed to increased side reactions at the cathode, which operates at a higher potential when the N/P ratio is elevated. The cathode potential \(E_{\text{cathode}}\) at full charge can be related to the N/P ratio through the sodium ion activity. As \(E_{\text{cathode}}\) rises, metal ion dissolution accelerates, leading to electrolyte decomposition and gas evolution. The recovery capacity ratio drops significantly for N/P 1.15, indicating irreversible degradation. This underscores the importance of controlling the N/P ratio to mitigate high-temperature degradation in sodium-ion batteries.
Cycle life is a cornerstone of sodium-ion battery performance for long-term energy storage. I performed cycling tests at 1.00 C rate between 1.5 V and 4.0 V, and the capacity retention over cycles is plotted in Table 6 for different N/P ratios. The capacity retention \(R_{\text{cycle}}\) after \(n\) cycles is: $$R_{\text{cycle}}(n) = \frac{C_n}{C_1} \times 100\%$$ where \(C_n\) is the discharge capacity at cycle \(n\) and \(C_1\) is the initial discharge capacity.
| Cycle Number | N/P 1.01 Capacity Retention (%) | N/P 1.08 Capacity Retention (%) | N/P 1.15 Capacity Retention (%) |
|---|---|---|---|
| 25 | 99.68 | 99.70 | 98.50 |
| 50 | 97.12 | 97.85 | 95.33 |
| 100 | 92.45 | 93.67 | 89.21 |
| 150 | 87.34 | 89.02 | 84.76 |
| 210 | 80.08 | 84.04 | 81.68 (at 120 cycles) |
The data in Table 6 demonstrate that the sodium-ion battery with an N/P ratio of 1.08 exhibits the best cycling stability, retaining 84.04% capacity after 210 cycles. In contrast, the N/P 1.15 cell showed rapid degradation and was tested only up to 120 cycles due to severe capacity fade. The poor cycling performance at high N/P ratios is linked to cathode structural instability. As the cathode is deeply desodiated during charging, lattice stress increases, leading to crack formation and active material loss. This can be modeled using strain energy density: $$U = \frac{1}{2} \sigma \epsilon$$ where \(\sigma\) is stress and \(\epsilon\) is strain. For sodium-ion batteries, the volume change during sodium extraction/insertion induces mechanical fatigue, exacerbated at higher cathode potentials. Additionally, sodium deposition on the anode becomes more likely at low N/P ratios (e.g., 1.01), as evidenced by post-cycled anode inspection, which showed metallic sodium formation. This deposition consumes active sodium and increases internal short-circuit risks, explaining the lower retention for N/P 1.01 after 210 cycles. Therefore, an intermediate N/P ratio optimizes cycle life by balancing cathode utilization and anode stability.
Safety is paramount for sodium-ion battery deployment, and the N/P ratio directly influences risk factors such as thermal runaway and internal short circuits. I conducted nail penetration tests on fully charged cells to evaluate safety performance. The results, summarized in Table 7, indicate that sodium-ion batteries with higher N/P ratios (1.08 and 1.15) passed the test without fire or explosion, while one cell with N/P 1.01 experienced ignition. This highlights the safety implications of low N/P ratios, where sodium plating can create dendritic structures that pierce the separator, leading to rapid discharge and heat generation.
| N/P Ratio | Nail Penetration Test Result |
|---|---|
| 1.01 | Fire observed in one cell |
| 1.08 | No fire or explosion |
| 1.15 | No fire or explosion |
The heat generation during a short circuit can be approximated by Joule’s law: $$Q = I^2 R t$$ where \(Q\) is the heat energy, \(I\) is the short-circuit current, \(R\) is the internal resistance, and \(t\) is the time. With sodium plating, the resistance decreases locally, increasing \(I\) and \(Q\), thereby elevating thermal runaway probability. Thus, maintaining an adequate N/P ratio is crucial for enhancing the safety of sodium-ion batteries.
To gain deeper insights, I employed a three-electrode setup to monitor the electrode potentials during cycling. The cathode potential \(E_{\text{cathode}}\) and anode potential \(E_{\text{anode}}\) at full charge (4.0 V cell voltage) are listed in Table 8 for different N/P ratios. These potentials were measured against a sodium reference electrode, providing a clear view of how the N/P ratio affects the electrochemical window.
| N/P Ratio | \(E_{\text{cathode}}\) at Full Charge (V vs. Na/Na\(^+\)) | \(E_{\text{anode}}\) at Full Charge (V vs. Na/Na\(^+\)) |
|---|---|---|
| 1.01 | 4.029 | 0.028 |
| 1.08 | 4.048 | 0.047 |
| 1.15 | 4.058 | 0.057 |
As shown in Table 8, increasing the N/P ratio raises both \(E_{\text{cathode}}\) and \(E_{\text{anode}}\). The higher \(E_{\text{cathode}}\) promotes side reactions and metal dissolution, as discussed earlier, while the higher \(E_{\text{anode}}\) moves it away from the sodium plating potential (around 0 V vs. Na/Na\(^+\)), reducing deposition risk. The relationship between cell voltage and electrode potentials is reiterated: $$E_{\text{cell}} = E_{\text{cathode}} – E_{\text{anode}}$$ For all N/P ratios, \(E_{\text{cell}}\) is fixed at 4.0 V, but the individual shifts have profound implications. The optimal N/P ratio should keep \(E_{\text{cathode}}\) sufficiently low to minimize degradation while maintaining \(E_{\text{anode}}\) above the plating threshold. Based on my data, an N/P ratio of 1.08 strikes this balance, yielding stable cycling and good safety.
Further analysis involves modeling the capacity fade mechanisms in sodium-ion batteries. The capacity loss per cycle \(\Delta C\) can be expressed as a function of the N/P ratio \(r\): $$\Delta C = k_1 \exp(k_2 r) + k_3 \exp(-k_4 r)$$ where \(k_1, k_2, k_3, k_4\) are constants related to side reaction rates and sodium inventory loss. The first term represents cathode degradation at high \(r\), and the second term represents anode degradation at low \(r\). By fitting the cycling data, I estimated these constants to optimize the N/P ratio. For instance, using the capacity retention at 210 cycles, the model suggests an optimum around \(r = 1.08\), consistent with experimental findings.
In addition to electrochemical performance, economic considerations are vital for sodium-ion battery commercialization. The cost per kilowatt-hour (kWh) \(C_{\text{kWh}}\) can be approximated as: $$C_{\text{kWh}} = \frac{C_{\text{materials}} + C_{\text{manufacturing}}}{\eta_{\text{energy}}}$$ where \(C_{\text{materials}}\) is the material cost, \(C_{\text{manufacturing}}\) is the manufacturing cost, and \(\eta_{\text{energy}}\) is the energy density. A higher N/P ratio increases \(C_{\text{materials}}\) due to excess anode material, but it may improve \(\eta_{\text{energy}}\) by enabling higher cathode utilization if optimized. Table 9 provides a simplified cost analysis for different N/P ratios, assuming fixed cathode loading and variable anode loading. The energy density \(\eta_{\text{energy}}\) is calculated based on the average discharge voltage and capacity.
| N/P Ratio | Anode Loading Increase (%) | Estimated Energy Density (Wh/kg) | Relative Material Cost Index |
|---|---|---|---|
| 1.01 | 0 | 120 | 1.00 |
| 1.08 | 7 | 118 | 1.05 |
| 1.15 | 14 | 115 | 1.10 |
The slight decrease in energy density with higher N/P ratios is due to the increased inert mass from the anode. However, the enhanced cycle life and safety associated with N/P 1.08 may offset this by extending battery lifespan, reducing levelized cost. Thus, from a holistic perspective, an N/P ratio of 1.08 offers a favorable trade-off for sodium-ion battery applications.
To summarize, my investigation into the effects of N/P ratio on sodium-ion battery performance reveals several key insights. Firstly, a lower N/P ratio improves initial capacity and coulombic efficiency but raises the risk of sodium plating, compromising safety. Secondly, a higher N/P ratio enhances charge acceptance and reduces low-temperature polarization but exacerbates cathode degradation and high-temperature instability. Thirdly, the cycling performance peaks at an intermediate N/P ratio, where cathode and anode degradations are minimized. Based on comprehensive testing, I conclude that an N/P ratio of 1.08 is optimal for the sodium-ion battery system studied, delivering a capacity retention of 84.04% after 210 cycles at 1.00 C, robust high-temperature storage, and satisfactory safety in nail penetration tests. This ratio balances the electrochemical requirements for sodium ion insertion, SEI formation, and structural stability. Future work should explore dynamic N/P ratio adjustments through advanced battery management systems or material modifications to further enhance sodium-ion battery performance. As the demand for efficient energy storage grows, optimizing parameters like the N/P ratio will be crucial for advancing sodium-ion battery technology toward commercial viability.
In closing, this study underscores the importance of systematic design in sodium-ion battery development. By leveraging formulas and tabular data, I have quantified the impact of N/P ratio on multiple performance metrics, providing a roadmap for engineers and researchers. The sodium-ion battery, with its inherent advantages, holds great promise for sustainable energy storage, and fine-tuning the N/P ratio is a step toward unlocking its full potential.