
Accurately characterizing the thermal properties of a lithium-ion battery, particularly its anisotropic thermal conductivity, is a foundational prerequisite for effective thermal design and performance modeling of battery packs. The internal architecture of a typical lithium-ion battery, whether prismatic (resembling a layered sandwich) or cylindrical (resembling a rolled-up Swiss roll), inherently leads to strong directional dependence in heat transfer. Within the cell, alternating layers of electrodes, separators, and current collectors possess distinct thermal properties, and the intimate contact between these layers creates preferred pathways for heat flow along the plane of the electrodes, contrasting with the more resistive path through the stacked layers. This results in a material where the thermal conductivity in the direction parallel to the electrode sheets (the in-plane or lateral direction) is significantly higher than in the direction perpendicular to them (the through-plane or normal direction). Accurately quantifying this anisotropy is therefore critical for precise thermal simulation, safety analysis, and optimal cooling system design for lithium-ion battery systems.
While specific heat capacity of a lithium-ion battery can be determined using established calorimetric techniques, the measurement of directional thermal conductivities, especially the in-plane component, remains a challenging task with no universally adopted standard method. Existing approaches can be broadly categorized. Indirect “weighted average” methods calculate bulk properties from the known properties and volume fractions of individual components, but they often oversimplify by neglecting interfacial contact resistances and are sensitive to manufacturing variations. Direct experimental methods, such as transient plane source or guarded heat flow techniques, can be applied but frequently require complex setups, precise control to minimize parasitic heat losses, and sometimes even battery disassembly (“ex-situ” measurement), which may alter the internal structure and compromise the relevance of the obtained values for an intact cell.
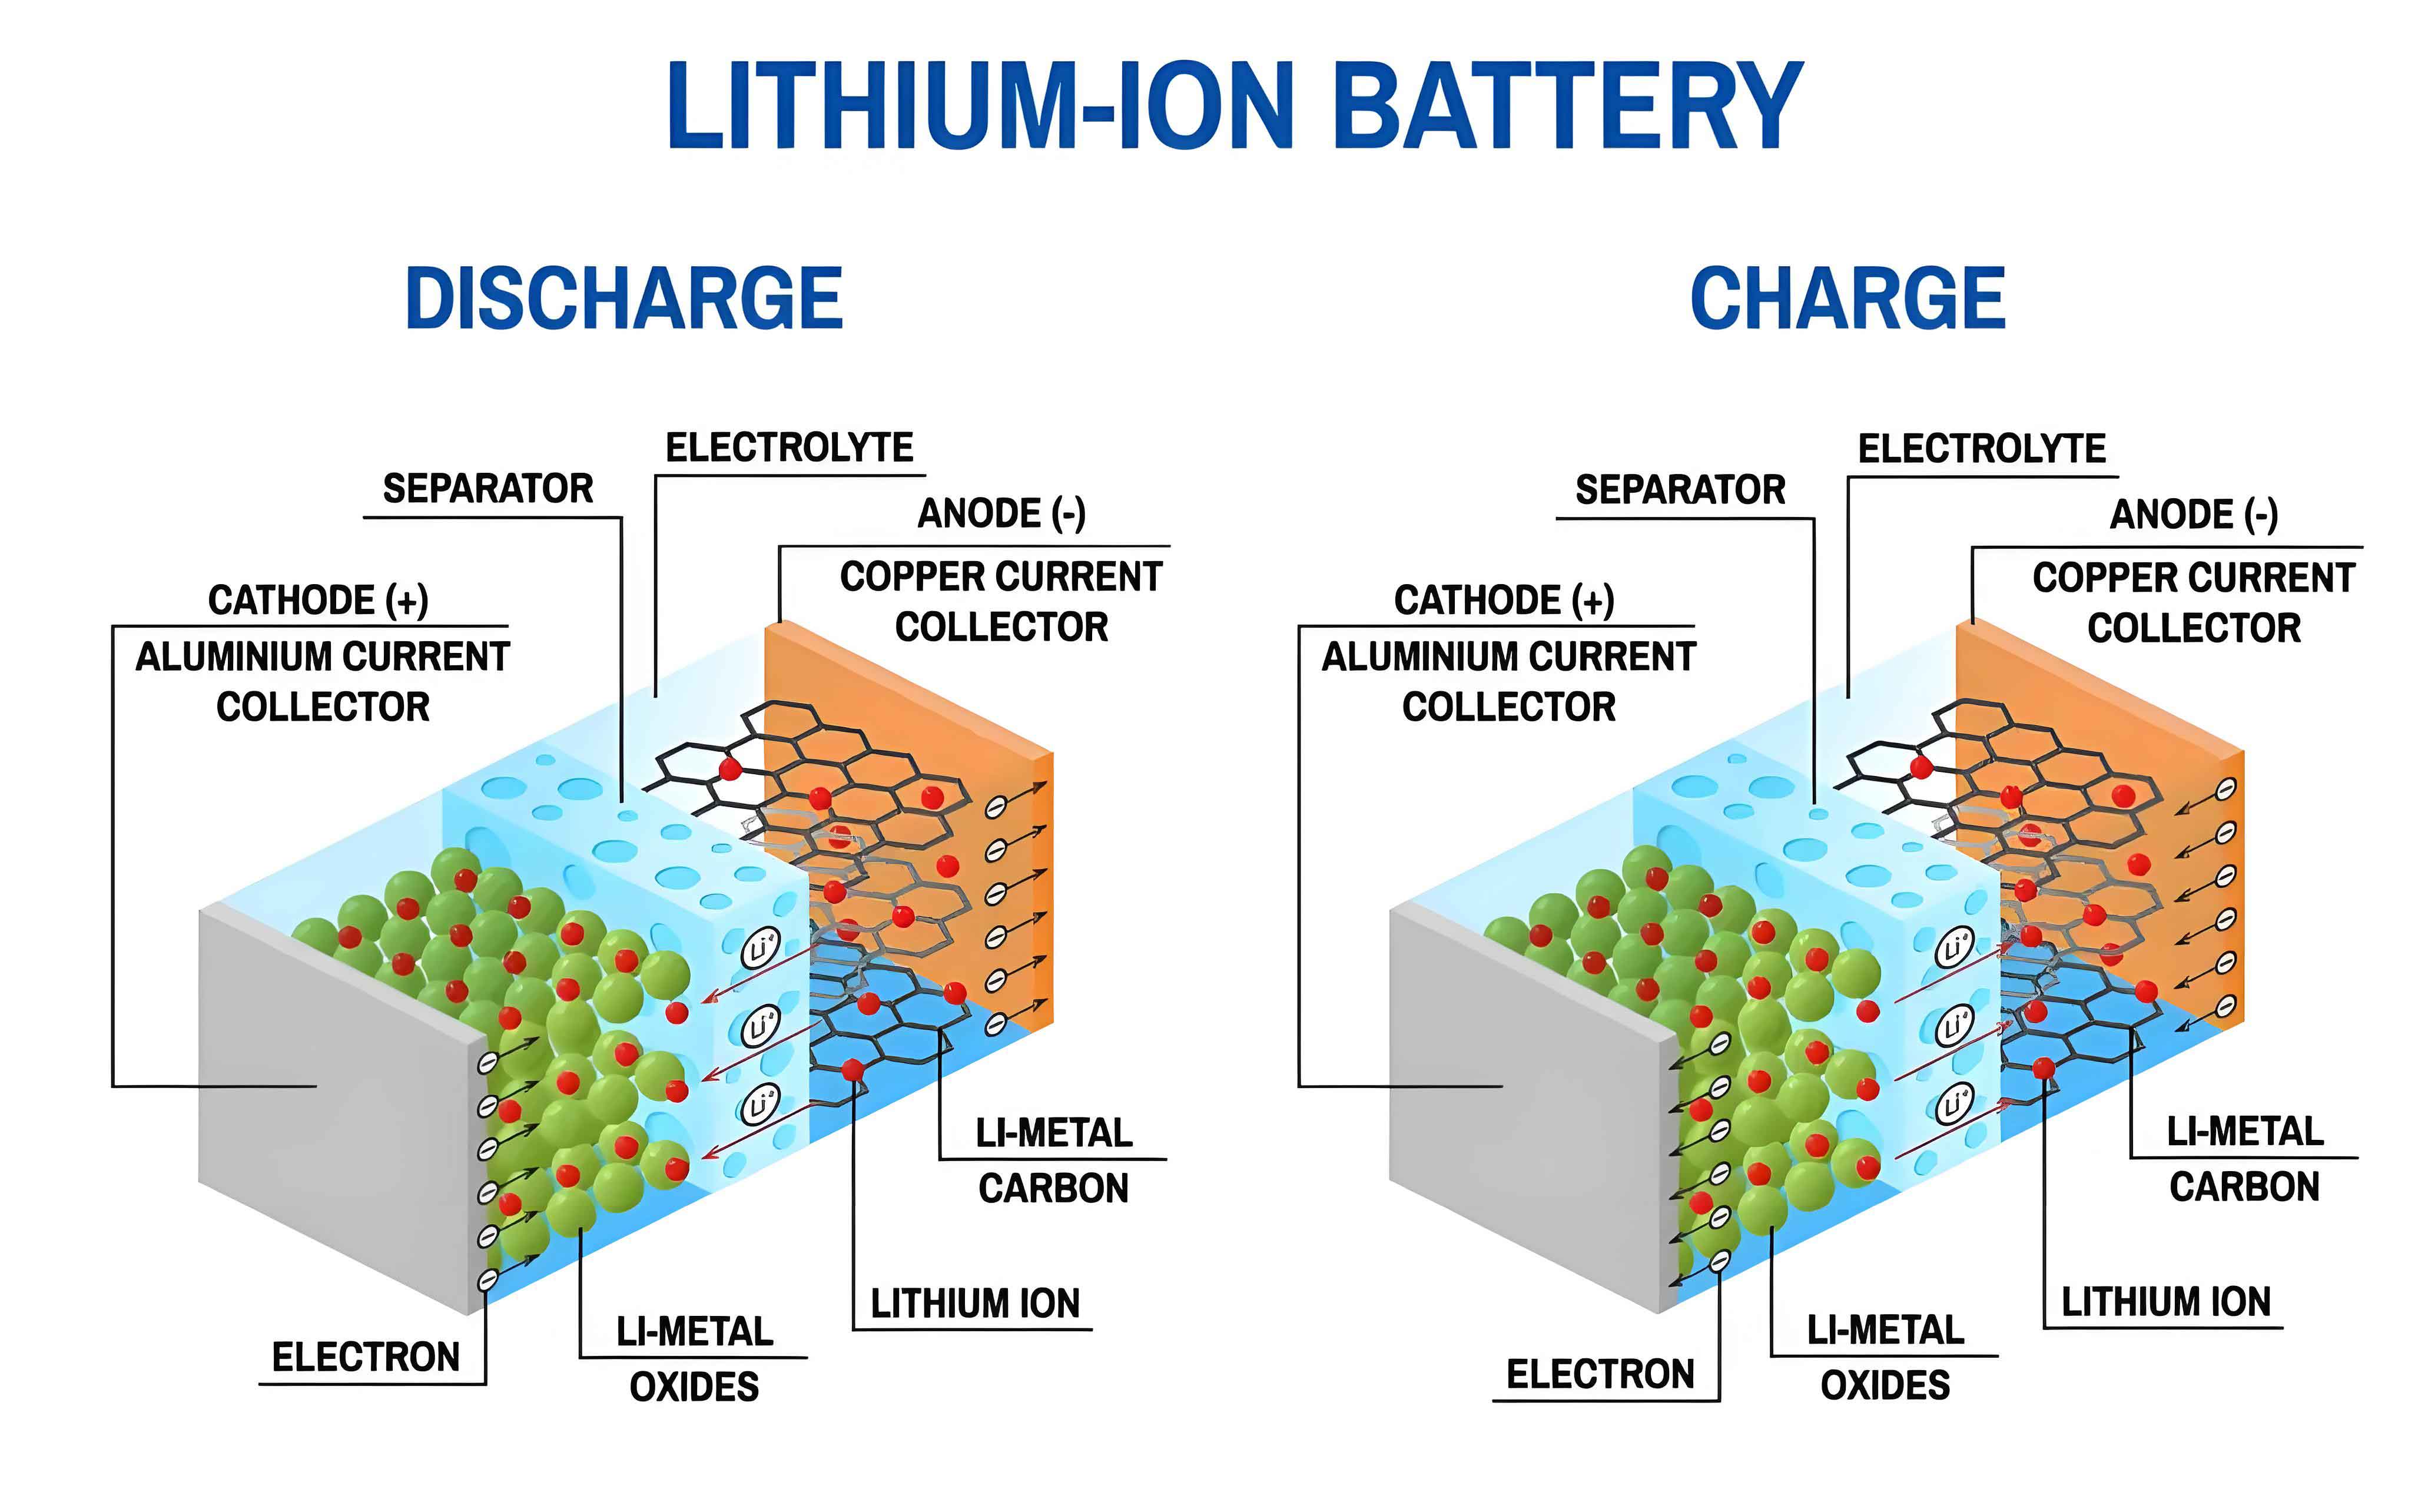
To address this gap, we propose and demonstrate an effective characterization methodology termed the “Extreme Value Optimization Method.” This approach synergistically combines controlled experimental heating tests on intact lithium-ion battery cells with detailed three-dimensional numerical thermal simulation. The core idea is to use experimentally measured temperature responses as a benchmark to iteratively refine and determine the anisotropic thermal conductivity ratio via simulation, effectively treating the lithium-ion battery as a “gray box” where the internal property is deduced from its external thermal behavior.
Theoretical Background and Methodology
The fundamental principle governing heat conduction is Fourier’s law. In its general form for an anisotropic material like a lithium-ion battery, it is expressed as:
$$
\vec{q} = -\mathbf{K} \cdot \nabla T
$$
where $\vec{q}$ is the heat flux vector (W/m²), $\nabla T$ is the temperature gradient (K/m), and $\mathbf{K}$ is the thermal conductivity tensor. For many battery formats, this tensor can be simplified. A prismatic lithium-ion battery is often treated as orthotropic, with three principal conductivities: $\lambda_x$ (through-plane, normal to electrodes), $\lambda_y$, and $\lambda_z$ (the two in-plane directions). Frequently, $\lambda_y \approx \lambda_z = \lambda_{\parallel}$ (in-plane/lateral), and $\lambda_x = \lambda_{\perp}$ (through-plane/normal). A cylindrical lithium-ion battery, due to its wound structure, is often modeled with radial (through-plane, $\lambda_r$) and axial ($\lambda_z$) conductivities, where the circumferential (in-plane along the winding) conductivity is typically similar to the axial one, so $\lambda_{\theta} \approx \lambda_z = \lambda_{\parallel}$ and $\lambda_r = \lambda_{\perp}$.
The proposed Extreme Value Optimization Method operates on the following logical sequence:
- Experimental Characterization: A controlled heat source (e.g., a thin-film heater) is applied to a specific location on the surface of the intact lithium-ion battery cell. Multiple temperature sensors (thermocouples) monitor the transient thermal response at strategic points on the cell surface. The test is conducted in a quasi-adiabatic environment to minimize uncontrolled heat loss to the surroundings.
- Numerical Modeling: A corresponding 3D computational fluid dynamics (CFD) model of the lithium-ion battery is created. The model incorporates the known or previously measured isotropic properties (specific heat capacity, density) and the through-plane thermal conductivity $\lambda_{\perp}$. The lateral thermal conductivity $\lambda_{\parallel}$ is parameterized as a multiple N of the through-plane value: $\lambda_{\parallel} = N \cdot \lambda_{\perp}$. The boundary conditions (heater power, estimated external convection coefficients) are matched to the experiment.
- Iterative Optimization (The “Extreme Value” Search): A series of simulations are run with different assumed values of the multiplier N. For each simulation, the predicted temperature histories at the virtual sensor locations (corresponding to the experimental ones) are compared to the experimental data. The quality of the match is quantified using an Average Deviation Rate D, defined as:
$$
D = \frac{1}{i} \sum_{i} \left( \frac{1}{j} \sum_{j} \left| \frac{T_{S} – T_{E}}{T_{E}} \right| \right) \times 100\%
$$
where $i$ is the number of temperature monitoring points, $j$ is the number of data points at each location, $T_S$ is the simulated temperature (K), and $T_E$ is the experimentally measured temperature (K). - Parameter Determination: The value of N that minimizes the Average Deviation Rate D is identified. This optimal N represents the most probable ratio $\lambda_{\parallel} / \lambda_{\perp}$ for the tested lithium-ion battery, thereby characterizing its anisotropic thermal conductivity. The search algorithm ensures the ratio is determined within a small tolerance (e.g., ±0.1).
The process is illustrated in the following conceptual flowchart:
| Step | Action | Objective |
|---|---|---|
| 1 | Experiment: Heat cell & record T(t) at points TC1, TC2, TC3. | Obtain benchmark thermal response of the lithium-ion battery. |
| 2 | Simulation: Build model with λ_⊥ known, set λ_∥ = N * λ_⊥. | Create a digital twin with the anisotropy as an unknown parameter N. |
| 3 | Iteration: Run simulation for different N values (N=1, N=10, N=20…). | Generate a family of predicted thermal responses. |
| 4 | Comparison: Calculate deviation D between simulated and experimental T(t) for each N. | Quantify the fit quality for each assumed anisotropy. |
| 5 | Optimization: Identify the N value yielding the minimum deviation Dmin. | Determine the optimal λ_∥ / λ_⊥ ratio for the lithium-ion battery. |
Experimental and Numerical Setup
To demonstrate the method’s versatility, we applied it to two distinct types of commercial lithium-ion battery cells: a prismatic hard-case LiFePO4 (LFP) cell and a cylindrical 21700 format LiNiCoMnO2 (NCM) cell.
1. Lithium-ion Battery Samples and Experimental Procedure
Prismatic LFP Lithium-ion Battery: To enhance measurement accuracy for the core’s properties, the aluminum casing was carefully removed. The extracted core (comprising two paralleled sub-cores, each 7.8 mm × 77.6 mm × 103 mm) was sealed in a polyimide film to prevent electrolyte evaporation. A thin-film electric heater (40 mm × 80 mm) was attached to the central area of one of the large faces of a sub-core. Temperature was monitored at three key locations: TC1 at the center of the largest side face, TC2 on the large face 20 mm from the bottom edge, and TC3 at the center of the opposite large face (symmetrical to the heater).
Cylindrical 21700 NCM Lithium-ion Battery: The test was performed on the intact cell. A thin-film heater (67 mm × 30 mm) was wrapped around the central section of the cylindrical surface. Temperature sensors were placed at: TC1 at the center of the outer cylindrical surface, TC2 on the outer surface 10 mm from the top, and TC3 at the center of the inner core (estimated position).
Both lithium-ion battery setups were insulated to approach adiabatic conditions. The tests commenced from an initial ambient temperature of -20°C. A constant power of 15.3 W was applied to the prismatic LFP core, and 8.3 W to the cylindrical 21700 cell, until the temperature at point TC1 reached approximately 60°C. The temperature evolution was recorded throughout.
2. Numerical Simulation Models
Leveraging geometric symmetry, three-dimensional CAD models were created for one-quarter of the prismatic sub-core and one-eighth of the cylindrical lithium-ion battery. These models were discretized using high-quality meshes (approximately 384,242 elements for the prismatic and 151,989 for the cylindrical model), with time-step independence verified. The solver used the SIMPLE algorithm.
The material properties assigned to the lithium-ion battery models are summarized below. The through-plane conductivity $\lambda_{\perp}$ and specific heat capacity were taken from prior calibrated measurements or reliable literature for the respective cell types.
| Cell Type | Through-plane Conductivity, $\lambda_{\perp}$ (W/m·K) | Specific Heat Capacity, Cp (J/kg·K) | Density, $\rho$ (kg/m³) | External Convection Coefficient, h (W/m²·K) |
|---|---|---|---|---|
| Prismatic LFP Core | 0.28 | 1040 | ~2100 | 3.25 |
| Cylindrical 21700 NCM | 0.31 | 1100 | ~2500 | 3.28 |
The lateral conductivity was set as the variable parameter: $\lambda_{\parallel} = N \times \lambda_{\perp}$. Symmetry faces were set as adiabatic. The heater was modeled as a constant heat flux boundary condition matching the experimental input power.
Results: Determining Anisotropy in Lithium-ion Battery Cells
The Extreme Value Optimization Method was executed for both lithium-ion battery types. Initial simulations assuming isotropic behavior ($N = 1$, i.e., $\lambda_{\parallel} = \lambda_{\perp}$) resulted in significant deviations from experimental data, with average deviation rates D of 8.09% for the prismatic and 5.21% for the cylindrical cell, confirming the invalidity of the isotropic assumption.
The search for the optimal N was then performed. The following table and description detail the process and the final result for the prismatic LFP lithium-ion battery core.
| Assumed Ratio N (λ∥/λ⊥) | Simulated Avg. Deviation Rate D (%) | Remarks |
|---|---|---|
| 1.0 | 8.09 | Isotropic assumption, poor fit. |
| 10.0 | 4.82 | Deviation reduces significantly. |
| 30.0 | 1.15 | Fit improves substantially. |
| 40.0 | 0.12 | Very close to optimal. |
| 40.5 | 0.041 | Minimum Deviation (D_min) found. |
| 41.0 | 0.15 | Deviation increases slightly. |
A similar process was conducted for the cylindrical 21700 NCM lithium-ion battery.
| Assumed Ratio N (λ∥/λ⊥) | Simulated Avg. Deviation Rate D (%) | Remarks |
|---|---|---|
| 1.0 | 5.21 | Isotropic assumption, poor fit. |
| 5.0 | 2.98 | Improvement observed. |
| 15.0 | 0.89 | Good fit approached. |
| 20.0 | 0.098 | Near-optimal. |
| 20.3 | 0.058 | Minimum Deviation (D_min) found. |
| 20.6 | 0.11 | Deviation increases slightly. |
The results are striking and conclusive. The optimal multiplier N was found to be 40.5 for the prismatic LFP core and 20.3 for the cylindrical NCM 21700 lithium-ion battery. Therefore, the characterized thermal conductivities are:
- Prismatic LFP Lithium-ion Battery Core: $\lambda_{\parallel} = 40.5 \times \lambda_{\perp} \approx 11.34 \text{ W/m·K}$ (assuming $\lambda_{\perp}=0.28$ W/m·K).
- Cylindrical 21700 NCM Lithium-ion Battery: $\lambda_{\parallel} = 20.3 \times \lambda_{\perp} \approx 6.29 \text{ W/m·K}$ (assuming $\lambda_{\perp}=0.31$ W/m·K).
The final comparison between the experimental temperature curves and the simulation results using the optimal N values showed exceptional agreement, visually validating the derived anisotropic properties for each lithium-ion battery type.
Discussion and Significance
The findings underscore a fundamental and strong anisotropic nature of heat conduction in lithium-ion battery cells. The in-plane thermal conductivity is not merely slightly higher but is orders of magnitude greater than the through-plane conductivity. This has profound implications:
- Thermal Modeling Fidelity: Treating a lithium-ion battery as an isotropic homogeneous solid in thermal simulations will lead to substantial inaccuracies in predicting internal temperature gradients, hotspot locations, and overall thermal behavior. The presented anisotropy ratios (40.5 and 20.3) must be accounted for in high-fidelity models.
- Design Implications for Cooling: The high in-plane conductivity facilitates heat spreading along the electrode layers. This suggests that for prismatic cells, cooling applied to the large faces (parallel to the electrodes) can effectively draw heat from a larger volume. For cylindrical cells, the axial direction serves as an efficient heat spreading path, which influences the optimal placement of cooling jackets or fins.
- Variability Between Cell Types: The significant difference in the anisotropy ratio between the prismatic LFP (40.5) and cylindrical NCM (20.3) lithium-ion battery cells highlights that this property is not generic. It depends on the specific electrode composition, manufacturing process (stacking vs. winding), internal pressure, and cell format. Therefore, characterization should be cell-specific.
- Advantages of the Method: The Extreme Value Optimization Method offers several benefits:
- Non-Destructive: It works on intact, operational lithium-ion battery cells (“in-situ”).
- Integrative: It captures the effective, macroscopic property of the composite structure, including all internal contact resistances.
- Practically Feasible: It requires standard thermal testing equipment and commercial CFD software, making it accessible for battery engineers and researchers.
Validation of the Methodology
To verify the accuracy and reliability of the Extreme Value Optimization Method itself, a validation test was performed using standard samples with known, isotropic thermal properties: a prismatic block and a cylindrical rod of high-purity quartz glass. The same experimental protocol (heater attachment, temperature monitoring, insulation) and numerical simulation workflow were applied. The known isotropic thermal conductivity of the glass was used as both $\lambda_{\perp}$ and $\lambda_{\parallel}$ in the simulation (i.e., N=1 was the ground truth).
The results showed excellent agreement between the simulated (with N=1) and experimental temperature histories. The calculated Average Deviation Rates were 0.4% for the glass block and 0.6% for the glass rod. This successful validation on a material with known properties confirms that the proposed method’s procedure, including its handling of boundary conditions and heat losses, is sound and can determine thermal transport parameters with high precision when applied to a lithium-ion battery.
Conclusion
This work successfully establishes and validates a practical methodology, the Extreme Value Optimization Method, for characterizing the highly anisotropic thermal conductivity of lithium-ion battery cells. The method synergistically combines targeted experimental heating tests with iterative 3D numerical simulation to deduce the ratio of in-plane to through-plane thermal conductivity.
Key conclusions are:
- The thermal conductivity of a lithium-ion battery is profoundly anisotropic. For the studied cells, the in-plane conductivity was found to be over 40 times greater than the through-plane conductivity for a prismatic LFP core, and over 20 times greater for a cylindrical 21700 NCM lithium-ion battery.
- The degree of anisotropy is not a universal constant but varies significantly with lithium-ion battery chemistry, design, and format, necessitating cell-specific characterization.
- The proposed method was rigorously validated using standard quartz glass samples, demonstrating a high level of accuracy with deviation rates below 0.6%.
Accurate knowledge of these anisotropic thermal properties is indispensable for developing predictive thermal models, designing effective thermal management systems, and conducting reliable safety assessments for lithium-ion battery packs. The Extreme Value Optimization Method provides researchers and engineers with a robust and accessible tool to obtain this critical information for various lithium-ion battery types.