
Lithium-ion batteries have emerged as a cornerstone technology in the global transition toward carbon neutrality, powering electric vehicles, portable electronics, and grid-scale energy storage systems. Their widespread adoption is driven by high energy density, long cycle life, and declining costs. However, the safety and longevity of lithium-ion batteries are persistently challenged by parasitic side reactions, among which lithium plating on the anode during charging poses a significant risk. Lithium plating refers to the reduction of lithium ions to metallic lithium that deposits on the graphite anode surface, a process that occurs when the local anode potential falls below 0 V versus Li/Li⁺. This phenomenon is often triggered under extreme operating conditions such as low temperatures, fast charging, or overcharging, exacerbated by design flaws like improper negative-to-positive capacity ratios or electrode defects. The deposited lithium can be partially reversible, re-intercalating during discharge, but irreversible plating leads to continuous solid electrolyte interphase (SEI) growth, accumulation of “dead lithium,” and dendritic growth. These effects accelerate capacity fade, increase internal resistance, and, in severe cases, cause internal short circuits and thermal runaway, raising critical safety concerns. Consequently, developing reliable in-situ detection methods for lithium plating is paramount for real-time monitoring, safety prediction, and lifespan extension of lithium-ion batteries.
Traditional post-mortem techniques, such as titration, microscopy, or X-ray photoelectron spectroscopy, require battery disassembly, making them unsuitable for online monitoring. In contrast, in-situ methods enable non-destructive, real-time observation of lithium plating during battery operation, offering insights into dynamic electrochemical processes. This review systematically categorizes and analyzes existing in-situ detection strategies from quantitative and qualitative perspectives, integrating electrochemical, physical, and mechanical approaches. We further explore the correlation between lithium plating and battery safety from thermal and performance viewpoints, providing a framework for hazard assessment. Finally, we outline future directions for advancing detection technologies, emphasizing multi-method fusion and intelligent early-warning systems to enhance the safety and reliability of lithium-ion batteries in practical applications.
Mechanisms and Influencing Factors of Lithium Plating in Lithium-Ion Batteries
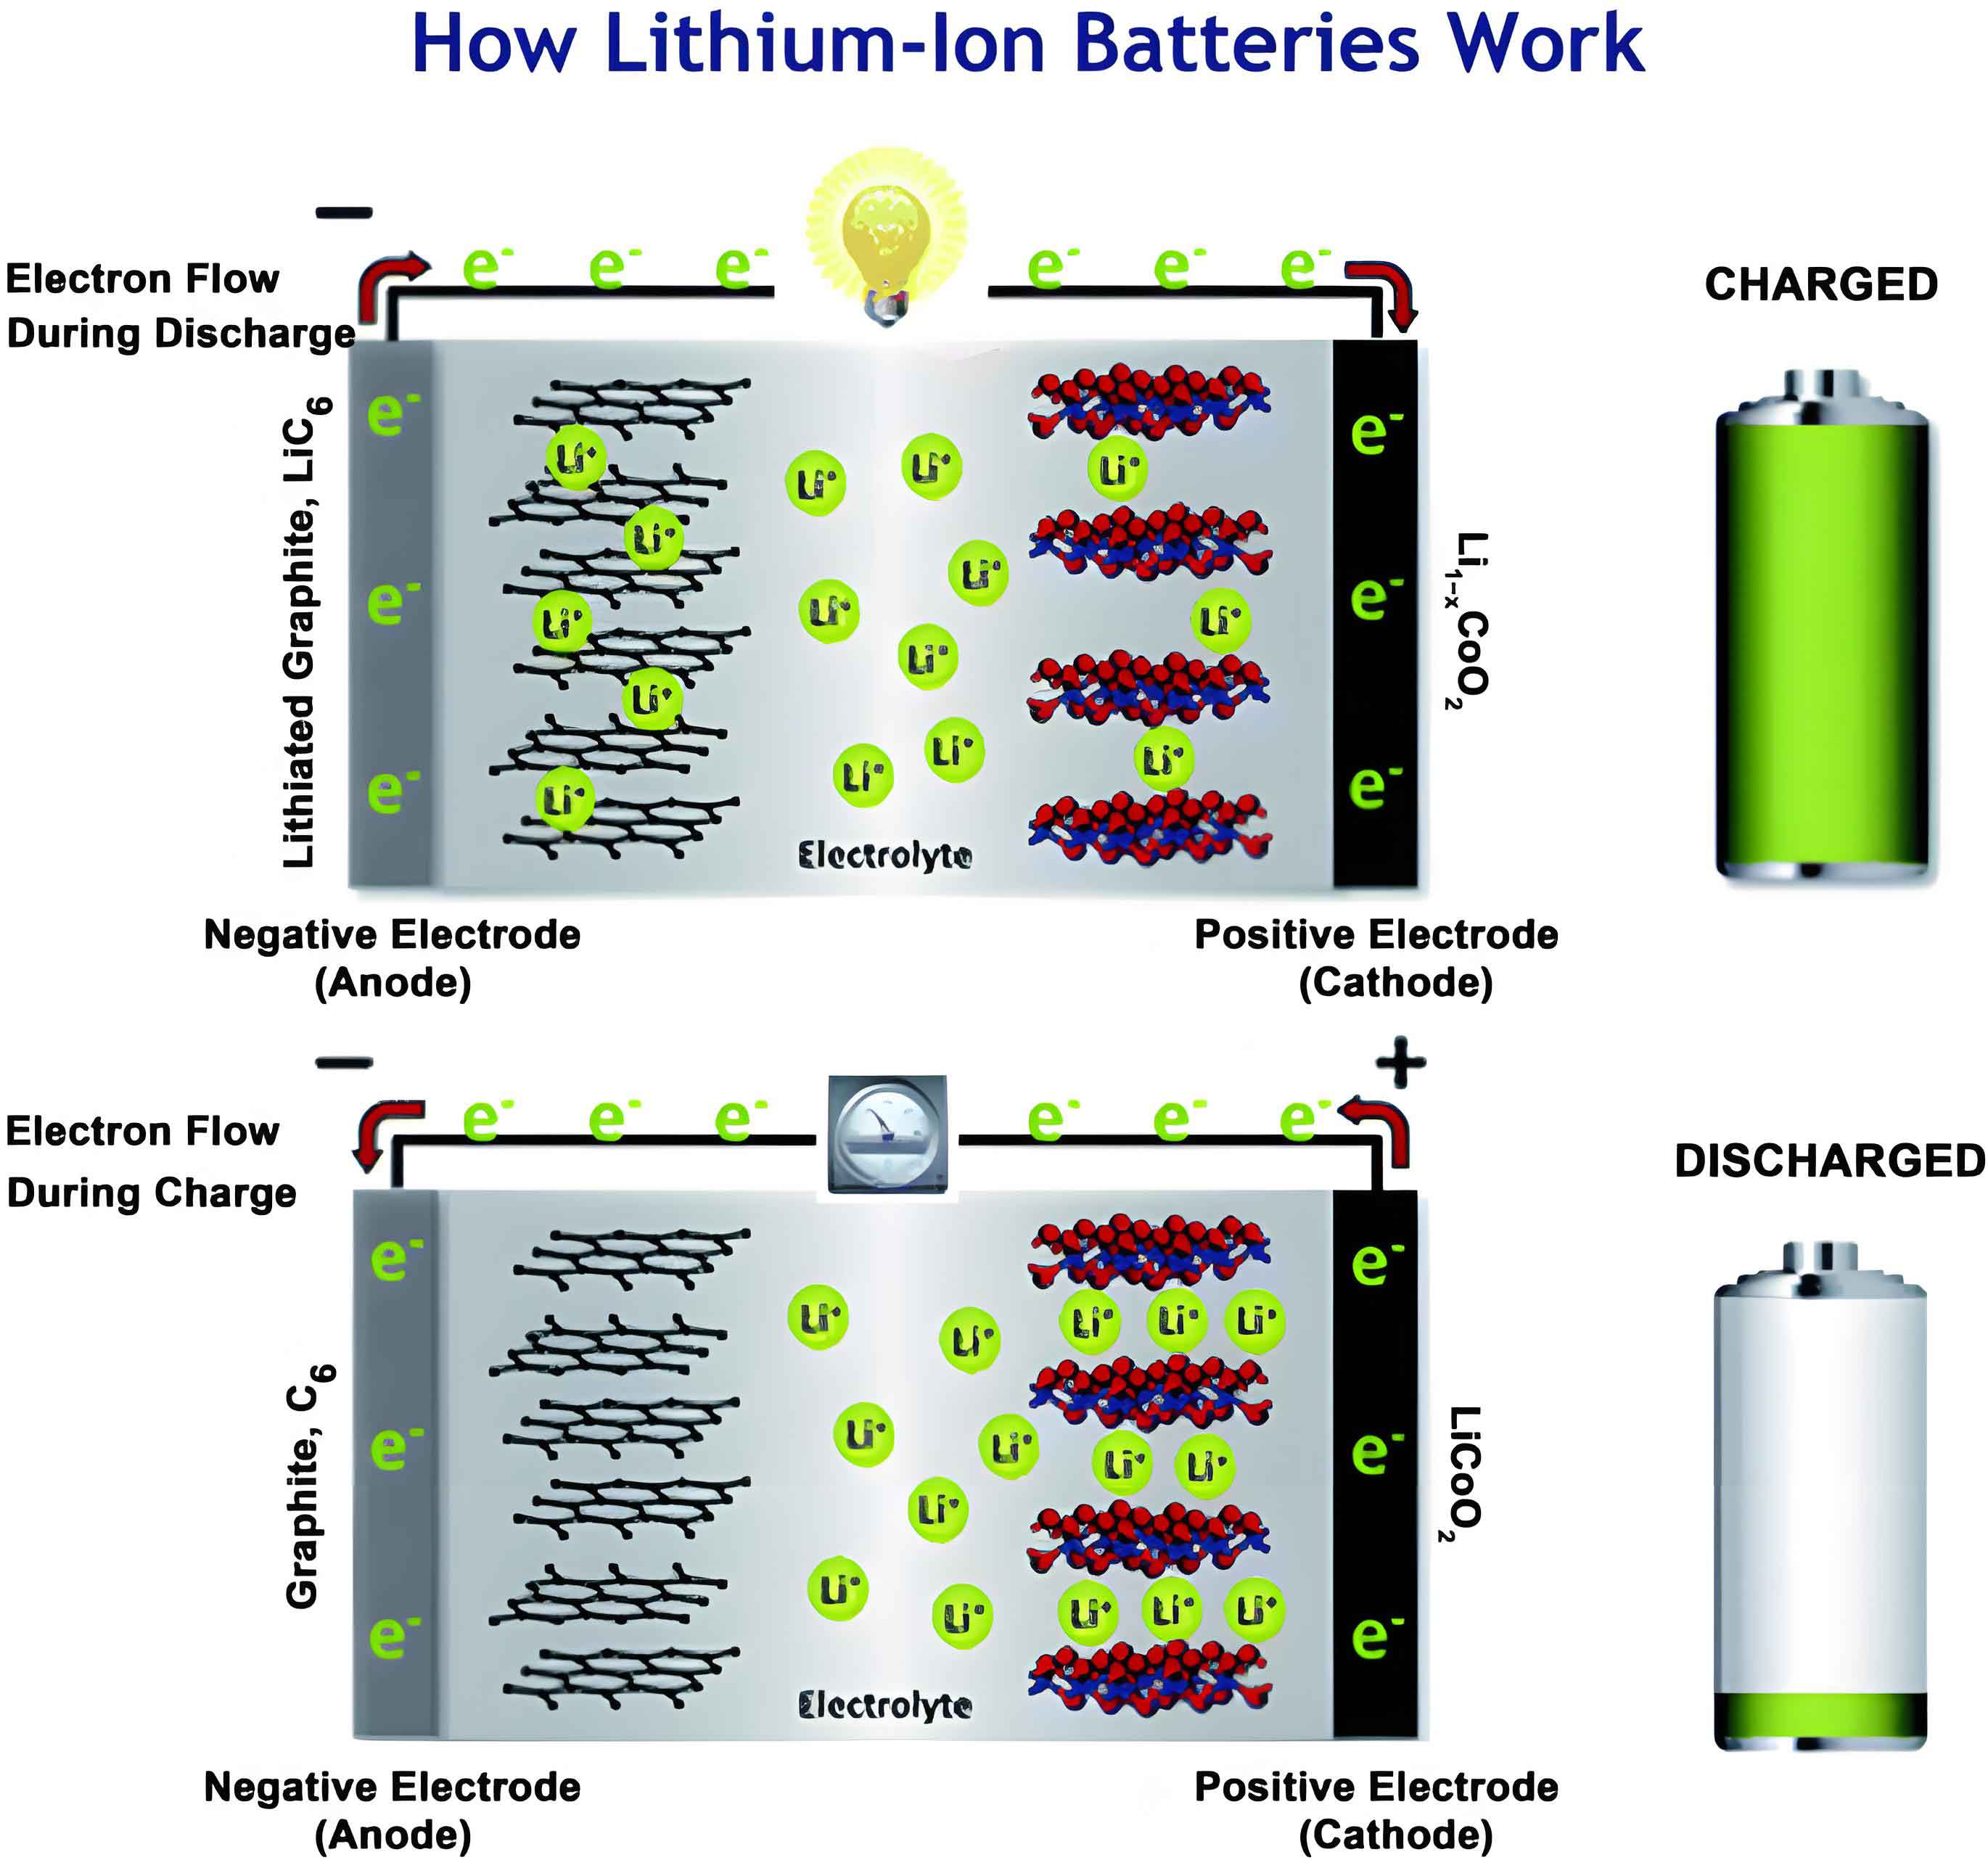
The occurrence of lithium plating in lithium-ion batteries is governed by electrochemical thermodynamics and kinetics. Under normal charging conditions, lithium ions intercalate into the graphite anode layers without metallic deposition. However, when the anode potential drops below 0 V versus Li/Li⁺, the driving force for lithium reduction exceeds that for intercalation, leading to plating. The Nernst equation describes the equilibrium potential for lithium deposition:
$$ E_{\text{Li}} = E^0_{\text{Li}} – \frac{RT}{F} \ln a_{\text{Li}^+} $$
where \( E^0_{\text{Li}} \) is the standard potential for Li/Li⁺ (0 V by definition), \( R \) is the gas constant, \( T \) is temperature, \( F \) is Faraday’s constant, and \( a_{\text{Li}^+} \) is the activity of lithium ions. In practice, the anode potential \( \eta_{\text{anode}} \) during charging is influenced by overpotentials due to charge transfer, diffusion, and ohmic losses:
$$ \eta_{\text{anode}} = E_{\text{anode}} – i R_{\Omega} – \eta_{\text{ct}} – \eta_{\text{diff}} $$
where \( E_{\text{anode}} \) is the equilibrium potential, \( i \) is current, \( R_{\Omega} \) is ohmic resistance, \( \eta_{\text{ct}} \) is charge-transfer overpotential, and \( \eta_{\text{diff}} \) is diffusion overpotential. Lithium plating initiates when \( \eta_{\text{anode}} < 0 \) V.
The risk of lithium plating in lithium-ion batteries is amplified by several factors, which can be categorized into design/manufacturing stages and operational conditions. Table 1 summarizes these factors and their impacts on lithium plating in lithium-ion batteries.
| Category | Factors | Impact on Lithium Plating |
|---|---|---|
| Design & Manufacturing | Low N/P ratio (anode-to-cathode capacity) | Insufficient anode capacity leads to early lithium saturation and plating. |
| Electrode defects (e.g., coating inhomogeneity, voids) | Local current density hotspots promote preferential plating. | |
| Operational Conditions | Low temperature (<15°C) | Reduced lithium-ion diffusion coefficient in graphite slows intercalation kinetics, increasing polarization. |
| Fast charging (high C-rates) | High current density exceeds intercalation rate, causing anode potential drop. | |
| Overcharging (above upper voltage limit) | Excess lithium ions force plating when graphite is fully lithiated. | |
| Aging (prolonged cycling) | Loss of lithium inventory and anode active material exacerbates plating tendency. |
Mathematically, the critical current density \( i_{\text{crit}} \) below which plating is avoided can be estimated from Sand’s time model for diffusion-limited processes:
$$ i_{\text{crit}} = \frac{z F D C_0}{\delta} $$
where \( z \) is charge number, \( D \) is diffusion coefficient, \( C_0 \) is bulk concentration, and \( \delta \) is diffusion layer thickness. At low temperatures, \( D \) decreases exponentially, lowering \( i_{\text{crit}} \) and making lithium-ion batteries more susceptible to plating even at moderate currents.
Quantitative In-Situ Detection Methods for Lithium Plating in Lithium-Ion Batteries
Quantitative methods aim to measure the amount of plated lithium, either reversibly or irreversibly, enabling precise assessment of degradation. These techniques often leverage electrochemical signatures or advanced physical characterization.
Differential Voltage (DV) Analysis
DV analysis derives from the voltage-capacity curve during discharge. When lithium plating occurs during charging, a portion of the plated lithium strips during discharge, creating a distinct voltage plateau. The derivative \( \frac{dV}{dQ} \) exhibits a peak corresponding to this stripping process. The charge associated with stripping, \( Q_{\text{stripping}} \), quantifies the reversible plated lithium mass \( m_{\text{plating}} \):
$$ m_{\text{plating}} = \frac{Q_{\text{plating}}}{F} \cdot M_{\text{Li}} $$
where \( M_{\text{Li}} \) is the molar mass of lithium. To mitigate capacity variations, normalized DV analysis is used:
$$ Q \left( \frac{dV}{dQ} \right)_{\text{cell,cal}} = Q_{\text{nom,cathode}} \left( \frac{dV}{dQ} \right)_{\text{cathode}} – Q_{\text{nom,anode}} \left( \frac{dV}{dQ} \right)_{\text{anode}} $$
DV analysis is advantageous for lithium-ion batteries as it requires only voltage data from the battery management system, but it demands low discharge rates and immediate testing after charging for accuracy.
Differential Voltage Relaxation (DVR) Analysis
After charging, the open-circuit voltage relaxation curve often shows a “dual-plateau” feature if lithium plating occurred: the first plateau corresponds to the mixed potential of Li/LiₓC₆, and the second to pure LiₓC₆ after plated lithium re-intercalates. The derivative \( \frac{dV}{dt} \) highlights these plateaus, with peak time \( \tau \) correlating to plated lithium quantity. A model-based approach decomposes relaxation voltage into diffusion and plating components, fitting the \( \frac{dV}{dt} \) curve to extract irreversible capacity loss. DVR is sensitive but requires prolonged relaxation and is less effective at temperatures above 30°C due to faster kinetics.
Incremental Capacity (IC) Analysis
IC analysis plots \( \frac{dQ}{dV} \) versus voltage, where peaks represent phase transitions in electrode materials. In lithium-ion batteries with graphite anodes, the appearance of new peaks or shifts in existing ones can indicate lithium plating. Combining IC with mechanistic modeling allows quantification of loss of lithium inventory (LLI) and plating-induced degradation. The IC curve for a lithium iron phosphate (LFP) battery exhibits characteristic peaks; plating manifests as an additional peak during discharge. The integrated charge under anomalous peaks estimates plated lithium. However, IC requires low-current data to minimize noise, posing challenges for dynamic applications in lithium-ion batteries.
Nuclear Magnetic Resonance (NMR) Spectroscopy
NMR provides atomic-level insights into lithium environments. Metallic lithium and intercalated lithium exhibit distinct chemical shifts in ⁷Li NMR spectra. The signal intensity at ~266 ppm corresponds to plated lithium, while intercalated lithium appears at 30–50 ppm. In-situ NMR can track the evolution of these signals during cycling, quantifying dead lithium and SEI formation. The total plated lithium mass \( m_{\text{Li}} \) is proportional to the integrated NMR peak area \( A \):
$$ m_{\text{Li}} = k \cdot A $$
where \( k \) is a calibration constant. NMR is non-destructive and highly sensitive but limited by cost, sample size, and spatial resolution for microscopic lithium structures in lithium-ion batteries.
X-Ray Techniques
X-ray diffraction (XRD) and X-ray computed tomography (XCT) offer spatial and crystallographic information. XRD detects metallic lithium peaks (e.g., at 2θ ≈ 36° for Li (110) plane), with intensity proportional to plated amount. In-situ synchrotron XRD can map heterogeneous plating distribution. XCT reconstructs 3D images of lithium deposits, enabling volume fraction calculation. For example, the volume fraction of mossy lithium \( f_{\text{mossy}} \) is:
$$ f_{\text{mossy}} = \frac{V_{\text{mossy}}}{V_{\text{total}}} $$
X-ray methods are powerful for visualizing plating morphology but require specialized equipment and may suffer from contrast issues in lithium-ion batteries.
Table 2 compares quantitative in-situ detection methods for lithium plating in lithium-ion batteries.
| Method | Principle | Advantages | Limitations |
|---|---|---|---|
| DV Analysis | Voltage derivative during discharge stripping peak | Uses BMS data; non-invasive | Low sensitivity for minor plating; needs slow discharge |
| DVR Analysis | Voltage relaxation derivative post-charging | High sensitivity for reversible plating | Time-consuming; temperature-sensitive |
| IC Analysis | Capacity derivative peaks from phase transitions | Quantifies degradation modes; integrates with models | Requires low-current data; noisy in dynamic cycles |
| NMR Spectroscopy | Chemical shift differences between Li⁰ and Li⁺ | Atomic-level quantification; non-destructive | Expensive; limited spatial resolution |
| X-Ray Techniques | Diffraction or tomography of metallic Li | Spatial mapping; 3D visualization | High cost; complex instrumentation |
Qualitative In-Situ Detection Methods for Lithium Plating in Lithium-Ion Batteries
Qualitative methods identify the onset or presence of lithium plating without precise quantification, often relying on electrochemical or mechanical signatures.
Reference Electrode (RE) Method
Inserting a reference electrode (e.g., lithium metal or Li₄Ti₅O₁₂) into a lithium-ion battery creates a three-electrode cell, enabling direct measurement of anode potential \( E_{\text{anode}} \). Plating is detected when \( E_{\text{anode}} < 0 \) V versus Li/Li⁺ during charging. The plating onset time \( t_{\text{plating}} \) and plating power \( P_{\text{plating}} \) can be defined:
$$ P_{\text{plating}} = i \cdot |E_{\text{anode}}| \quad \text{for} \quad E_{\text{anode}} < 0 $$
RE provides real-time detection but may perturb cell chemistry and is not yet commercialized for widespread use in lithium-ion batteries.
Coulombic Efficiency (CE) Monitoring
CE is the ratio of discharge to charge capacity per cycle. Lithium plating consumes active lithium irreversibly, causing CE to deviate from unity. A sharp drop in CE indicates plating onset. The CE deviation \( \Delta \text{CE} \) is:
$$ \Delta \text{CE} = 1 – \frac{Q_{\text{discharge}}}{Q_{\text{charge}}} $$
CE monitoring is simple but requires high-precision equipment and stable conditions to isolate plating from other aging effects in lithium-ion batteries.
Electrochemical Impedance Spectroscopy (EIS)
EIS measures impedance across frequencies, with Nyquist plots showing arcs for SEI resistance (\( R_{\text{SEI}} \)), charge-transfer resistance (\( R_{\text{ct}} \)), and diffusion. Lithium plating alters these parameters: \( R_{\text{ct}} \) may decrease due to increased surface area, while \( R_{\text{SEI}} \) increases from SEI growth. Dynamic EIS during charging can detect plating via sudden changes in mid-frequency impedance. The total interfacial resistance \( R_{\text{int}} \) is:
$$ R_{\text{int}} = R_{\text{SEI}} + R_{\text{ct}} $$
EIS is non-destructive but requires sophisticated analyzers and may suffer from overlapping arcs in lithium-ion batteries.
Thickness and Pressure Measurements
Lithium plating causes volume expansion due to metallic lithium’s lower density than intercalated compounds. In-situ thickness gauges or pressure sensors detect swelling. The thickness change \( \Delta L \) correlates with plated lithium volume \( V_{\text{Li}} \):
$$ \Delta L = \alpha \cdot V_{\text{Li}} $$
where \( \alpha \) is a geometric factor. Similarly, pressure derivative \( \frac{dP}{dV} \) shows anomalies during plating. These methods are sensitive for soft-pack lithium-ion batteries but vulnerable to environmental noise and require precise instrumentation.
Table 3 summarizes qualitative in-situ detection methods for lithium plating in lithium-ion batteries.
| Method | Detection Signal | Advantages | Limitations |
|---|---|---|---|
| Reference Electrode | Anode potential vs. Li/Li⁺ | Direct onset detection; real-time | Invasive; not standard in commercial cells |
| Coulombic Efficiency | Deviation from unity in charge/discharge ratio | Simple; indicative of irreversible loss | Needs high precision; conflated with other aging |
| Electrochemical Impedance Spectroscopy | Changes in \( R_{\text{ct}} \) and \( R_{\text{SEI}} \) | Non-destructive; mechanistic insights | Costly equipment; complex data analysis |
| Thickness/Pressure | Volume expansion or pressure rise | Mechanically robust; sensitive for soft packs | Environmentally sensitive; less effective for hard cases |
Safety Assessment of Lithium Plating in Lithium-Ion Batteries: Thermal and Performance Perspectives
Lithium plating compromises safety through two primary avenues: thermal instability and performance degradation. A holistic safety framework integrates both aspects to define hazardous plating thresholds for lithium-ion batteries.
Thermal Safety
Plated lithium reacts exothermically with electrolyte, lowering thermal runaway onset temperature. Differential scanning calorimetry (DSC) and accelerating rate calorimetry (ARC) quantify heat flow. The total heat release \( Q_{\text{total}} \) from plating-related reactions is:
$$ Q_{\text{total}} = \int \Delta H \cdot dm_{\text{Li}} $$
where \( \Delta H \) is enthalpy of reaction. ARC identifies characteristic temperatures: self-heating onset \( T_1 \), thermal runaway trigger \( T_2 \), and maximum temperature \( T_3 \). Studies show that plated lithium reduces \( T_1 \) and \( T_3 \), increasing risk. For instance, a lithium-ion battery with plating may exhibit \( T_1 \) below 70°C, compared to >100°C for plating-free cells.
Performance Safety
Irreversible plating accelerates capacity fade and resistance growth, leading to sudden failure. The capacity loss rate \( \frac{dC}{dN} \) per cycle relates to plated lithium mass \( m_{\text{irr}} \):
$$ \frac{dC}{dN} = -\beta \cdot m_{\text{irr}} $$
where \( \beta \) is a degradation coefficient. Performance safety boundaries can be defined via plating reversibility stages: Stage I (100% reversible, no degradation), Stage II (<90% reversible, nonlinear fade), and Stage III (<50% reversible, hazard). The critical plating amount \( m_{\text{crit}} \) for safety is empirically derived from cycling tests on lithium-ion batteries.
Table 4 outlines safety indicators linked to lithium plating in lithium-ion batteries.
| Safety Dimension | Key Parameters | Hazard Thresholds | Detection Methods |
|---|---|---|---|
| Thermal Safety | Onset temperature \( T_1 \), heat release \( Q \) | \( T_1 < 70^\circ \text{C} \); \( Q > 500 \text{ J/g} \) | ARC, DSC coupled with plating quantification |
| Performance Safety | Capacity fade rate \( \frac{dC}{dN} \), impedance rise \( \Delta R \) | \( \frac{dC}{dN} > 0.5\%/\text{cycle} \); \( \Delta R > 50\% \) | IC analysis, EIS, DV/DVR for plating correlation |
Integrating these metrics enables real-time safety prediction for lithium-ion batteries. For example, a machine learning model can fuse voltage relaxation data and impedance to estimate plating mass and trigger alerts if \( m_{\text{plating}} > m_{\text{crit}} \).
Future Directions for In-Situ Detection of Lithium Plating in Lithium-Ion Batteries
Advancements in detection technology must address current limitations to enable proactive safety management. Key future research areas include:
- Multi-Method Fusion and Data Integration: Combining complementary techniques (e.g., EIS with DV analysis) enhances accuracy. Sensor fusion algorithms can merge signals from reference electrodes, pressure sensors, and voltage monitors in lithium-ion batteries. A Bayesian framework updates plating probability \( P(\text{plating}) \) based on multi-modal data \( D \):
$$ P(\text{plating} | D) = \frac{P(D | \text{plating}) P(\text{plating})}{P(D)} $$
- Miniaturized and Embedded Sensors: Developing micro-reference electrodes or thin-film strain gauges for integration into commercial lithium-ion batteries allows continuous monitoring without performance sacrifice.
- Machine Learning and Big Data Analytics: Training deep neural networks on large datasets from cycling tests can identify subtle plating signatures. Features like voltage plateau duration or impedance phase angles serve as inputs for early warning systems in lithium-ion batteries.
- Standardized Safety Protocols: Establishing universal safety criteria linking plating extent to thermal runaway risk and performance loss will guide battery management system design. This involves defining \( m_{\text{crit}} \) for various lithium-ion battery chemistries and formats.
- Advanced Physical Characterization: Improving spatial resolution of in-situ NMR or X-ray imaging will elucidate plating morphology evolution, aiding mechanistic models for lithium-ion batteries.
The convergence of these efforts will transform lithium plating detection from a diagnostic tool to a predictive safety asset, extending the operational envelope of lithium-ion batteries in demanding applications.
Conclusion
Lithium plating remains a critical challenge for the safety and durability of lithium-ion batteries, necessitating robust in-situ detection strategies. This review has systematically examined quantitative methods like differential voltage analysis, nuclear magnetic resonance, and X-ray techniques, which offer precise plating quantification, alongside qualitative approaches such as reference electrode measurements, coulombic efficiency monitoring, electrochemical impedance spectroscopy, and mechanical sensing, which provide real-time onset detection. We further proposed a dual-dimensional safety assessment framework encompassing thermal and performance metrics to correlate plating extent with hazard levels. While current methods exhibit trade-offs in sensitivity, cost, and practicality, future innovations in multi-sensor fusion, embedded diagnostics, and artificial intelligence promise to overcome these barriers. Ultimately, advancing in-situ detection capabilities will enable proactive management of lithium-ion batteries, mitigating plating risks and fostering safer, longer-lasting energy storage solutions for a sustainable future.