
Accurate State of Charge (SOC) estimation is a cornerstone for reliable Battery Management Systems (BMS), ensuring safety, longevity, and optimal performance of lithium-ion batteries. However, SOC is an internal state that cannot be measured directly, as it is intricately coupled with complex, nonlinear electrochemical dynamics within the cell. This challenge is particularly pronounced for Lithium Iron Phosphate (LiFePO4) batteries, which are widely favored in electric vehicles and energy storage systems due to their superior safety, long cycle life, and thermal stability.
The primary hurdle in estimating SOC for a LiFePO4 battery stems from its distinctive open-circuit voltage (OCV) characteristic, which features an extended, flat plateau region. Within this plateau, the voltage exhibits minimal sensitivity to large changes in SOC, making traditional voltage-based estimation methods highly susceptible to measurement noise and small errors, leading to significant inaccuracies. While data-driven approaches, particularly deep learning models like Long Short-Term Memory (LSTM) networks, have shown remarkable promise in capturing complex battery dynamics, their performance remains fundamentally limited by the quality and information content of the input features. Relying solely on electrical signals (voltage, current) and temperature for a LiFePO4 battery often proves insufficient due to this inherent voltage plateau problem.
To overcome this limitation, this work proposes a novel fusion approach that integrates the mechanical behavior of the LiFePO4 battery with its electrical and thermal responses. During charge and discharge cycles, lithium intercalation and deintercalation cause active material expansion and contraction, leading to measurable mechanical strain and swelling force. This swelling force exhibits a highly nonlinear and monotonic relationship with SOC, especially within the critical voltage plateau region where electrical signals are less informative. By incorporating this swelling force signal as an additional input dimension, we create a multi-modal “Force-Electric-Temperature” data stream that provides a more comprehensive representation of the internal state of the LiFePO4 battery.
Furthermore, to effectively learn from this multi-dimensional sequential data, we design a dedicated hybrid deep learning model. The model combines a 1D Convolutional Neural Network (CNN) for extracting local temporal patterns and hierarchical features from the input sequences, with a Bidirectional Long Short-Term Memory (Bi-LSTM) network to capture long-term temporal dependencies in both forward and backward directions. This CNN-BiLSTM architecture is specifically tailored to model the complex, time-dependent mapping between the fused sensor data and the target SOC of the LiFePO4 battery.
We validate our proposed method through extensive experimental testing on a commercial LiFePO4 battery under multiple dynamic driving profiles (FUDS and US06) and across a wide temperature range (0°C, 10°C, 25°C, and 40°C). The results demonstrate that the inclusion of the swelling force signal dramatically improves estimation accuracy compared to using only electric and temperature signals. Moreover, the proposed CNN-BiLSTM model outperforms other conventional neural network architectures. This study presents a significant advancement towards robust and high-precision SOC estimation for LiFePO4 batteries, directly addressing a key bottleneck in their BMS technology.
Experimental Methodology
To generate a comprehensive dataset for model development and validation, a systematic experimental campaign was conducted. The core objective was to capture the synchronized Force-Electric-Temperature response of a LiFePO4 battery under realistic, dynamic operating conditions and across different thermal environments.
Test Object and Equipment
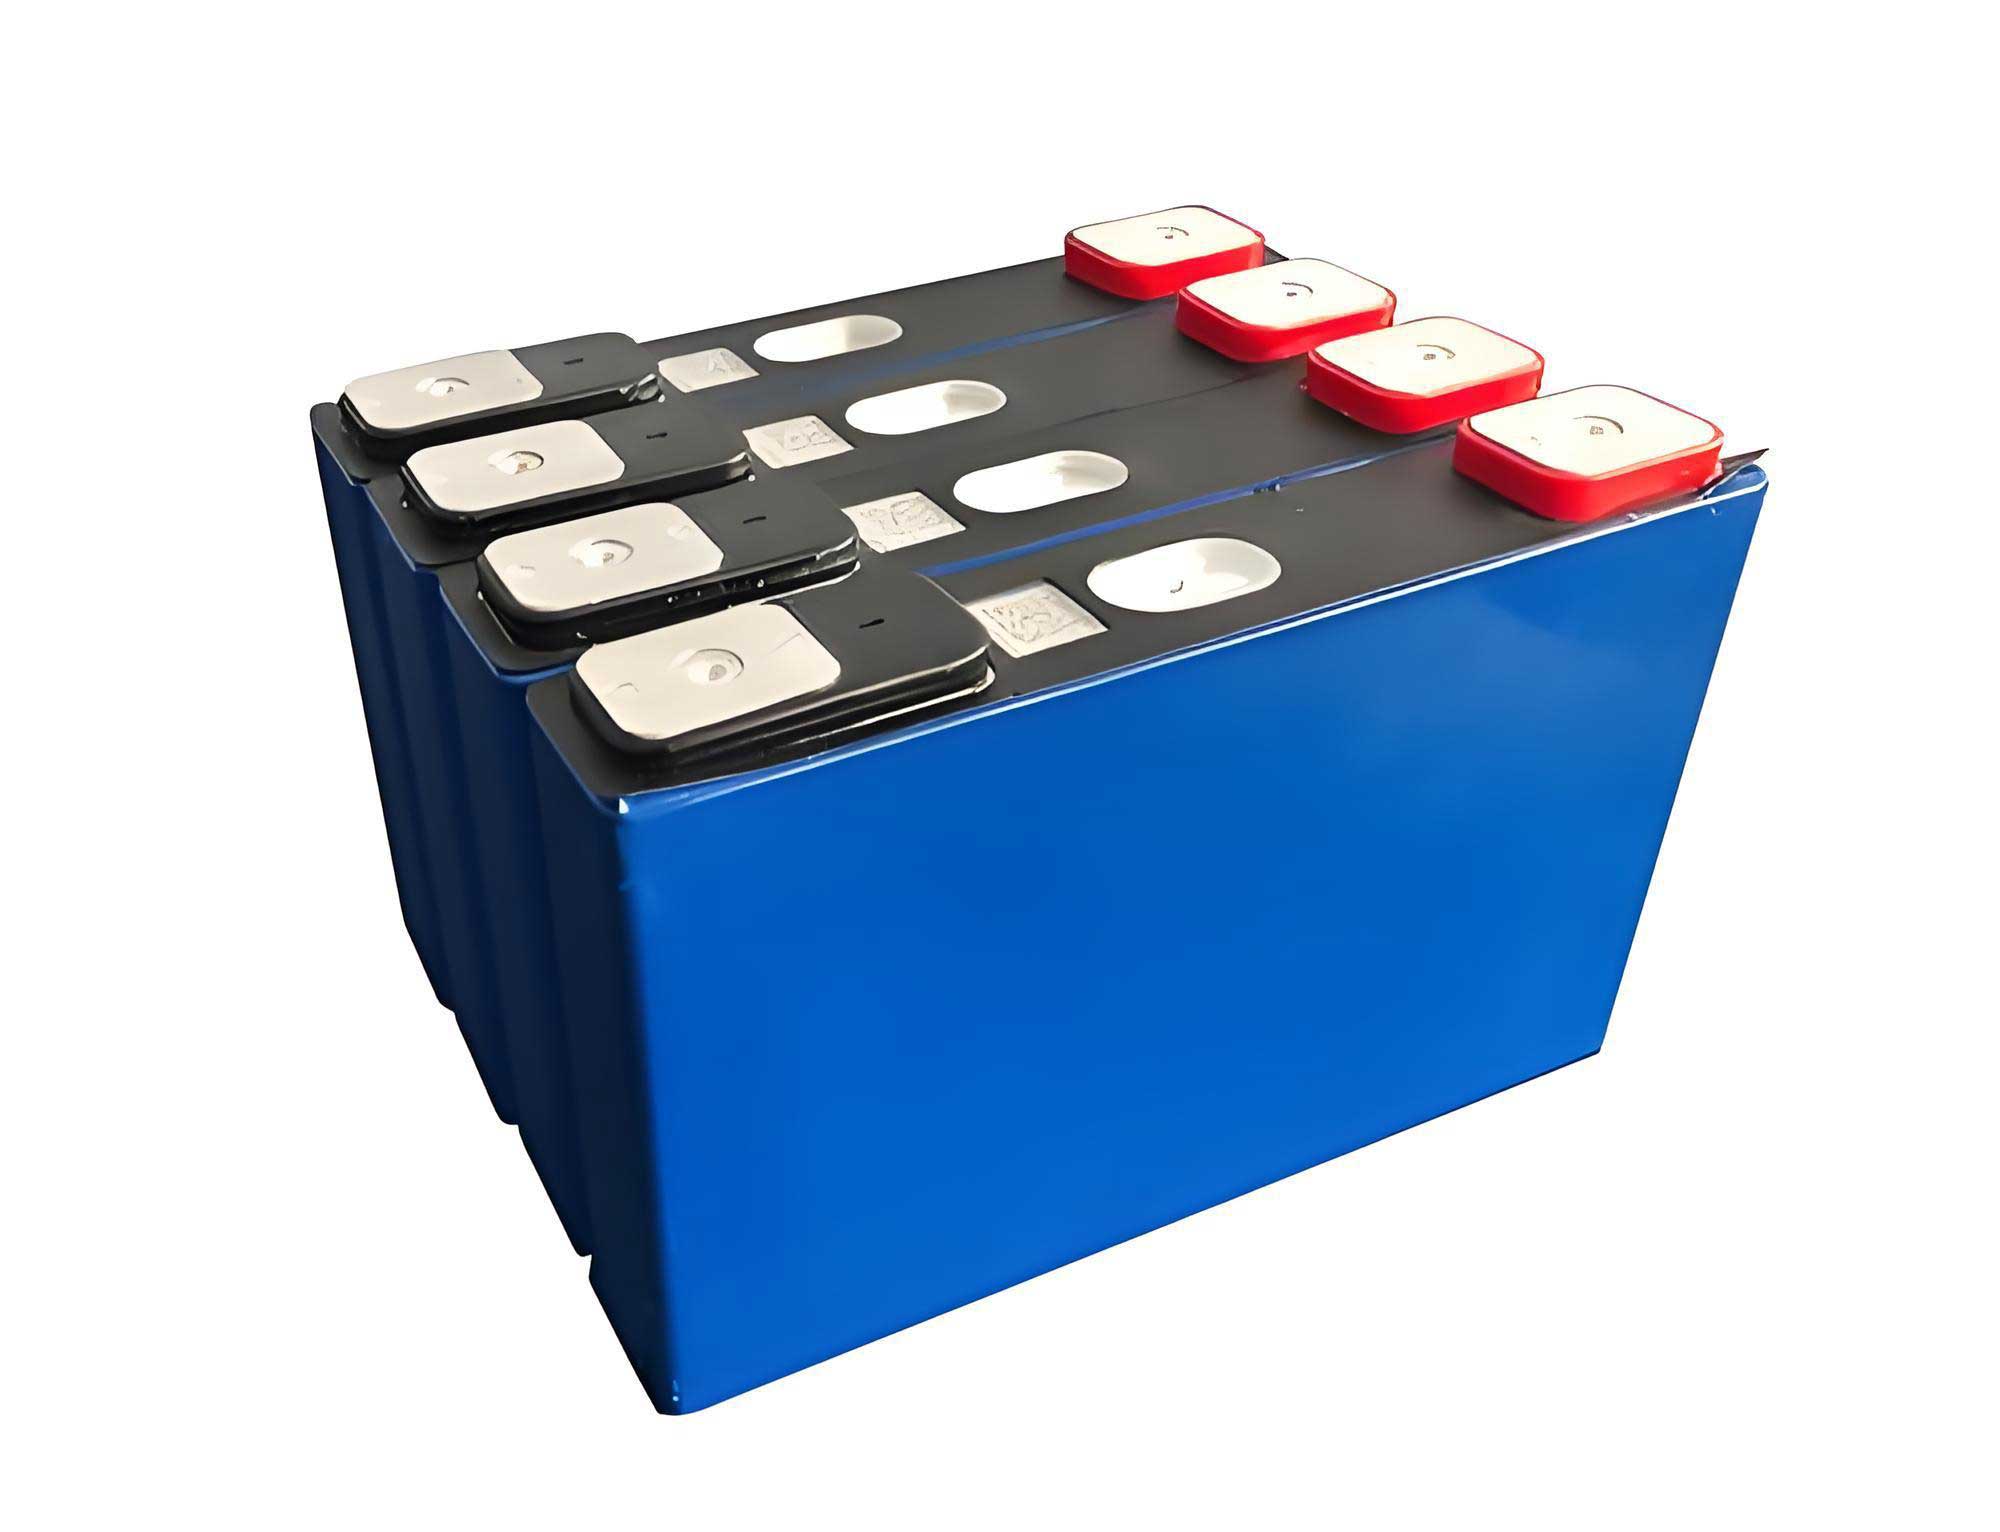
The test object was a commercial prismatic LiFePO4 battery cell. Its key specifications are summarized in Table 1 below.
| Parameter | Specification |
|---|---|
| Cathode Material | Lithium Iron Phosphate (LiFePO4) |
| Anode Material | Graphite |
| Nominal Capacity | 50 Ah |
| Nominal Voltage | 3.2 V |
| Charge Cut-off Voltage | 3.65 V |
| Discharge Cut-off Voltage | 2.5 V |
| Operating Temperature | Charge: 0 to 55°C; Discharge: -20 to 55°C |
The experimental platform integrated several key instruments:
- Battery Test System: A high-precision cycler was used to apply predefined current profiles, including constant current and dynamic driving cycles.
- In-situ Swelling Force Analyzer: A specialized fixture with a high-accuracy force sensor was employed to apply a constant initial clamping force (2000 N) and continuously measure the swelling force exerted by the LiFePO4 battery during testing.
- Environmental Chamber: A thermal chamber provided precise control over the ambient temperature for the tests.
- Data Acquisition System: Synchronized measurements of voltage, current, surface temperature (via thermocouple), and swelling force were recorded at a frequency of 1 Hz.
Test Procedures and Conditions
The experimental matrix was designed to evaluate performance under varied conditions. Tests were performed at four ambient temperatures: 0°C, 10°C, 25°C, and 40°C. At each temperature, the LiFePO4 battery was subjected to two standard dynamic discharge profiles:
- FUDS (Federal Urban Driving Schedule): Represents urban driving conditions with frequent start-stop events.
- US06 (Aggressive Driving Schedule): Represents high-speed and high-acceleration driving.
This resulted in a total of 8 distinct test runs (4 temperatures × 2 profiles). Before each dynamic test, the LiFePO4 battery underwent a standardized conditioning procedure: it was charged to 100% SOC using a Constant Current-Constant Voltage (CC-CV) protocol, rested, and then discharged to 0% SOC with a constant current to calibrate its actual capacity at that specific temperature. This step is crucial for establishing the ground-truth SOC reference during the subsequent dynamic test, calculated using the ampere-hour counting method:
$$ SOC(t) = SOC(t_0) – \frac{1}{C_{\text{actual}}} \int_{t_0}^{t} \eta I(\tau) d\tau $$
where $C_{\text{actual}}$ is the measured capacity from the constant current discharge, $I$ is the instantaneous current (positive for discharge), and $\eta$ is the Coulombic efficiency (assumed to be 1 for discharge).
Data Analysis and Motivation for Force Signal Inclusion
Analysis of the experimental data clearly reveals the fundamental challenge and the proposed solution for SOC estimation in LiFePO4 batteries.
The voltage profiles during dynamic discharges, especially within the mid-SOC range (approximately 20%-80%), show very small variations despite large changes in SOC. This is the characteristic flat voltage plateau of the LiFePO4 battery. In contrast, the swelling force signal exhibits a pronounced and highly nonlinear trajectory. The force generally decreases in the high-SOC region, increases through the mid-SOC plateau, and decreases again as the LiFePO4 battery approaches full discharge. This behavior is attributed to the interplay of expansion and contraction in the graphite anode and LiFePO4 cathode during lithiation/delithiation.
The pivotal insight is that within the voltage plateau region—where the OCV-SOC curve is flat—the swelling force provides a rich, informative signal that strongly correlates with SOC changes. While a single force value may not map uniquely to a single SOC across the entire range due to the non-monotonic sections, the temporal evolution of the force within a sequence provides critical context that a neural network can learn to interpret. Therefore, augmenting the traditional electric (V, I) and temperature (T) inputs with swelling force (F) creates a feature set $\mathbf{X}(t) = [V(t), I(t), T(t), F(t)]$ that contains complementary information, significantly enriching the data available for estimating the state of the LiFePO4 battery.
Proposed SOC Estimation Method
The core of our method is a data-driven model that learns the mapping from the fused Force-Electric-Temperature time-series data to the corresponding SOC value. The process involves data preprocessing, feature engineering, and the specific CNN-BiLSTM model architecture.
Data Preprocessing and Sequence Formation
Raw data from all 8 test runs are consolidated. Each data sample at time $t$ consists of measured values: $\{V(t), I(t), T(t), F(t)\}$. The corresponding ground-truth SOC is calculated via ampere-hour counting with capacity correction. Each feature channel is normalized to the [0, 1] range to ensure stable and efficient neural network training:
$$ x’ = \frac{x – \min(x)}{\max(x) – \min(x)} $$
where $x$ represents a feature vector (e.g., all voltage measurements in the training set).
To capture temporal dynamics, we structure the data into sequences using a sliding window approach. For a time step $t$, the model input is a matrix comprising the previous $n$ time steps:
$$ \mathbf{X}_t = [\mathbf{x}_{t-n+1}, \mathbf{x}_{t-n+2}, …, \mathbf{x}_t]^T $$
where $\mathbf{x}_i = [V'(i), I'(i), T'(i), F'(i)]$ is the normalized feature vector at time $i$, and $n$ is the window length (chosen as 90 in this study). The output label is the SOC at time $t$, $SOC_t$. This creates a supervised learning dataset for sequential regression.
CNN-BiLSTM Hybrid Model Architecture
The architecture is designed to extract both local spatial features and long-term temporal dependencies from the input sequence $\mathbf{X}_t$.
1. 1D Convolutional Layers:
The first stage employs two stacked 1D convolutional layers. The 1D convolution operates along the temporal axis, applying filters to local regions of the sequence to detect local patterns and hierarchical features in the multi-sensor data. This is particularly effective for identifying sharp changes in current or correlations between force and voltage changes within a short time window. The operation for a single filter can be expressed as:
$$ c_i = f(\mathbf{W} * \mathbf{X}_{t[i:i+k]} + b) $$
where $*$ denotes the convolution operation, $\mathbf{W}$ and $b$ are the filter weights and bias, $k$ is the kernel size, and $f$ is the ReLU activation function. The first CNN layer uses 32 filters, and the second uses 64 filters, effectively expanding the feature representation.
2. Bidirectional LSTM Layers:
The feature maps from the CNN are then fed into a two-layer Bidirectional LSTM network. A standard LSTM unit addresses the vanishing gradient problem through gating mechanisms (input gate $i_t$, forget gate $f_t$, output gate $o_t$) and a cell state $c_t$:
$$
\begin{aligned}
i_t &= \sigma(W_{xi}x_t + W_{hi}h_{t-1} + W_{ci}c_{t-1} + b_i) \\
f_t &= \sigma(W_{xf}x_t + W_{hf}h_{t-1} + W_{cf}c_{t-1} + b_f) \\
c_t &= f_t \odot c_{t-1} + i_t \odot \tanh(W_{xc}x_t + W_{hc}h_{t-1} + b_c) \\
o_t &= \sigma(W_{xo}x_t + W_{ho}h_{t-1} + W_{co}c_t + b_o) \\
h_t &= o_t \odot \tanh(c_t)
\end{aligned}
$$
where $\sigma$ is the sigmoid function, $\odot$ is the Hadamard product, $x_t$ is the input, and $h_t$ is the hidden state. A Bi-LSTM runs two independent LSTM layers on the input sequence: one forward and one backward. The final hidden state at each time step is a concatenation of both directions’ outputs, allowing the model to utilize context from both past and future within the sequence. This is powerful for understanding the cumulative effects of battery usage. Each Bi-LSTM layer in our model contains 128 hidden units.
3. Fully Connected Regression Layer:
The final hidden states from the Bi-LSTM layer are flattened and passed through a series of fully connected (dense) layers with dropout regularization to prevent overfitting. The final layer uses a linear activation to produce the scalar SOC estimate:
$$ \widehat{SOC}_t = \mathbf{W}_{fc} \cdot \mathbf{h}_t + b_{fc} $$
where $\mathbf{h}_t$ is the processed feature vector from the previous layers.
4. Loss Function and Training:
The model is trained to minimize the Mean Squared Error (MSE) between the estimated and true SOC values over the training dataset:
$$ \mathcal{L} = \frac{1}{N} \sum_{i=1}^{N} (SOC_i – \widehat{SOC}_i)^2 $$
The Adam optimizer is used for training with a carefully chosen learning rate.
Results and Discussion
The proposed method’s performance is rigorously evaluated. Models are trained on data from one dynamic profile (e.g., US06 at all temperatures) and tested on the unseen profile (e.g., FUDS at all temperatures) to assess generalization. We primarily use Root Mean Square Error (RMSE) and Mean Absolute Error (MAE) as metrics:
$$ \text{RMSE} = \sqrt{ \frac{1}{N} \sum_{i=1}^{N} (SOC_i – \widehat{SOC}_i)^2 } $$
$$ \text{MAE} = \frac{1}{N} \sum_{i=1}^{N} |SOC_i – \widehat{SOC}_i| $$
Impact of Swelling Force Signal Inclusion
We first isolate the contribution of the swelling force signal by comparing the performance of identical CNN-BiLSTM models trained with and without the force input. Table 2 summarizes the test results on the FUDS profile at different temperatures when the model is trained on US06 data.
| Temperature & Input | RMSE (%) | MAE (%) | Max Error (%) |
|---|---|---|---|
| 0°C (with Force) | 2.76 | 2.17 | 15.61 |
| 0°C (without Force) | 4.78 | 3.88 | 16.38 |
| 10°C (with Force) | 1.19 | 0.73 | 7.80 |
| 10°C (without Force) | 4.41 | 3.28 | 14.12 |
| 25°C (with Force) | 2.07 | 1.48 | 10.81 |
| 25°C (without Force) | 4.05 | 2.60 | 26.45 |
| 40°C (with Force) | 2.18 | 2.26 | 8.14 |
| 40°C (without Force) | 4.90 | 3.65 | 23.64 |
The results are unequivocal. At every temperature, the model utilizing the Force-Electric-Temperature fusion significantly outperforms the model using only Electric-Temperature data. The average reduction in RMSE across all temperatures is 43.82%, with the most dramatic improvement at 10°C (73.02% reduction). The maximum error is also substantially reduced in most cases. This confirms that the swelling force provides critical, non-redundant information that compensates for the low sensitivity of voltage in the plateau region of the LiFePO4 battery, leading to a more robust and accurate state estimate.
Performance Across Different Dynamic Profiles
Table 3 shows the performance at 25°C when models are trained on one profile and tested on the other, highlighting the method’s robustness to varying load conditions.
| Test Profile & Input | RMSE (%) | MAE (%) | Max Error (%) |
|---|---|---|---|
| FUDS (with Force) | 2.07 | 1.48 | 10.81 |
| FUDS (without Force) | 4.05 | 2.60 | 26.45 |
| US06 (with Force) | 1.77 | 1.37 | 5.10 |
| US06 (without Force) | 3.79 | 2.52 | 19.10 |
The force-fusion model maintains high accuracy for both the urban-style FUDS and the aggressive US06 profile. The consistency in low RMSE values (1.77-2.07%) demonstrates the generalizability of the learned mapping from force, voltage, current, and temperature to the SOC of the LiFePO4 battery, regardless of the specific current fluctuation pattern.
Comparison with Other Neural Network Architectures
To validate the effectiveness of the proposed CNN-BiLSTM hybrid model, we compare it against three other prevalent data-driven models: a pure CNN, a pure LSTM, and a Transformer encoder. All models are trained and tested under the same conditions (10°C, trained on US06, tested on FUDS) using the full Force-Electric-Temperature input. Results are in Table 4.
| Model Architecture | RMSE (%) | MAE (%) | Max Error (%) |
|---|---|---|---|
| Pure CNN | 2.58 | 1.99 | 12.11 |
| Pure LSTM | 2.14 | 1.39 | 25.81 |
| Transformer | 1.68 | 1.21 | 9.04 |
| Proposed CNN-BiLSTM | 1.19 | 0.73 | 7.80 |
The proposed model achieves the lowest error across all metrics. The pure CNN model, while good at local feature extraction, fails to capture long-term temporal dependencies crucial for cumulative SOC tracking. The pure LSTM model captures temporal dependencies but may not optimally extract complex local patterns from the raw fused signal. The Transformer model shows strong performance, but our CNN-BiLSTM achieves a 29.2% lower RMSE, suggesting that the combined local convolution and bidirectional sequential processing is particularly well-suited for this task. This represents a reduction in RMSE of up to 53.88% compared to the other architectures, underscoring the efficacy of the hybrid design for estimating the state of the LiFePO4 battery.
Conclusion
This study successfully addresses the significant challenge of accurate State of Charge estimation for LiFePO4 batteries by introducing a novel multi-signal fusion approach and an advanced deep learning architecture. The core innovation lies in the integration of in-situ measured swelling force as a complementary information source to the conventional electrical and thermal signals. This Force-Electric-Temperature fusion directly mitigates the adverse effects of the flat voltage plateau characteristic of the LiFePO4 battery, providing the estimation algorithm with a richer, more informative data stream about the internal battery dynamics.
Furthermore, the designed CNN-BiLSTM hybrid neural network model effectively leverages this multi-modal sequential data. The 1D convolutional layers excel at extracting local spatial-temporal patterns and hierarchical features from the input sequences, while the bidirectional LSTM layers capture long-range temporal dependencies and contextual information from both past and future states within the sequence. This combination proves superior to other standalone network models like pure CNN, LSTM, or Transformer for this specific application.
Comprehensive experimental validation under diverse dynamic loads (FUDS, US06) and across a wide temperature range (0°C to 40°C) confirms the method’s robustness and generalizability. Key findings are:
- The inclusion of the swelling force signal dramatically improves SOC estimation accuracy, reducing the average RMSE by 43.82% compared to methods using only voltage, current, and temperature.
- The proposed CNN-BiLSTM model delivers the best performance among tested architectures, achieving an RMSE as low as 1.19% and an MAE of 0.73% under certain conditions.
- The method maintains high accuracy across different operating conditions, demonstrating its practical viability for real-world BMS applications in electric vehicles and energy storage systems utilizing LiFePO4 batteries.
This work provides a significant step forward in data-driven BMS technology for LiFePO4 batteries. Future research may focus on extending this force-fusion framework to state-of-health (SOH) estimation, investigating the method’s performance under ageing conditions, and exploring embedded implementation strategies for onboard BMS deployment.